Laboratory for Interdisciplinary Statistical Analysis - LISA - Virginia ...
Laboratory for Interdisciplinary Statistical Analysis - LISA - Virginia ...
Laboratory for Interdisciplinary Statistical Analysis - LISA - Virginia ...

You also want an ePaper? Increase the reach of your titles
YUMPU automatically turns print PDFs into web optimized ePapers that Google loves.
<strong>Laboratory</strong> <strong>for</strong> <strong>Interdisciplinary</strong><strong>Statistical</strong> <strong>Analysis</strong>Anne Ryanagryan@vt.edu<strong>Virginia</strong> Tech
<strong>Laboratory</strong> <strong>for</strong> <strong>Interdisciplinary</strong> <strong>Statistical</strong><strong>Analysis</strong>1948: The <strong>Statistical</strong> <strong>Laboratory</strong> was founded as a division of the<strong>Virginia</strong> Agricultural Experiment Station to help agronomistsdesign experiments and calculate sums of squares.www.lisa.stat.vt.edu
<strong>Laboratory</strong> <strong>for</strong> <strong>Interdisciplinary</strong> <strong>Statistical</strong><strong>Analysis</strong>1949: Based on the success of the <strong>Statistical</strong> <strong>Laboratory</strong>, theDepartment of Statistics at <strong>Virginia</strong> Polytechnic Institute (VPI)was founded—the 3rd oldest statistics department in the UnitedStates.www.lisa.stat.vt.edu
<strong>Laboratory</strong> <strong>for</strong> <strong>Interdisciplinary</strong> <strong>Statistical</strong><strong>Analysis</strong>1973: The <strong>Statistical</strong> <strong>Laboratory</strong> was re-<strong>for</strong>med as the <strong>Statistical</strong>Consulting Center to assist with statistical analyses in everycollege of <strong>Virginia</strong> Polytechnic Institute & State University(VPI&SU).www.lisa.stat.vt.edu
<strong>Laboratory</strong> <strong>for</strong> <strong>Interdisciplinary</strong> <strong>Statistical</strong><strong>Analysis</strong>2007: The Graduate Student Assembly led a movement to savestatistical consulting and collaboration from death by budgetcuts, ensuring that graduate students could receive help withtheir research.The College of Science, Provost, Vice President of Research,Graduate School, and six additional colleges agreed thatresearchers should be able to receive free statistical consultingand collaboration.www.lisa.stat.vt.edu
<strong>Laboratory</strong> <strong>for</strong> <strong>Interdisciplinary</strong> <strong>Statistical</strong><strong>Analysis</strong>2008: The <strong>Statistical</strong> Consulting Center was re-organized as the<strong>Laboratory</strong> <strong>for</strong> <strong>Interdisciplinary</strong> <strong>Statistical</strong> <strong>Analysis</strong> (<strong>LISA</strong>) tocollaborate with researchers across the <strong>Virginia</strong> Tech (VT)campuses.www.lisa.stat.vt.edu
<strong>Laboratory</strong> <strong>for</strong> <strong>Interdisciplinary</strong> <strong>Statistical</strong><strong>Analysis</strong>YearClients Hours2000 299 13682001 293 19382002 321 22202003 304 21922004 274 17752005 211 4952006 171 5412007 190 9652008 895 21842009 719 30932010 1124 4420Established in 2008www.lisa.stat.vt.edu
<strong>Laboratory</strong> <strong>for</strong> <strong>Interdisciplinary</strong> <strong>Statistical</strong><strong>Analysis</strong>YearClients Hours2000 299 13682001 293 19382002 321 22202003 304 21922004 274 17752005 211 4952006 171 5412007 190 9652008 895 21842009 719 30932010 1124 4420Clients per year0 300 600 900 12002000 2002 2004 2006 2008 2010Yearwww.lisa.stat.vt.edu
<strong>Laboratory</strong> <strong>for</strong> <strong>Interdisciplinary</strong> <strong>Statistical</strong><strong>Analysis</strong>YearClients Hours2000 299 13682001 293 19382002 321 22202003 304 21922004 274 17752005 211 4952006 171 5412007 190 9652008 895 21842009 719 30932010 1124 4420Hours per year0 1000 2000 3000 4000 50002000 2002 2004 2006 2008 2010Yearwww.lisa.stat.vt.edu
<strong>LISA</strong> helps VT researchers benefitfrom the use of Statistics<strong>Laboratory</strong> <strong>for</strong> <strong>Interdisciplinary</strong> <strong>Statistical</strong><strong>Analysis</strong>Experimental Design • Data <strong>Analysis</strong> • Interpreting ResultsGrant Proposals • Software (R, SAS, JMP, SPSS...)Our goal is to improve the quality ofresearch and the use of statistics at <strong>Virginia</strong>Tech.www.lisa.stat.vt.edu10
<strong>LISA</strong> helps VT researchers benefitfrom the use of Statistics<strong>Laboratory</strong> <strong>for</strong> <strong>Interdisciplinary</strong> <strong>Statistical</strong><strong>Analysis</strong>Collaboration<strong>LISA</strong> statisticians meet withfaculty, staff, and graduatestudents to understandtheir research and think ofways to help them usingstatistics.www.lisa.stat.vt.edu11
<strong>LISA</strong> helps VT researchers benefitfrom the use of Statistics<strong>Laboratory</strong> <strong>for</strong> <strong>Interdisciplinary</strong> <strong>Statistical</strong><strong>Analysis</strong>CollaborationWalk-In ConsultingEvery day from 1-3PMclients get answers to their(quick) questions about usingstatistics in their research.www.lisa.stat.vt.edu12
<strong>LISA</strong> helps VT researchers benefitfrom the use of Statistics<strong>Laboratory</strong> <strong>for</strong> <strong>Interdisciplinary</strong> <strong>Statistical</strong><strong>Analysis</strong>CollaborationWalk-In ConsultingShort CoursesShort Courses aredesigned to teachgraduate students howto apply statisticsin their research.www.lisa.stat.vt.edu13
<strong>LISA</strong> helps VT researchers benefitfrom the use of Statistics<strong>Laboratory</strong> <strong>for</strong> <strong>Interdisciplinary</strong> <strong>Statistical</strong><strong>Analysis</strong>CollaborationWalk-In ConsultingShort CoursesAll services are FREE<strong>for</strong> VT researchers.We assist with research—notclass projects or homework.www.lisa.stat.vt.edu14
How can <strong>LISA</strong> help?• Formulate research question.• Screen data <strong>for</strong> integrity and unusual observations.• Implement graphical techniques to showcase thedata – what is the story?• Develop and implement an analysis plan to addressresearch question.• Help interpret results.• Communicate! Help with writing the report or givingthe talk.• Identify future research directions.
<strong>Laboratory</strong> <strong>for</strong> <strong>Interdisciplinary</strong> <strong>Statistical</strong><strong>Analysis</strong>To request a collaboration meeting go towww.lisa.stat.vt.eduwww.lisa.stat.vt.edu
<strong>Laboratory</strong> <strong>for</strong> <strong>Interdisciplinary</strong> <strong>Statistical</strong><strong>Analysis</strong>To request a collaboration meeting go to www.lisa.stat.vt.edu1. Sign in to the website using your VT PID and password.2. Enter your in<strong>for</strong>mation (email address, college, etc.)3. Describe your project (project title, research goals,specific research questions, if you have already collecteddata, special requests, etc.)4. Wait 0-3 days, then contact the <strong>LISA</strong> collaboratorsassigned to your project to schedule an initial meeting.www.lisa.stat.vt.edu
<strong>Laboratory</strong> <strong>for</strong> <strong>Interdisciplinary</strong> <strong>Statistical</strong><strong>Analysis</strong>www.lisa.stat.vt.edu
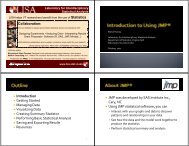
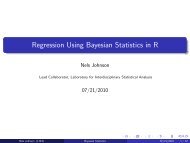
Introduction to R• R is a free software environment <strong>for</strong> statisticalcomputing and graphics. Download:http://www.r-project.org/• Topics Covered:• Data objects in R, loops, import/exportdatasets, data manipulation• Graphing• Basic Analyses: T-tests, Regression,ANOVA<strong>Laboratory</strong> <strong>for</strong> <strong>Interdisciplinary</strong> <strong>Statistical</strong><strong>Analysis</strong>www.lisa.stat.vt.edu
<strong>Laboratory</strong> <strong>for</strong> <strong>Interdisciplinary</strong> <strong>Statistical</strong><strong>Analysis</strong>Linear Regression & Structural Equation Monitoring• Linear regression is used to model therelationship between a continuous responseand a continuous predictor.• SEM is a modeling technique thatinvestigates causal relationships amongvariables.• Time –related latent variables, modificationindices and critical ratio in exploratoryanalyses, and computation of impliedmoments, factor score weights, totaleffects, and indirect effects.www.lisa.stat.vt.edu
<strong>Laboratory</strong> <strong>for</strong> <strong>Interdisciplinary</strong> <strong>Statistical</strong><strong>Analysis</strong>Generalized Linear Models• Modeling technique <strong>for</strong> situations wherethe errors are not necessarily normal.• Can handle situations where you havebinary responses, counts, etc.• Uses a link function to relate the responseto the linear model.• Cover: Basic statistical concepts of GLMand how it relates to regression usingnormal errors.www.lisa.stat.vt.edu
<strong>Laboratory</strong> <strong>for</strong> <strong>Interdisciplinary</strong> <strong>Statistical</strong><strong>Analysis</strong>Mixed Models and Random Effects• Mixed Model: A statistical model that has bothrandom effects and fixed effects.• Fixed Effect: Levels of the factor arepredetermined. Random Effect: Levels of thefactor were chosen at random.• The primary focus of the course will be toidentify scenarios where a mixed modelapproach will be appropriate. The concepts willbe explained almost wholly through examplesin SAS or in R.www.lisa.stat.vt.edu
Anne Ryan23
Defense:Represent the accused (defendant) Prosecution:Hold the “Burden of Proof”—obligationto shift the assumed conclusion from anoppositional opinion to one’s ownposition through evidence What’s the Assumed Conclusion?ANSWER: The accused is innocent until provenguilty.•Prosecution must convince the judge/jury that thedefendant is guilty beyond a reasonable doubt24
Burden of Proof—Obligation to shift theconclusion using evidenceHypothesisTestTrialAccept the status quo(what is believedbe<strong>for</strong>e) until the datasuggests otherwiseInnocent untilproven guilty25
Decision CriteriaHypothesisTestTrialOccurs by chanceless than 100α% ofthe time (ex: 5%)Evidence has toconvincing beyonda reasonable26
Hypothesis Test: Procedure <strong>for</strong> examining aclaim about the value of a parameter◦ i.e. 3.5 Hypothesis tests are very methodical withseveral key pieces.27
1. Test2. Assumptions3. Hypotheses4. Mechanics5. Conclusion28
State the name of the testing method to beused It is important to not be off track in the verybeginning Hypothesis Tests we will Per<strong>for</strong>m:◦ One Sample test <strong>for</strong> μ◦ Two sample t test <strong>for</strong> μ◦ Paired test◦ ANOVA29
List all the assumptions required <strong>for</strong> your testto be valid. All tests have assumptions Even if assumptions are not met you shouldstill comment on how this affects yourresults.30
State the hypothesis of interest There are two hypothesesH 0◦ Null Hypothesis: Denoted◦ Alternative Hypothesis: DenotedorH aH 113 Examples of possible hypotheses:H0: 13vs.Ha: 31
For hypothesis testing there are three popularversions of testing◦ Left Tailed Hypothesis Test◦ Right Tailed Hypothesis Test◦ Two Tailed or Two Sided Hypothesis Test32
1. Left Tailed Hypothesis Test:• Researchers are only interested in whetherthe true value is below the hypothesizedvalue.• e.g—H0 vs.H :: 0a0• e.g.– 2. Right Tailed Hypothesis Test:• Researchers are only interested in whetherthe True Value is above the hypothesizedvalue.33
3. Two Tailed or Two Sided Hypothesis Test:The researcher is interested in lookingabove and below they hypothesized value.Hvs.H :0 0a: 034
Three Requirements <strong>for</strong> Stating Hypotheses:1. Two complementary hypotheses.•andor2. A parameter about which the test is to be based• e.g.—μ3. Hypothesized Value <strong>for</strong> parameterand• Denoted but generally takes on numeric values inpractice35
Computational Part of the Test What is part of the Mechanics step?◦ Stating the Significance Level◦ Finding the Rejection Rule◦ Computing the Test Statistic◦ Computing the p-value36
Significance Level: Here we choose a value touse as the significance level, which is thelevel at which we are willing to start rejectingthe null hypothesis. Denoted by αDefault value is α=.05, use α=.05 unlessotherwise noted!37
Rejection Rule: State our criteria <strong>for</strong> rejectingthe null hypothesis.◦ “Reject the null hypothesis if p-value
Test Statistic: Compute the test statistic,which is usually a standardization of yourpoint estimate.Translates your point estimate, a statistic,to follow a known distribution so that is canbe used <strong>for</strong> a test.39
p-value: After computing the test statistic,now you can compute the p-value.Use software to compute p-values.40
Conclusion: Last step of the hypothesis testjust like it is the last step when computingconfidence intervals. Conclusions should always include:◦ Decision: reject or fail to reject◦ Linkage: why you made the decision (interpret p-value)◦ Context: what your decision means in context ofthe problem.41
Note: Your decision can only be one of twochoices:1. Reject H 0 --data gives strong indication thatH a is more likely2. Fail to Reject H 0 --data gives no strongindication that H ais more likely When conducting hypothesis tests, weassume that H 0 is true, there<strong>for</strong>e thedecision CAN NOT be to accept the nullhypothesis42
Used to test whether the population mean isdifferent from a specified value. Example: Is the mean height of 12 year oldgirls greater than 60 inches?http://office.microsoft.com/en-us/images44
The population mean is not equal to a specifiedvalue.Null Hypothesis, H 0 : μ = μ 0Alternative Hypothesis: H a : μ≠ μ 0 The population mean is greater than a specifiedvalue.H 0 : μ = μ 0H a : μ > μ 0 The population mean is less than a specified value.H 0 : μ = μ 0H a : μ < μ 045
The sample is random. The population from which the sample isdrawn is either normal or the sample size islarge.46
Step 3: Calculate the test statistic:Wheresni1yiy 0s / n Step 4: Calculate the p-value based on theappropriate alternative hypothesis. Step 5: Write a conclusion.tn 1y247
A researcher would like to know whether the meansepal width of a variety of irises is different from 3.5cm. Use 0.05.The researcher randomly selects 50 irises andmeasures the sepal width.Step 1: HypothesesH 0 : μ = 3.5 cmH a : μ ≠ 3.5 cmhttp://en.wikipedia.org/wiki/Iris_flower_data_set48
Steps 2-4:JMP DemonstrationAnalyze DistributionY, Columns: Sepal WidthNormal Quantile PlotTest MeanSpecify Hypothesized Mean: 3.549
Step 5 Conclusion: Fail to reject since thep-value=0.1854 is greater than 0.05. There issignificant sample evidence to indicate thatthe mean sepal width is not different from 3.5cm.50
Two sample t-tests are used to determinewhether the population mean of one group isequal to, larger than or smaller than thepopulation mean of another group. Example: Is the mean cholesterol of peopletaking drug A lower than the meancholesterol of people taking drug B?52
The population means of the two groups are notequal.H 0 : μ 1 = μ 2H a : μ 1 ≠ μ 2 The population mean of group 1 is greater than thepopulation mean of group 2.H 0 : μ 1 = μ 2H a : μ 1 > μ 2 The population mean of group 1 is less than thepopulation mean of group 2.H 0 : μ 1 = μ 2H a : μ 1 < μ 253
The two samples are random andindependent. The populations from which the samples aredrawn are either normal or the sample sizesare large. The populations have the same standarddeviation.54
Step 3: Calculate the test statistictspy11n1y21n2where( n121)s1 ( n21)sn n 21222s p55 Step 4: Calculate the appropriate p-value. Step 5: Write a Conclusion.
A researcher would like to know whether themean sepal width of setosa irises is differentfrom the mean sepal width of versicolor irises. The researcher randomly selects 50 setosa irisesand 50 versicolor irises and measures their sepalwidths. Step 1 Hypotheses:H 0 : μ setosa = μ versicolorH a : μ setosa ≠ μ versicolorhttp://en.wikipedia.org/wiki/Iris_flower_data_sethttp://en.wikipedia.org/wiki/Iris_versicolor56
Steps 2-4:JMP Demonstration:Analyze Fit Y By XY, Response: Sepal WidthX, Factor: SpeciesMeans/ANOVA/Pooled tNormal Quantile Plot Plot Actual by Quantile57
setosa-2.33 -1.64-1.28 -0.67 0.0 0.67 1.281.64 2.33versicolor0.020.10.20.50.80.90.98Normal Quantile Step 5 Conclusion: There is strong evidence(p-value < 0.0001) that the mean sepal widths<strong>for</strong> the two varieties are different.58
The paired t-test is used to compare thepopulation means of two groups when thesamples are dependent. Example:A researcher would like to determine ifbackground noise causes people to take longerto complete math problems. The researcher gives20 subjects two math tests one with completesilence and one with background noise andrecords the time each subject takes to completeeach test.60
The population mean difference is not equal to zero.H 0 : μ difference = 0H a : μ difference ≠ 0 The population mean difference is greater than zero.H 0 : μ difference = 0H a : μ difference > 0 The population mean difference is less than a zero.H 0 : μ difference = 0H a : μ difference < 061
The sample is random. The data is matched pairs. The differences have a normal distribution orthe sample size is large.62
Step 3: Calculate the test Statistic:tsdd/ 0Where d bar is the mean of the differences ands d is the standard deviations of the differences.n Step 4: Calculate the p-value. Step 5: Write a conclusion.63
A researcher would like to determine whethera fitness program increases flexibility. Theresearcher measures the flexibility (in inches)of 12 randomly selected participants be<strong>for</strong>eand after the fitness program. Step 1: Formulate a HypothesisH 0 : μ After - Be<strong>for</strong>e = 0H a : μ After - Be<strong>for</strong>e > 0http://office.microsoft.com/en-us/images64
Steps 2-4:JMP <strong>Analysis</strong>:Create a new column of After – Be<strong>for</strong>eAnalyze DistributionY, Columns: After – Be<strong>for</strong>eNormal Quantile PlotTest MeanSpecify Hypothesized Mean: 065
Step 5 Conclusion: There is not evidence thatthe fitness program increases flexibility.66
ANOVA is used to determine whether three ormore populations have different distributions.A B CMedical Treatment68
The first step is to use the ANOVA F test todetermine if there are any significant differencesamong the population means. If the ANOVA F test shows that the populationmeans are not all the same, then follow up testscan be per<strong>for</strong>med to see which pairs of populationmeans differ.69
yyijWhereijiij i 1,,rj 1,,niiijis the response of the jth trial on the ith factor level is the mean of the ith group2~ N(0, )In other words, <strong>for</strong> each group the observedvalue is the group mean plus some randomvariation.70
Step 1: We test whether there is adifference in the population means.HH0a: 12:The are not all equal.i r71
The samples are random and independent ofeach other. The populations are normally distributed. The populations all have the same standarddeviations. The ANOVA F test is robust to the assumptionsof normality and equal standard deviations.72
CA B C A BMedical TreatmentCompare the variation within the samples to thevariation between the samples.73
FVariation between GroupsVariation within GroupsMSGMSEVariation within groupssmall compared withvariation between groups→ Large FVariation within groupslarge compared withvariation between groups→ Small F74
The mean square <strong>for</strong> groups, MSG, measures thevariability of the sample averages. SSG stands <strong>for</strong> sums of squares groups.MSGSSGr -1n ( yy) n( y y)r -1n( y221 1 2 2r 1y)275
Mean square error, MSE, measures the variabilitywithin the groups. SSE stands <strong>for</strong> sums of squares error.MSE WhereSSEn - r(n -1)s121(n22-1)s2n - r(nr-1)s2rsinij1( yniij1yi)76
Step 4: Calculate the p-value. Step 5: Write a conclusion.77
A researcher would like to determine if threedrugs provide the same relief from pain. 60 patients are randomly assigned to atreatment (20 people in each treatment). Step 1: Formulate the HypothesesH 0 : μ Drug A = μ Drug B = μ Drug CH a : The μ i are not all equal.http://office.microsoft.com/en-us/images78
JMP demonstrationAnalyze Fit Y By XY, Response: PainX, Factor: DrugNormal Quantile Plot Plot Actual by QuantileMeans/ANOVA79
75Drug BDrugDrugAC-2.33 -1.64-1.28 -0.67 0.0 0.67 1.281.64 2.3370Pain65605550Drug A Drug B Drug CDrug0.020.10.20.50.80.90.98Normal Quantile Step 5 Conclusion: There is strong evidencethat the drugs are not all the same.80
The p-value of the overall F test indicatesthat the level of pain is not the same <strong>for</strong>patients taking drugs A, B and C. We would like to know which pairs oftreatments are different. One method is to use Tukey’s HSD (honestlysignificant differences).81
Tukey’s test simultaneously testsHH0a: i: ii'i'<strong>for</strong> all pairs of factor levels. Tukey’s HSDcontrols the overall type I error. JMP demonstrationOneway <strong>Analysis</strong> of Pain By Drug Compare Means All Pairs, Tukey HSD82
LevelDrug CDrug CDrug B- LevelDrug ADrug BDrug ADifference5.8500003.6000002.250000Std Err Dif1.6776651.6776651.677665Lower CL1.81283-0.43717-1.78717Upper CL9.8871737.6371736.287173p-Value0.0027*0.08970.3786 The JMP output shows that drugs A and Care significantly different.83
We are interested in the effect of twocategorical factors on the response. We are interested in whether either of the twofactors have an effect on the response andwhether there is an interaction effect.◦ An interaction effect means that the effect on theresponse of one factor depends on the level of theother factor.85
No InteractionInteractionImprovementDrug ADrug BImprovementDrug ADrug BLow HighDosageLow HighDosage86
yyijkWhereijk is the overall meanij( )ijk ( )ij2~ N(0, )i 1,,aj 1,,bk 1,...,nijij is the main effect of the ith level of factor Aij ijkis the response of the kth trial on the ith factor A level and the jth factor B level is the main effect of the jth level of factor Bis the interaction effect of the ith level of factor A and the jth level of factor B87
We would like to determine the effect of twoalloys (low, high) and three coolingtemperatures (low, medium, high) on thestrength of a wire. JMP demonstrationAnalyze Fit Modelhttp://office.microsoft.com/en-us/imagesY: StrengthHighlight Alloy and Temp and click Macros Factorial to DegreeRun Model88
Conclusion: There is strong evidence of aninteraction between alloy and temperature.89
The one sample t-test allows us to testwhether the population mean of a group isequal to a specified value. The two-sample t-test and paired t-testallow us to determine if the population meansof two groups are different. ANOVA allows us to determine whether thepopulation means of several groups aredifferent.90
For in<strong>for</strong>mation about using SAS, SPSS and Rto do ANOVA:http://www.ats.ucla.edu/stat/sas/topics/anova.htmhttp://www.ats.ucla.edu/stat/spss/topics/anova.htmhttp://www.ats.ucla.edu/stat/r/sk/books_pra.htm91
Fisher’s Irises Data (used in one sample andtwo sample t-test examples). Flexibility data (paired t-test example):Michael Sullivan III. Statistics In<strong>for</strong>medDecisions Using Data. Upper Saddle River,New Jersey: Pearson Education, 2004: 602.92
Special thanks to Jennifer Kensler <strong>for</strong> coursematerials and help with JMP!93