
You also want an ePaper? Increase the reach of your titles
YUMPU automatically turns print PDFs into web optimized ePapers that Google loves.
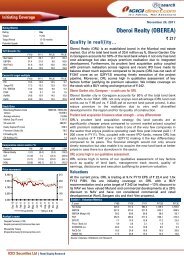
INDIAInstitutional ResearchCEMENT<strong>Ambuja</strong> <strong>Cements</strong> <strong>Ltd</strong>.Attractively valued post correction, better placed among peersInitiating CoverageDate: 10 May 2012Analyst:Suhani Patelsuhani.patel@networthdirect.<strong>com</strong>Ph. No. 022 3064 1744<strong>Ambuja</strong> cements <strong>Ltd</strong>. (ACEM), part of Holcim Group, has the mostattractive regional positioning among large cement players with noexposure to South (where oversupply concerns prevails). This will help toimprove its capacity utilization and pricing power. Historically the<strong>com</strong>pany always traded at a significant premium to the prevailingreplacement cost, given its higher profitability and leading return ratios.We expect this premium to continue as profitability improves.Our TP for ACEM based on 8× CY13E EBIDTA stands at Rs 180 whichimplies 23% return. We initiate coverage on ACEM with a Buy rating.Investment ThemeFavorable regional mixACEM has a strong presence in regions other than South India, the latterbeing at the greatest risk of cement oversupply. Though other regionsenjoy 80–90% utilisation while, South is still running at capacity utilisationlevels of just 60-65%. Considering strong demand scenario in North andWest, we expect volume growth to improve to 9% CAGR over CY11-13 asagainst 5% CAGR over CY09-11.Better EBITDA margins <strong>com</strong>pared to peersWe expect ACEM to continue registering higher EBITDA margins<strong>com</strong>pared to peers owing to 1) its strong focus upon regions exhibitingrising demand such as Western and Northern India 2) Better logistical setup with 10 ships for sea transportation to Western coast 3) strongnetwork of 7800 dealers and 25000 retailers allowing it to sell 80% of theproducts to the retail segment where prices are higher than the bulkmarket.Healthy balance-sheet provides <strong>com</strong>fort<strong>Ambuja</strong> has the strongest balance sheet among its peers. At the end ofCY11, it had a net cash of Rs 20bn. As the operating cash flows of the<strong>com</strong>pany are likely to be much higher than its capex, we expect the<strong>com</strong>pany to generate free cash flow of Rs 29bn over the next two years.Hence we believe the <strong>com</strong>pany is well placed to tap inorganic growth,given the potential scope for consolidation within the industry due toexcess capacity.RatingBUYTarget Price ` 180CMP ` 146Upside 23%Sensex 16479Key DataBloomberg Code ACEM IN EquityReuters Code<strong>Ambuja</strong>.BONSE CodeAMBUJACEMCurrent Share o/s (mn) 1534.4Diluted Share o/s (mn) 1534.4Mkt Cap (`bn/$mn) 226.7/4253.952 WK H/L (`) 182/119.9Daily Vol. (6M NSE Avg) 2817197Face Value (`) 2Beta 0.831 USD/` 53.3Shareholding Pattern (%)Promoters 50.3FII 25.8Others 23.9Price Performance (%)1M 6M 1yr<strong>Ambuja</strong> -11.5 -14.1 7.6Sensex -4.1 -6.5 -9.2Source: Bloomberg; *As on 98 th May, 2012ValuationOn EV/EBITDA basis, the <strong>com</strong>pany is trading at 7.4x CY12E EBITDA and6.1x CY13E EBITDA respectively. We value the business at 8x CY13EEBITDA. Our CY13 based target price is Rs 180 per share, implying 23%upside.(Rs Cr)Revenue YoY% EBIDTA Margins (%) PAT Margins (%) FDEPS ROE (%) RoCE (%) P/E P/B EV/EBIDTA2010 7390 4.4 1823 24.7 1263 17.1 8.3 17.2 21.2 17.6 3.0 10.92011 8531 15.4 1906 22.3 1227 14.4 8.0 15.3 20.3 18.1 2.8 10.22012E 9861 15.6 2449 24.8 1443 14.6 9.4 15.9 22.0 15.4 2.4 7.42013E 11389 15.5 2821 24.8 1703 15.0 11.1 16.4 23.0 13.1 2.1 6.1Initial CoverageNetworth Research is also available on Bloomberg and ThomsonReuters.1
Investment ThemeThird largest cement manufacturer with no presence in south<strong>Ambuja</strong> Cement (owned by Switzerland based Holcim group) is the third largest cement manufacturer in India havingcement capacity of 27.35 MTPA and clinker capacity of 16.8 MTPA. The <strong>com</strong>pany has a strong presence in regionsother than South, which is at a risk of cement oversupply.Exhibit 1: Market share (%) in different regionsIts largest markets are North India (40%of sales volumes) and West India (40%).East India accounts for 20% of itsvolumes.24%17%12%North East WestSource: Company, Networth ResearchExhibit 2: Region-wise cement capacity (%)5%24%41%30%Source: Company, Networth ResearchNorth West East CentralExhibit 3: Region-wise volume break-up (%)40%40%20%North & Central East WestSource: Company, Networth ResearchInitiating Coverage2
Northern Region: Demand growth continues.Northern region has posted a healthy growth of 10% CAGR in FY08-11. However, the region had exhibited agrowth of mere 3% in FY11, lowest in the last four years owing to slower demand.In FY12 North region reported growth of 13% primarily on account of strong demand in major states (Punjaband Rajasthan) of North, which grew by 6%Y-o-Y respectively. We expect demand to grow at CAGR of 10% overFY12-14E on account of softening of interest rates and start of work on the Delhi Mumbai Industrial Corridorand Delhi Metro rail Corporation. At the same time with no major capacity to hit the market, we expect thecapacity to witness a CAGR of 7% in FY12-14E. Hence, we believe the utilisation to reach to 89% in FY14E.Exhibit 6: Capacity utilisation trend in North80706050403020100FY09 FY10 FY11 FY12E FY13E FY14E95%90%85%80%75%70%Effective cement capacity (mn tonnes)Capacity utilisation (%)Despatches (mn tonnes)Source: Company, Networth ResearchBetter EBITDA margins <strong>com</strong>pared to peersWe expect ACEM to continue registering higher EBITDA margins <strong>com</strong>pared to peers owing to 1) its strong focusupon regions exhibiting rising demand such as Western and Northern India 2) Better logistical set up with 10ships for sea transportation to Western coast 3) strong network of 7800 dealers and 25000 retailers allowing itto sell 80% of the products to the retail segment where prices are higher than the bulk market.Average OPM at ACEM over the next 2years are expected at 25% <strong>com</strong>pared to21-22% for the players like Ultratech andACC.Exhibit 7: Best among the peers40%35%30%25%20%15%10%5%0%CY07 CY08 CY09 CY10 CY11 CY12E CY13EACC <strong>Ambuja</strong> Ultratech**For Ultratech cement CY07 is FY08 and so on.Source: Company, Networth ResearchInitiating Coverage4
Healthy balance-sheet provides <strong>com</strong>fort<strong>Ambuja</strong> has the strongest balance sheet among its peers. At the end of CY11, it had a net cash of Rs 20bn. As theoperating cash flows of the <strong>com</strong>pany are likely to be much higher than its capex, we expect the <strong>com</strong>pany togenerate free cash flow of Rs 29bn over the next two years. Hence we believe the <strong>com</strong>pany is well placed to tapinorganic growth, given the potential scope for consolidation within the industry due to excess capacity.Exhibit 8: Free cash flow and D/E trend180016001400120010008006004002000CY08 CY09 CY10 CY11 CY12E CY13E0.060.050.040.030.020.010.00FCF (Rs cr)D/ESource: Company, Networth ResearchFinancial OutlookACEM’s revenue is expected to grow at a CAGR of 15% over CY11-CY13E mainly on account of substantialcontribution <strong>com</strong>ing from western and Northern region where demand is very strong which will help to boostthe volumes and aid further price hike. EBIDTA margin is expected to improve from 22.3% in CY11 to 24.8% inCY13E (an increase of 250 bps), which is mainly on account of hike in realisation, shift towards captive powerplant.Exhibit 9: Net Sales outlook120001000080006000400020000CY08 CY09 CY10 CY11 CY12E CY13E181614121086420Net salesYoY%Source: Company, Networth ResearchInitiating Coverage5
Exhibit 10: EBITDA and PAT margins (%)30%25%20%15%10%5%0%CY08 CY09 CY10 CY11 CY12E CY13EEBITDA Margin (%) PAT Margin (%)Source: Company, Networth ResearchExhibit 11: ROE and ROCE (%)30%25%20%15%10%5%0%CY08 CY09 CY10 CY11 CY12E CY13ESource: Company, Networth ResearchROE (%) ROCE (%)Initiating Coverage6
Investment ConcernsAdverse ruling on cartel by CCIThe Competition Commission of India (CCI) has <strong>com</strong>pleted its enquiry on 40 cement <strong>com</strong>panies regarding pricefixing, and is likely to table its report soon. If found guilty, the CCI will likely announce penalties in the nextmonth or so. Based on recent trends, it is likely to be 6–7% of total revenue or around 50% of Net Profit.Higher than expected fuel cost may impact the marginsACEM’s current fuel mix <strong>com</strong>prises linkage coal to the extent of 35%, imported coal at 30% and the balance ismet through e‐auction coal. Going forward, if due to coal India’s inability to ramp up the production may resultin lower linkage coal, ACEM may have to <strong>com</strong>pensate the short fall by expensive imported coal which mayreduce the OPMs going forward.Initiating Coverage7
ValuationWe have a positive view on the cement sector, driven by our belief that: 1) the current price discipline amongproducers will persist; 2) demand growth is likely to bounce back in 2HFY13; 3) FY14 will be driven by increasedinvestment in infrastructure and government spending before the state and central elections; 4) Softening ofinterest rates would be a big positive for the sector, thereby positively impacting the credit off take from bothhousing and industrial segment.Indian cement <strong>com</strong>panies have declined by 10-15% from the recent peak, driven essentially by fears of largepenalty in the CCI investigation. There is no clarity as to when the final report would be submitted. Stocks cansee a rebound from current levels if the CCI investigation report is not harsh on the industry and vice versa. Atthe current price, stock is trading at rich 6.1x CY13E EV/ EBITDA and EV/ton of $131. Looking at the currentEV/tonne of $ 142 the stock is trading at a significant premium over the replacement cost of $110 per tonne.However we believe that ACEM deserves the premium valuation due to strong presence in high growth marketsand its healthy financials.Exhibit 12: Comparison with peersCompanies CMP Market Cap CY11 CY12E CY13EEV/Ton ($)ACC 1224 22999.0 11.4 10.4 9.3 136<strong>Ambuja</strong> 146 22401.5 9.7 8.3 7.3 142Ultratech* 1404 38469.6 9.6 8.7 7.6 161*CY11=FY12 and so on , Source: Company, Networth ResearchEV/EBITDAWe initiate coverage of ACEM with a Buy rating and target price of Rs 180 based on its 5-year averageEV/EBITDA of 8x.Exhibit 13: ValuationValuation MethadologyCY13EBITDA 2821.3EV/EBITDA 8EV 22570.2Debt 69.6Cash 4253.5Investments 806.0Market Cap 27560.2No. of shares 153.4Target value 180Source: Company, Networth ResearchInitiating Coverage8
Exhibit 14: One year forward EV/EBITDA band40000.0035000.0030000.0025000.0020000.0015000.0010000.005000.000.004X6 X8 X10 X12 X14 XSource: Company, Networth ResearchInitiating Coverage9
Company Background<strong>Ambuja</strong> <strong>Cements</strong> Limited was set up in 1986. The <strong>com</strong>pany is controlled by the Holcim group, which owns 51%.The total capacity of the <strong>com</strong>pany as on CY11 is 27.35 MTPA with 410 MW of captive power capacity. <strong>Ambuja</strong>has a presence in all the regions except South. Its plants are situated in Gujarat, Maharashtra, HimachalPradesh, Punjab, Rajasthan, Uttarakhand, Uttarpradesh, Chhattisgarh and West Bengal.It is the first Indian cement manufacturer to build a captive port with three terminals along the country'swestern coastline and has its own fleet of ships. The <strong>com</strong>pany has a port at Muldwarka, Gujarat and BulkCement terminals at Surat, Gujarat, Panvel, Maharashtra, Kochi and Kerala. <strong>Ambuja</strong> is one of the majorexporters of cement in India. The <strong>com</strong>pany largely exports to the Middle East.Exhibit 15: Total Cement CapacityPlantsMTPAGujarat 5.50Himachal Pradesh 5.20Maharashtra 2.70Rabriyawas Rajasthan 1.80WB 2.25Punjab 3.10Chhatisgarh 4.30UP 1.50Uttarakhand 1.00Total installed capacity 27.35Source: Company, Networth ResearchInitiating Coverage10
Financial SummaryIn<strong>com</strong>e Statement(`Cr)Y/E March CY10 CY11 CY12E CY13ENet Revenues 7390.2 8531.2 9861.0 11389.4Growth % 4.4 15.4 15.6 15.5COGS 2228.0 2644.0 2881.8 3531.6Gross Profit 5162.2 5887.3 6979.2 7857.8Growth % 10.8 14.0 18.5 12.6SG&A Expenses 3339.2 3980.9 4530.1 5036.5Core EBITDA 1823.0 1906.4 2449.1 2821.3Growth % -2.3 4.6 28.5 15.2Other In<strong>com</strong>e 247.6 318.7 219.4 281.5EBITDA 2070.6 2225.1 2668.5 3102.8Depreciation 387.2 446.2 507.4 553.7EBIT 1683.4 1779.0 2161.1 2549.1Growth % -7.7 5.7 21.5 18.0Interest Exp 48.7 53.5 7.0 6.8EBT 1634.7 1725.5 2154.2 2542.3Tax 398.3 473.8 710.9 839.0PAT 1263.0 1227.2 1443.3 1703.4Growth % 3.8 -2.8 17.6 18.0Cash Flow Statement(`Cr)Y/E March CY10 CY11 CY12E CY13EPAT 1263.0 1227.7 1443.3 1703.4Depreciation 387.2 446.2 507.4 553.7Changes in WC 364.9 -63.7 35.3 58.8Cashflow from Operations 2015.1 1610.2 1985.9 2315.9Capital Expenditure -791.2 -728.8 -399.3 -900.0Investments 101.3 -184.9 0.0 0.0Misc items 2.25 -0.51 0.70 0.00DTA 0.00 -0.70 0.70 0.00Cashflow from Investments -687.6 -914.3 -398.6 -900.0Cash Flow from Financing -459.9 -369.0 -379.8 -445.3Net Change in Cash 867.5 327.0 1207.6 970.6Balance Sheet(`Cr)Y/E March CY10 CY11 CY12E CY13ECash and Equi. 1748.4 2075.4 3282.9 4253.5Receivables 128.2 247.8 217.3 250.9Inventories 901.9 927.8 914.8 1029.8Loans and Advances 340.3 563.6 603.0 696.5Other Assets 17.0 25.4 24.7 24.7Investments 621.1 806.0 806.0 806.0Fixed Assets 6562.7 6845.3 6737.2 7083.5Application of Funds 10319.6 11491.2 12586.0 14145.0Accounts Payable 1109.2 1356.5 1387.9 1688.8Other Liabilities 191.3 246.6 246.6 246.6Provisions 1096.6 1106.9 1106.9 1106.9Deferred Tax Liabilities 530.9 644.5 644.5 644.5Loan Funds 65.0 69.6 69.6 69.6Minority Interest & others 1.43 34.58 32.12 32.12Reserves and Surplus 7019.2 7725.7 8791.6 10049.7Equity Capital 306.0 306.9 306.9 306.9Sources of Funds 10319.6 11491.2 12586.0 14145.0Financial RatiosY/E March CY10 CY11 CY12E CY13EProfitabilityCore EBITDA margins 24.7 22.3 24.8 24.8Net Profit Margins 17.1 14.4 14.6 15.0ReturnROE 17.2 15.3 15.9 16.4ROCE 21.2 20.3 22.0 23.0Liquidity and GearingCash Conversion Cycle -30.8 -37.0 -48.1 -51.0Current Ratio 1.3 1.4 1.8 2.1Debt/Equity 0.0 0.0 0.0 0.0Per ShareEPS 8.3 8.0 9.4 11.1Operating CashflowPS 13.2 10.5 12.9 15.1BVPS 47.9 52.4 59.3 67.5ValuationPrice/Earning 17.6 18.1 15.4 13.1Price/BV 3.0 2.8 2.4 2.1EV/EBIDTA 10.9 10.2 7.4 6.1EV/Ton $ 177 150 133 131Initiating Coverage11
Networth Research: E-mail- research@networthdirect.<strong>com</strong>E-mail: research@networthdirect.<strong>com</strong>Tel: 022 3064 1600Institution SalesE-mail: dealing@networthdirect.<strong>com</strong>Tel: 022 3064 1600Key to NETWORTH Investment RankingsBuy: Upside by>15, Accumulate: Upside by +5 to 15, Hold: Upside/Downside by -5 to +5, Reduce: Downside by 5 to 15, Sell: Downside by>15Disclaimer: This document has been prepared by Networth Stock Broking <strong>Ltd</strong>. (NSBL). NSBL is a full service, integrated investment banking, portfolio managementand brokerage group. Our research analysts and sales persons provide important input into our investment banking activities. This document does not constitutean offer or solicitation for the purchase or sale of any financial instrument or as an official confirmation of any transaction. The information contained herein isfrom publicly available data or other sources believed to be reliable, but we do not represent that it is accurate or <strong>com</strong>plete and it should not be relied on as such.NSBL or any of its affiliates shall not be in any way responsible for any loss or damage that may arise to any person from any inadvertent error in the informationcontained in this report. This document is provided for assistance only and is not intended to be and must not alone be taken as the basis for an investmentdecision. The user assumes the entire risk of any use made of this information. Each recipient of this document should make such investigation as it deemsnecessary to arrive at an independent evaluation of an investment in the securities of <strong>com</strong>panies referred to in this document (including the merits and risksinvolved), and should consult his own advisors to determine the merits and risks of such investment. The investment discussed or views expressed may not besuitable for all investors We and our affiliates, officers, directors, and employees may: (a) from time to time, have long or short positions in, and buy or sell thesecurities thereof, of <strong>com</strong>pany (ies) mentioned herein or (b) be engaged in any other transaction involving such securities and earn brokerage or other<strong>com</strong>pensation or act as advisor or lender / borrower to such <strong>com</strong>pany (ies) or have other potential conflict of interest with respect to any re<strong>com</strong>mendation andrelated information and opinions. This information is strictly confidential and is being furnished to you solely for your information. This information should not bereproduced or redistributed or passed on directly or indirectly in any form to any other person or published, copied, in whole or in part, for any purpose. Thisreport is not directed or intended for distribution to, or use by, any person or entity who is a citizen or resident of or located in any locality, state, country or otherjurisdiction, where such distribution, publication, availability or use would be contrary to law, regulation or which would subject NSBL and affiliates to anyregistration or licensing requirements within such jurisdiction. The distribution of this document in certain jurisdictions may be restricted by law, and persons inwhose possession this document <strong>com</strong>es, should inform themselves about and observe, any such restrictions. The information given in this document is as of thedate of this report and there can be no assurance that future results or events will be consistent with this information. This information is subject to changewithout any prior notice. NSBL reserves the right to make modifications and alterations to this statement as may be required from time to time. However, NSBL isunder no obligation to update or keep the information current. Nevertheless, NSBL is <strong>com</strong>mitted to providing independent and transparent re<strong>com</strong>mendation to itsclient and would be happy to provide any information in response to specific client queries. Neither NSBL nor any of its affiliates, directors, employees, agents orrepresentatives shall be liable for any damages whether direct, indirect, special or consequential including lost revenue or lost profits that may arise from or inconnection with the use of the information. The analyst for this report certifies that all of the views expressed in this report accurately reflect his or her personalviews about the subject <strong>com</strong>pany or <strong>com</strong>panies and its or their securities, and no part of his or her <strong>com</strong>pensation was, is or will be, directly or indirectly related tospecific re<strong>com</strong>mendations or views expressed in this report. Analyst holding in stock: no.Networth Stock Broking <strong>Ltd</strong>. (www.networthdirect.<strong>com</strong>)Office: - 10th Floor, Atlanta Centre, Sonawala Lane, Opp. Udyog Bhavan, Goregaon (E), Mumbai 400 063. Tel No.: 022 30641600Initiating Coverage12