Company Update Dr. Reddy's Lab - Myiris.com - Personal finance ...
Company Update Dr. Reddy's Lab - Myiris.com - Personal finance ...
Company Update Dr. Reddy's Lab - Myiris.com - Personal finance ...

You also want an ePaper? Increase the reach of your titles
YUMPU automatically turns print PDFs into web optimized ePapers that Google loves.
where great minds meet<br />
PHARMA<br />
CONFLUENCE<br />
Date : 18th Nov. 2011<br />
RESEARCH<br />
ANALYSTS<br />
Deepak Malik<br />
Senior Research Analyst<br />
Deepak.Malik@emkayglobal.<strong>com</strong><br />
022 66121257<br />
Ashish Thavkar<br />
Research Associate<br />
Ashish.Thavkar@emkayglobal.<strong>com</strong><br />
022 66121254<br />
Bhavita Nagrani<br />
Research Associate<br />
bhavita.nagrani@emkayglobal.<strong>com</strong><br />
022 66242486
Contents<br />
Confluence: Pharma; Pre-conference note<br />
Ajanta Pharma 3<br />
Biocon 9<br />
<strong>Dr</strong>. Reddy’s <strong>Lab</strong> 13<br />
Elder Pharma 19<br />
Glenmark Pharma 23<br />
Ipca <strong>Lab</strong>s 29<br />
Jubilant Life Sciences 35<br />
Sun Pharma 41<br />
Vivimed <strong>Lab</strong>s 49<br />
Emkay Research 16 November 2011 2
November 16, 2011<br />
Reco<br />
Not Rated<br />
CMP<br />
Rs322<br />
Target Price<br />
NA<br />
EPS change FY11E/12E (%) NA<br />
Target Price change (%) NA<br />
Nifty 5,030<br />
Sensex 16,756<br />
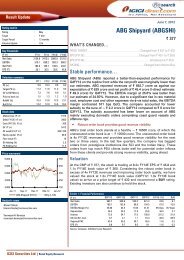
Price Performance<br />
(%) 1M 3M 6M 12M<br />
Absolute 1 1 12 32<br />
Rel. to Nifty 3 1 22 57<br />
Source: Bloomberg<br />
Relative Price Chart<br />
375<br />
330<br />
285<br />
240<br />
195<br />
Rs<br />
150<br />
Nov-10 Jan-11 Mar-11 May-11 Jul-11 Sep-11<br />
Source: Bloomberg<br />
Ajanta Pharma (LHS) Rel to Nifty (RHS)<br />
Stock Details<br />
Sector Pharmaceuticals<br />
Bloomberg AJP@IN<br />
Equity Capital (Rs mn) 117<br />
Face Value(Rs) 10<br />
No of shares o/s (mn) 12<br />
52 Week H/L 369/171<br />
Market Cap (Rs bn/USD mn) 4/79<br />
Daily Avg Volume (No of sh) 29620<br />
Daily Avg Turnover (US$mn) 0.2<br />
Shareholding Pattern (%)<br />
%<br />
80<br />
60<br />
40<br />
20<br />
0<br />
-20<br />
Sep-11 Jun-10 Mar-10<br />
Promoters 66.8 66.8 66.8<br />
FII/NRI 0.3 0.5 1.0<br />
Institutions 0.0 0.0 0.0<br />
Private Corp 6.1 6.3 5.7<br />
Public 26.8 26.4 26.4<br />
Source: Capitaline<br />
Deepak Malik<br />
Deepak.malik@emkayglobal.<strong>com</strong><br />
+91 22 6612 1257<br />
Ashish Thavkar<br />
ashish.thavkar@emkayglobal.<strong>com</strong><br />
+91 22 6612 1254<br />
Bhavita Nagrani<br />
bhavita.nagrani@emkayglobal.<strong>com</strong><br />
+91 22 6624 2486<br />
Ajanta Pharma<br />
Pure Branded Play – Ideal candidate for re-rating<br />
� Focus on branded generics in the domestic and the exports<br />
emerging market. Gearing for entry into the regulated market<br />
of US<br />
� Higher thrust on domestic business by launching 10-12 new<br />
products & 10-15 line extensions per year to fuel 16-18%<br />
growth in domestic business over the next 2-3 years<br />
� RoE of 24.5x, RoIC of 19.4x, asset turnover of 1.2x and working<br />
capital position of 171 days provide <strong>com</strong>fort to investors<br />
� With pure branded profile, 15-18% sales CAGR going forward<br />
and entry into regulated market through capacity expansion<br />
makes it an ideal candidate for re-rating<br />
Domestic business – On a steady growth track<br />
In the Indian market Ajanta ranks 63 rd with sales growing at 27% CAGR over FY06-11<br />
on back of strong foothold in Opthalmology (FY06-11 sales CAGR - 35%), Dermatology<br />
(FY06-11 sales CAGR - 57%) and Cardiology (FY06-11 sales CAGR - 34%).<br />
� In the Opthal segment, the <strong>com</strong>pany has 30 brands with 9 of them in the top 5<br />
rankings. In the Derma segment, the <strong>com</strong>pany has 24 brands & 5 brands stand in<br />
top 4 rankings. In the Cardio segment, the <strong>com</strong>pany 8 brands with 3 in top 10.<br />
� 70-75% of the domestic sales are through prescriptions and the rest are tender<br />
based sales. The <strong>com</strong>pany has reduced its exposure to tender based sales (5% in<br />
FY11 vis-à-vis 23% in FY07) as a result of which EBITDA margins have expanded<br />
by 386bps to 19.1% over the same period.<br />
� With a total field force of over 2400 MRs, the management has guided for 16-18%<br />
CAGR growth from this geography over FY11-13E, driven by 10-12 new product<br />
launches, line extensions and therapy expansions.<br />
Exports – Focus on Asia/ Africa and capacity expansion to drive growth<br />
� During FY11, exports business contributed 63% of the total sales with Asia/ Africa<br />
collectively contributing 95% to the export revenues and remaining from the LatAM.<br />
� In African markets, the <strong>com</strong>pany derives 50:50 revenues from Anglo and French<br />
African markets. Going ahead, we expect margins in exports segment to expand as<br />
the <strong>com</strong>pany has deliberately reduced its focus on tender business in Afirca (16%<br />
contri to exports in FY11) and has not bidden for any of the WHO tenders.<br />
� The <strong>com</strong>pany has planned a capex of Rs1-1.25bn over FY13-14E in order to target<br />
the regulated market of US. Majority of the capex will be towards setting-up of<br />
manufacturing unit. The <strong>com</strong>pany anticipates 10-12 ANDA filings going ahead,<br />
which is evident from increased R&D spend of 4.5%. The <strong>com</strong>pany has 2 ANDAs<br />
approved and has filed for 3 more approvals.<br />
Valuations<br />
At CMP, Ajanta trades at 7.2x FY11E EPS and 5.7x FY11 EV/EBITDA. During FY07-11,<br />
sales have grown at a CAGR of 18%, EBITDA at 25% and PAT at 36% with EBITDA<br />
and PAT margin expanding by 368bps and 436bps to 19% and 10%, respectively.<br />
Although we do not have a formal rating on the stock, we are positively biased.<br />
Financials Rs mn<br />
YE- Net EBITDA EPS EPS RoE EV/<br />
Mar Sales (Core) (%) APAT (Rs) % chg (%) P/E EBITDA P/BV<br />
FY08 3,092 514 16.6 225 18.9 53.6 18.0 16.9 10.7 2.8<br />
FY09 3,492 651 18.6 254 21.4 13.1 17.4 15.0 9.6 2.4<br />
FY10 4,091 786 19.2 340 28.8 34.4 19.9 11.1 7.6 2.1<br />
FY11 5,049 963 19.1 507 43.0 49.2 24.5 7.5 5.8 1.7<br />
Emkay Global Financial Services Ltd 3<br />
<strong>Company</strong> <strong>Update</strong>
Key Financials – Quarterly<br />
Ajanta Pharma Confluence: Pharma; Pre-conference note<br />
<strong>Company</strong> Description<br />
Ajanta Pharma is a specialty pharma formulation <strong>com</strong>pany, having leading brands in the<br />
therapeutic segments of Ophthalmology, Dermatology and Cardiology. Many of the<br />
<strong>com</strong>pany's products are leading in their sub therapeutic segments. Ajanta Pharma’s<br />
business model is undergoing <strong>com</strong>plete business transformation from being an emerging<br />
market focused <strong>com</strong>pany to gearing up for entry into regulated market and defocusing on<br />
tender based business.<br />
The <strong>com</strong>pany has its R&D facility located at Kandivali Mumbai, with more than 200<br />
scientists working for formulation development and has four manufacturing facilities -<br />
located in India and one in Mauritius. The Aurangabad facility is approved by USFDA,<br />
UKMHRA and World health organisation (WHO).<br />
Rs mn Q2FY11 Q3FY11 Q4FY11 Q1FY12 Q2FY12 YoY (%) QoQ (%)<br />
Revenue 1,125 1,205 1,258 1,273 1,351 20.1 6.1<br />
Expenditure 916 977 979 1,060 1,119 22.2 5.5<br />
as % of sales 81.4 81.1 77.8 83.3 82.8<br />
Consumption of RM 411 544 454 418 430 4.5 2.9<br />
as % of sales 36.6 45.2 36.0 32.8 31.8<br />
Employee Cost 138 148 171 181 179 29.2 (1.3)<br />
as % of sales 12.3 12.2 13.6 14.2 13.2<br />
Other expenditure 366 285 354 462 511 39.4 10.6<br />
as % of sales 32.6 23.7 28.1 36.3 37.8<br />
Forex loss/gain 20 60<br />
EBITDA 209 228 280 213 232 11.0 9.1<br />
Adj. EBITDA 229 228 280 213 292 27.5 -<br />
Depreciation 59 62 65 66 76 29.3 14.8<br />
EBIT 150 166 214 146 156 3.8 6.5<br />
Other In<strong>com</strong>e 4 7 4 18 2 (32.9) (86.4)<br />
Interest 44 35 35 28 34 (22.5)<br />
PBT 110 138 183 136 125 13.0 (8.1)<br />
Total Tax 10 18 9 10 6 (37.4) (40.8)<br />
Reported PAT 101 119 175 125 119 17.9 (5.4)<br />
(Profit)/loss from JV's/Ass/MI 0 0 0 0 0<br />
APAT after MI 101 119 175 125 119 17.9 (5.4)<br />
Extra ordinary items 0 0 0 0 0<br />
Reported PAT 101 119 175 125 119 17.9 (5.4)<br />
Adj. PAT 119 119 175 125 176 47.9 40.1<br />
AEPS 10.1 10.1 14.8 10.6 14.9 47.9 40.1<br />
Margins (%) (bps) (bps)<br />
EBIDTA 18.6 18.9 22.2 16.7 17.2 -141 47<br />
Adj. EBITDA 20.4 18.9 22.2 16.7 21.6 125 491<br />
EBIT 13.3 13.7 17.0 11.5 11.5 -181 4<br />
EBT 9.8 11.4 14.6 10.7 9.2 -58 -143<br />
PAT 8.9 9.9 13.9 9.8 8.8 -16 -107<br />
Adj. PAT 10.6 9.9 13.9 9.8 13.0 244 315<br />
Effective Tax rate 8.8 13.4 4.8 7.6 4.9 (394) (270)<br />
Emkay Research 16 November 2011 4
Detailed Revenue Break-Up<br />
Ajanta Pharma Confluence: Pharma; Pre-conference note<br />
Rs mn FY07 FY08 YoY % FY09 YoY % FY10 YoY % FY11 YoY %<br />
Domestic 1234 1473 19.4 1377 -6.5 1510 9.7 1749 15.8<br />
% to Sales 46.3 46.6 39.1 36.8 34.3<br />
Branded 630 840 33.3 1030 22.6 1150 11.7 1480 28.7<br />
% to Sales 23.6 26.6 29.2 28.0 29.0<br />
Ophthalmology 160 220 37.5 260 18.2 340 30.8 408 20.0<br />
% to Sales 6.0 7.0 7.4 8.3 8.0<br />
Dermatology 120 180 50.0 250 38.9 310 24.0 470 51.6<br />
% to Sales 4.5 5.7 7.1 7.5 9.2<br />
Cardiology 170 240 41.2 300 25.0 350 16.7 390 11.4<br />
% to Sales 6.4 7.6 8.5 8.5 7.6<br />
Others 180 200 11.1 220 10.0 150 -31.8 212 41.3<br />
% to Sales 6.8 6.3 6.2 3.7 4.2<br />
Tender Sales 604 633 4.8 347 -45.2 360 3.7 269 -25.3<br />
% to Sales 22.7 20.0 9.8 8.8 5.3<br />
Exports 1431 1686 17.8 2147 27.3 2598 21.0 3350 28.9<br />
% to Sales 53.7 53.4 60.9 63.2 65.7<br />
Mauritius subsidiary 193 242 25.4 299 23.6 258 -13.7 478 85.3<br />
% to Sales 7.2 7.7 8.5 6.3 9.4<br />
Other EM’s 1238 1444 16.6 1848 28.0 2340 26.6 2872 22.7<br />
% to Sales 46.5 45.7 52.4 57.0 56.3<br />
Gross Sales 2665 3159 18.5 3524 11.6 4108 16.6 5099 24.1<br />
Emkay Research 16 November 2011 5
Financials<br />
Ajanta Pharma Confluence: Pharma; Pre-conference note<br />
In<strong>com</strong>e Statement (Rs. mn) Balance Sheet (Rs. mn)<br />
(Year Ending Mar 31) FY08 FY09 FY10 FY11 (Year Ending Mar 31) FY08 FY09 FY10 FY11<br />
Net Sales 3,092 3,492 4,091 5,049 Share Capital 118 118 118 118<br />
Growth (%) 20 13 17 23 Reserves & Surplus 1,231 1,453 1,731 2,170<br />
Other In<strong>com</strong>e 15 25 11 28 Networth 1,349 1,571 1,849 2,288<br />
Total In<strong>com</strong>e 3,107 3,517 4,102 5,077 Minority Interest 3 0 0 0<br />
Expenditure 2,578 2,841 3,306 4,086 Secured Loans 1,414 2,109 2,062 1,593<br />
Raw Materials 1,402 1,271 1,398 1,729 Unsecured Loans 322 394 218 314<br />
Employee Cost 305 427 478 637 Loan funds 1,735 2,502 2,280 1,906<br />
Other Expenses 165 194 304 266 Net Deferred Tax -29 6 53 109<br />
Selling and Admin Expenses 707 950 1,126 1,454 Total Liabilities 3,058 4,079 4,182 4,304<br />
Operating Profit 514 651 786 963<br />
EBITDA Margin (%) 16.6 18.6 19.2 19.1 Gross Block 1,416 1,925 2,426 3,132<br />
Depreciation 79 142 207 247 Less: Acc. Depreciation 398 542 741 991<br />
EBIT 435 509 578 716 Net Block 1,018 1,383 1,685 2,140<br />
EBIT margin (%) 14.1 14.6 14.1 14.2 Capital Work in Progress 239 552 470 172<br />
Interest 161 236 202 178 Investments 85 85 85 85<br />
Profit Before Tax 289 298 388 566 Current Assets 2,228 2,573 2,712 2,825<br />
Tax 0 0 1 2 Inventories 928 1,039 1,196 1,131<br />
Fringe Benefit Tax 8 9 0 0 Sundry Debtors 868 1,001 967 1,040<br />
Deferred Tax 60 35 47 57 Cash and Bank 58 81 148 148<br />
Net Profit 220 254 340 507 Loans and Advances 375 452 400 506<br />
Minority Interest (after tax) 2 0 0 0 Current Liab and Prov 512 513 769 918<br />
Profit after Min. Int. 219 254 340 507 Current Liabilities 426 455 693 809<br />
Extraordinary Items -6 0 0 0 Provisions 86 57 76 109<br />
Adjusted Net Profit 225 254 340 507 Net Current Assets 1,716 2,060 1,942 1,907<br />
Net margin (%) 7.3 7.3 8.3 10.0 Total Assets 3,058 4,079 4,182 4,304<br />
Cash Flow (Rs. mn) Key Ratios<br />
(Year Ending Mar 31) FY08 FY09 FY10 FY11 (Year Ending Mar 31) FY08 FY09 FY10 FY11<br />
Opening Cash 75 58 81 148 Profitability (%)<br />
Net Cash from Operations 191 346 951 1,006 EBITDA Margin 16.6 18.6 19.2 19.1<br />
Net Cash Used in Investing -591 -819 -427 -405 Net Margin 7.3 7.3 8.3 10.0<br />
Net Cash Used in Financing 384 497 -457 -601 ROCE 16.4 14.3 14.0 16.9<br />
Net Inc/(Dec) in Cash -17 23 68 -1 ROE 18.0 17.4 19.9 24.5<br />
Closing Cash 58 81 148 148 ROIC 18.8 16.8 16.9 19.4<br />
Per Share Data (Rs)<br />
EPS 18.9 21.4 28.8 43.0<br />
CEPS 25.6 33.4 46.1 63.6<br />
BVPS 113.7 132.5 155.9 192.9<br />
DPS 2.5 2.5 3.4 4.9<br />
Valuations (x)<br />
PER 16.4 14.5 10.8 7.2<br />
P/CEPS 12.2 9.3 6.7 4.9<br />
P/BV 2.7 2.3 2.0 1.6<br />
EV / Sales 1.7 1.7 1.4 1.1<br />
EV / EBITDA 10.5 9.4 7.4 5.7<br />
Dividend Yield (%) 0.8 0.8 1.1 1.6<br />
Gearing Ratio (x)<br />
Net Debt/ Equity 1.2 1.5 1.2 0.8<br />
Net Debt/EBIDTA 3.3 3.7 2.7 1.8<br />
Source: Capitaline<br />
Emkay Research 16 November 2011 6
Notes<br />
Ajanta Pharma Confluence: Pharma; Pre-conference note<br />
Emkay Research 16 November 2011 7
Notes<br />
Ajanta Pharma Confluence: Pharma; Pre-conference note<br />
Emkay Research 16 November 2011 8
November 17, 2011<br />
Reco<br />
Not Rated<br />
CMP<br />
Rs332<br />
Target Price<br />
NA<br />
EPS change FY11E/12E (%) NA<br />
Target Price change (%) NA<br />
Nifty<br />
5,030<br />
Sensex<br />
16,756<br />
Price Performance<br />
(%) 1M 3M 6M 12M<br />
Absolute (8) (2) (11) (20)<br />
Rel. to Nifty (6) (2) (3) (5)<br />
Source: Bloomberg<br />
Relative Price Chart<br />
450<br />
420<br />
390<br />
360<br />
330<br />
Rs<br />
300<br />
Nov-10 Jan-11 Mar-11 May-11 Jul-11 Sep-11<br />
Source: Bloomberg<br />
Biocon (LHS) Rel to Nifty (RHS)<br />
Stock Details<br />
Sector Pharmaceuticals<br />
Bloomberg BIOS@IN<br />
Equity Capital (Rs mn) 1000<br />
Face Value(Rs) 5<br />
No of shares o/s (mn) 200<br />
52 Week H/L 430/301<br />
Market Cap (Rs bn/USD mn)<br />
%<br />
10<br />
4<br />
-2<br />
-8<br />
-14<br />
-20<br />
66/1389<br />
Daily Avg Volume (No of sh) 242685<br />
Daily Avg Turnover (US$mn) 1.7<br />
Shareholding Pattern (%)<br />
Sep-11 Jun-11 Mar-11<br />
Promoters 60.9 60.9 60.9<br />
FII/NRI 6.9 6.2 5.5<br />
Institutions 11.1 11.3 10.9<br />
Private Corp 3.7 4.0 5.2<br />
Public 17.5 17.7 17.6<br />
Source: Capitaline<br />
Deepak Malik<br />
Deepak.malik@emkayglobal.<strong>com</strong><br />
+91 22 6612 1257<br />
Ashish Thavkar<br />
ashish.thavkar@emkayglobal.<strong>com</strong><br />
+91 22 6612 1254<br />
Bhavita Nagrani<br />
bhavita.nagrani@emkayglobal.<strong>com</strong><br />
+91 22 6624 2486<br />
Biocon<br />
Multiple growth drivers<br />
� Ramp in supply of Fidaxomicin API to US partner Optimer and<br />
insulin to Pfizer would strengthen Biocon's revenues as well<br />
as profitability in H2FY12<br />
� Biocon has begun work on the Malaysian plant (expected to<br />
start operations by 2014) that will serve its deal with Pfizer.<br />
Investment of US$161mn is lined-up for Phase I construction<br />
� Biocon is looking to out license IN105, Anti CD6 and BVX20.<br />
Phase I study for BVX20 is expected to start in Q1’13 &<br />
phase III study for Psoriasis is expected to <strong>com</strong>plete in Q4’12<br />
� Listing of Syngene remains a long term opportunity for value<br />
unlocking<br />
Near term growth drivers<br />
� Fidaxomicin supply to Optimer (exclusive supply contract) have already started in<br />
June for US market<br />
� Pfizer has launched insulin and Glargine in the Indian market from Biocon’s portfolio<br />
under its own brand names - Univia and Glarvia<br />
� <strong>Company</strong> is in talks to supply atorvastatin API to one of its partner post 180-days<br />
exclusivity in the US market<br />
� Syngene has changed its business model from low risk fee based model which is<br />
very volatile to sharing risk-reward model. We believe, on research front Syngene will<br />
show better performance going forward and Clingene will take some time to<br />
turnaround<br />
Long term growth drivers<br />
� Bicon’s deal with Myaln for emerging markets, US & Europe for supplying biosimilars<br />
� Biocon is in talks to out license IN105, Anti CD6 and BVX20. Phase I study for<br />
BVX20 is expected to start in Q1FY13. Currently ongoing phase III study in Psoriasis<br />
is expected to be <strong>com</strong>pleted in Q4FY12 with the results likely to be available in the<br />
first quarter of next year<br />
� Syngene listing has been delayed by almost a year, but these value unlocking<br />
opportunities would remain a trigger in future<br />
Valuations<br />
At current price, the stock trades at 19x FY11 EPS of Rs18 and 12X FY11 EV/EBITDA.<br />
Financials Rs mn<br />
YE- Net EBITDA EPS EPS RoE EV/<br />
Mar Sales (Core) (%) APAT (Rs) % chg (%) P/E EBITDA P/BV<br />
FY08 10,542 2501.9 24.6 2,031 22.8 1.4 15.9 14.6 26.6 4.5<br />
FY09 16,087 2592.1 6.9 2,379 4.2 -81.8 15.9 80.0 64.0 4.4<br />
FY10 23,678 1117.4 18.3 2,969 14.3 244.3 18.2 23.2 16.1 3.8<br />
FY11 27,707 4344.2 20.2 3,681 17.9 25.2 19.4 18.6 11.7 3.3<br />
Emkay Global Financial Services Ltd 9<br />
<strong>Company</strong> <strong>Update</strong>
Key Financials – Quarterly<br />
Biocon Confluence: Pharma; Pre-conference note<br />
<strong>Company</strong> Description<br />
From being a predominantly fermentation based APIs and enzymes manufacturer, the<br />
<strong>com</strong>pany has emerged as a R&D based biotechnology <strong>com</strong>pany having developed its own<br />
proprietary products as well as offering contract research services to global pharmaceutical<br />
majors. Biocon is the India’s largest biotechnology <strong>com</strong>pany with a presence in<br />
biopharmaceuticals, custom research (Syngene) and clinical research (Clinigene). Biocon<br />
sold its enzymes business to Novozymes, Denmark –the world’s leading industrial enzyme<br />
producer for $102m in July’07.<br />
The <strong>com</strong>pany’s product offering includes the world’s first re<strong>com</strong>binant human insulin<br />
Insugen. It is the leading player in statins and exports over 80% of its production,<br />
<strong>com</strong>mands over 20% global market share and derives over 30% of its revenues from this<br />
business. Biocon caters to regulated markets like US and Europe and is one of the largest<br />
exporters of Lovastatin to the US. The <strong>com</strong>pany manufactures all four statins namely:<br />
Lovastatin, Simvastatin, Pravastatin and Atorvastatin by fermentation process, which<br />
requires high technological skills.<br />
Rs mn 2QFY11 3QFY11 4QFY11 1QFY12 2QFY12 YoY Gr. QoQ Gr.<br />
Revenues 4204 7281 7016 4417 5084 21.0 15.1<br />
Other Operating In<strong>com</strong>e 11.8 17.2 16 17.9 49.9 322.9 178.8<br />
Other In<strong>com</strong>e 135 79 133 105 110 (18.6) 4.0<br />
Total In<strong>com</strong>e 4350 7377 7165 4540 5244 20.5 15.5<br />
Total Expenditure 2907 5597 5581 3213 3750 29.0 16.7<br />
Consumption of RM 1692 3632 3932 1891 2142 26.6 13.3<br />
as % of sales 40.2 49.9 56.0 42.8 42.1 - -<br />
Employee Cost 581 811 820 693 778 33.9 12.4<br />
as % of sales 13.8 11.1 11.7 15.7 15.3 - -<br />
Other expenditure 634 1154 830 630 830 30.9 31.8<br />
as % of sales 15.1 15.9 11.8 14.3 16.3 - -<br />
EBITDA 1443 1780 1584 1327 1494 3.5 12.6<br />
Interest 62 66 57 57 20 (67.4) (64.4)<br />
EBDT 1382 1714 1527 1270 1474 6.7 16.1<br />
Depreciation 379 406 396 451 429 13.3 (4.8)<br />
Minority Interest 0 0 0 0 0 - -<br />
PBT 1003 1308 1131 820 1045 4.2 27.5<br />
Tax 111 291 111 119 188 69.9 57.7<br />
Reported Profit before EOI 892 1017 1021 701 857 (3.9) 22.3<br />
EOI 0 10 13 0 0 - -<br />
Reported Profit 892 1008 1008 701 857 (3.9) 22.3<br />
EPS 4.57 5.15 5.16 3.58 4.38 (4.2) 22.3<br />
Margins (%) (bps) (bps)<br />
EBIDTA 34.3 24.4 22.6 30.0 29.4 -494 -65<br />
EBIT 25.3 18.9 16.9 19.8 21.0 -437 111<br />
EBT 21.0 14.0 15.0 16.0 17.0 -400 100<br />
PAT 21.2 13.8 14.4 15.9 16.9 -437 100<br />
Effective Tax rate 11.0 22.2 9.8 14.6 18.0 696 345<br />
Emkay Research 17 November 2011 10
Financials<br />
In<strong>com</strong>e Statement Balance Sheet<br />
Biocon Confluence: Pharma; Pre-conference note<br />
(Year Ending Mar 31) FY08 FY09 FY10 FY11 (Year Ending Mar 31) FY08 FY09 FY10 FY11<br />
Net Sales 10,542 16,087 23,678 27,707 Share Capital 500 1,000 1,000 1,000<br />
Growth (%) 7% 53% 47% 17% Reserves & Surplus 14,342 14,107 16,579 19,328<br />
Other In<strong>com</strong>e 3,836 1,213 741 702 Networth 14,842 15,107 17,579 20,328<br />
Total In<strong>com</strong>e 14,378 17,299 24,419 28,409 Minority Interest -73 248 338 377<br />
Expenditure 7,950 14,969 19,334 22,112 Secured Loans 1,350 3,957 3,315 2,039<br />
Raw Materials 5,265 9,625 14,424 16,328 Unsecured Loans 1,200 1,282 1,821 1,304<br />
% to Sales 49.9% 59.8% 60.9% 58.9% Loan funds 2,551 5,239 5,136 3,342<br />
Employee Cost 1,127 1,811 2,450 3,123 Net Deferred Tax 465 466 508 497<br />
% to Sales 10.7% 11.3% 10.3% 11.3% Total Liabilities 17,784 21,060 23,561 24,544<br />
Other Expenses 321 395 643 784<br />
% to Sales 3.0% 2.5% 2.7% 2.8% Gross Block 11,849 15,817 18,371 20,630<br />
Selling and Admin Expenses 1,238 3,139 1,817 1,877 Less: Acc Depreciation 2,536 3,701 4,992 6,519<br />
% to Sales 11.7% 19.5% 7.7% 6.8% Net Block 9,313 12,116 13,379 14,111<br />
Operating Profit 2,592 1,117 4,344 5,595 Capital Work in Progress 1,382 1,720 755 1,796<br />
EBITDA Margin (%) 24.6 6.9 18.3 20.2 Investments 4,748 3,676 4,306 4,605<br />
Depreciation 939 1,103 1,401 1,568 Current Assets 5,346 7,924 10,921 15,030<br />
EBIT 1,653 15 2,943 4,027 Inventories 1,790 3,192 3,716 4,137<br />
EBIT margin (%) 15.7 0.1 12.4 14.5 Sundry Debtors 2,591 3,667 4,461 5,124<br />
Interest 102 177 169 257 Cash and Bank 96 118 1,399 4,414<br />
% to Debt 4.0% 3.4% 3.3% 7.7% Loans and Advances 869 947 1,344 1,355<br />
Profit Before Tax 5,387 1,051 3,515 4,472 Current Liab and Prov 3,005 4,376 5,800 10,997<br />
Tax 781 21 445 733 Current Liabilities 2,300 3,570 4,909 9,855<br />
Fringe Benefit Tax 15 19 0 0 Provisions 705 806 891 1,141<br />
Deferred Tax 17 1 42 -12 Net Current Assets 2,341 3,548 5,121 4,033<br />
Net Profit 4,574 1,010 3,028 3,751 Total Assets 17,784 21,060 23,561 24,544<br />
Minority Interest (after tax) -65 64 96 75<br />
Profit after Min. Int. 4,639 946 2,932 3,675<br />
Extraordinary Items 2,608 -1,434 -37 -6<br />
Adjusted Net Profit 2,031 2,379 2,969 3,681<br />
Net margin (%) 19.3 14.8 12.5 13.3<br />
Cash Flow (Rs. mn) Key Ratios<br />
(Year Ending Mar 31) FY08 FY09 FY10 FY11 (Year Ending Mar 31) FY08 FY09 FY10 FY11<br />
Opening Cash Position 86 96 118 1399 Profitability (%)<br />
Operating Cash Flow 3179 975 4438 8090 Net Margin 19.3 14.8 12.5 13.3<br />
Investing Cash Flow -3401 -2322 -2305 -2330 ROCE 10.7 0.1 13.2 16.7<br />
Financing Cash Flow 232 1369 -852 -2745 ROE 15.9 15.9 18.2 19.4<br />
Net Change in Cash 10 22 1281 3014 ROIC 14.4 0.1 18.0 26.1<br />
Closing Cash Position 96 118 1399 4414 Per Share Data (Rs)<br />
EPS 22.8 4.2 14.3 17.9<br />
CEPS 14.9 17.4 21.9 26.2<br />
BVPS 74.2 75.5 87.9 101.6<br />
DPS 2.5 3.0 3.5 4.5<br />
Valuations (x)<br />
PER 14.6 80.0 23.2 18.6<br />
P/CEPS 22.4 19.1 15.2 12.6<br />
P/BV 4.5 4.4 3.8 3.3<br />
EV / Sales 6.5 4.4 3.0 2.4<br />
EV / EBITDA 26.6 64.0 16.1 11.7<br />
Dividend Yield (%) 0.8 0.9 1.1 1.4<br />
Gearing Ratio (x)<br />
Net Debt/ Equity 0.2 0.3 0.2 -0.1<br />
Net Debt/EBIDTA 0.9 4.6 0.9 -0.2<br />
Source: Capitaline<br />
Emkay Research 17 November 2011 11
Notes<br />
Biocon Confluence: Pharma; Pre-conference note<br />
Emkay Research 17 November 2011 12
November 17, 2011<br />
Reco<br />
Hold<br />
CMP<br />
Rs1,617<br />
Previous Reco<br />
Hold<br />
Target Price<br />
Rs1,604<br />
EPS change FY11E/12E (%) NA<br />
Target Price change (%) NA<br />
Nifty<br />
5,069<br />
Sensex<br />
16,883<br />
Price Performance<br />
(%) 1M 3M 6M 12M<br />
Absolute 6 9 (1) (8)<br />
Rel. to Nifty 7 9 6 11<br />
Source: Bloomberg<br />
Relative Price Chart<br />
1850<br />
1760<br />
1670<br />
1580<br />
1490<br />
Rs<br />
1400<br />
Nov-10 Jan-11 Mar-11 May-11 Jul-11 Sep-11<br />
Source: Bloomberg<br />
<strong>Dr</strong>. <strong>Reddy's</strong> <strong>Lab</strong> (LHS) Rel to Nifty (RHS)<br />
Stock Details<br />
Sector Pharmaceuticals<br />
Bloomberg DRRD@IN<br />
Equity Capital (Rs mn) 847<br />
Face Value(Rs) 5<br />
No of shares o/s (mn) 169<br />
52 Week H/L 1,855/1,387<br />
Market Cap (Rs bn/USD mn)<br />
%<br />
10<br />
6<br />
2<br />
-2<br />
-6<br />
-10<br />
274/5,407<br />
Daily Avg Volume (No of sh) 327081<br />
Daily Avg Turnover (US$mn) 9.8<br />
Shareholding Pattern (%)<br />
Sep-11 Jun-11 Mar-11<br />
Promoters 25.6 25.6 25.7<br />
FII/NRI 45.6 45.4 46.3<br />
Institutions 14.4 14.7 14.0<br />
Private Corp 6.0 5.6 5.5<br />
Public 8.4 8.6 8.6<br />
Source: Capitaline<br />
Deepak Malik<br />
deepak.malik@emkayglobal.<strong>com</strong><br />
+91 22 6612 1257<br />
Ashish Thavkar<br />
ashish.thavkar@emkayglobal.<strong>com</strong><br />
+91 22 6612 1254<br />
Bhavita Nagrani<br />
bhavita.nagrani@emkayglobal.<strong>com</strong><br />
+91 22 6624 2486<br />
<strong>Dr</strong>. Reddy’s <strong>Lab</strong><br />
Attractive Para-IV pipeline<br />
� New launches, gain in market share in existing products &<br />
limited <strong>com</strong>petition opportunities to drive the growth in US<br />
� Upside from Para IV in FY12 and FY13 is Rs 19.2 and Rs 14.3<br />
respectively, mainly driven by launches like zyprexa,<br />
clopidogrel and ziprasidone<br />
� <strong>Dr</strong>. Reddy to witness modest growth of ~12% CAGR (FY11-<br />
FY13) in domestic market, due to issues in pain management<br />
and anti infective therapy<br />
� Upsides from Para-IVs largely factored-in. Maintain Hold<br />
rating with a price target of Rs1604<br />
Domestic business to witness gradual recovery and Russian Business to<br />
Show Strong Growth<br />
� DRL has been witnessing slower growth in the Indian market due to controversy<br />
related to one of its key brand in pain management i.e Nise. Though there has been<br />
favorable ruling by DCGI, but it will take some time to regain lost market share.<br />
However if we exclude, this impact than the domestic business grew at a healthy<br />
rate of ~15% <strong>com</strong>pared to industry rate of 12-14%<br />
� Russia & CIS which contributes 15%, to grow by 18% on back of significant volume<br />
growth in key brands and acquisition of JB Chemicals Rx Russian business<br />
Revenue growth to be led by US Business<br />
� North American business, to witness growth of ~19% CAGR (FY11- FY13) due to<br />
new product launches and increase in MS of existing products<br />
o Already launched 9 new products including 4 SKU’s from its Bristols penicillin<br />
facility acquired from GSK in Sept’11<br />
o Key Para – IV’s opportunities -<br />
– Olanzapine (20mg) – Market size of US$900 mn, launched on Oct 25 th ,<br />
2011, under 180-days unshared exclusivity<br />
– Olanzapine ODT – Market size of US$80mn, launch to be under 180-days<br />
exclusivity with 2 other players<br />
– Ziprasidone – Market Size US$800m, expected in Mar 12’ (Shared with<br />
two other <strong>com</strong>panies). But the launch can be delayed by 6months, if<br />
USFDA grants PED to innovator<br />
o Upsides may <strong>com</strong>e from the <strong>com</strong>pany’s Bristol facility in H2FY12<br />
Valuation<br />
We expect <strong>Dr</strong>. Reddy to report 17%% revenue growth in FY12E and 7% growth in<br />
FY13E. We expect EBIDTA margins to move from 22.4% in FY11 to 22.8% in FY12 and<br />
23.5%% in FY13. Earnings will grow by 12% CAGR over FY11-13E. We maintain our<br />
target price on the stock to Rs1604 (20x base business earnings of Rs77 + NPV of<br />
Rs64 from Para IVs) with a Hold rating. At CMP, the stock is trading at 20x FY12E and<br />
18x FY13E earnings.<br />
Financials Rs mn<br />
YE- Net EBITDA EPS EPS RoE EV/<br />
Mar Sales (Core) (%) APAT (Rs) % chg (%) P/E EBITDA P/BV<br />
FY10 70,310 15,762 22.4 8,435 50.0 101.9 9.6 32.4 17.8 7.2<br />
FY11 76,558 17,121 22.4 12,314 72.8 10.8 30.6 22.2 16.9 6.4<br />
FY12E 89,789 20,443 22.8 13,659 80.7 45.6 22.2 20.0 13.8 5.4<br />
FY13E 96,268 22,621 23.5 15,431 91.2 10.9 23.2 17.7 12.1 4.5<br />
Emkay Global Financial Services Ltd 13<br />
<strong>Company</strong> <strong>Update</strong>
Key Financials<br />
<strong>Dr</strong>. Reddy’s <strong>Lab</strong> Confluence: Pharma; Pre-conference note<br />
Rs mn Q1FY11 Q2FY11 Q4FY11 Q1FY12 Q2FY12 YoY % QoQ %<br />
Revenues 16831 18704 20173 19783 22679 21.3 14.6<br />
Raw Material 5035.2 5707 4059 5830 6804 19.2 16.7<br />
% to sales 29.9 30.5 20.1 29.5 30.0<br />
Manufacturing Cost 2882.3 3011 5165 3303 3669 - -<br />
% to sales 17.1 16.1 25.6 16.7 16.2<br />
Gross Profit 8914 9986 10949 10651 12206 22.2 14.6<br />
Operating Expenses<br />
SGA 4508.8 4661 5064 5483 5948 27.6 8.5<br />
% to base sales 26.8 24.9 25.1 27.7 26.2<br />
R&D cost 992.9 1270 1491 1197 1459 14.9 21.9<br />
% to base sales 5.9 6.8 7.4 6.0 6.4<br />
Total operating expenses 5501.7 5931 6555 6680 7407 24.9 10.9<br />
EBITDA 3412.1 4055 4394 3971 4799 18.3 20.8<br />
Depreciation 973 1048 1061 1233 1268 21.0 2.8<br />
Other exp/ (in<strong>com</strong>e) -186.4 -218 -512 -187 -390 78.9 108.6<br />
Finance exp/ (in<strong>com</strong>e) 9 -34.9 99 -221 -225 - -<br />
Share of profit/loss 4.7 -3 -4 4 -13 - -<br />
PBT 2639 3193 3742 2708 3709 16.1 36.9<br />
Tax -357.3 -326.5 -567 -119.4 -631.0 93.3 428.5<br />
Reported PAT 2096 2867 3346 2628 3078 7.4 17.1<br />
EPS 12.4 17.0 19.8 15.6 18.2 7.4 17.1<br />
Extraordinary<br />
VRS 0 0 0 136 -98 - -<br />
Forex gain/ (loss) -225 49 171 158 151 - -<br />
Interest on debentures 0 0 0 0 118<br />
Profit on sale on investment 39 0 0 17 0 - -<br />
PBT after EO 2453 3242 3913 2747 3729 15.0 35.7<br />
Adjusted PAT 2257 2872 3201 2591 2973 3.5 14.7<br />
Adjusted EPS 13.4 17.0 19.0 15.3 17.6 3.5 14.7<br />
bps bps<br />
EBITDA margins 20.3 21.7 21.8 20.1 21.2 -52 109<br />
PAT margins 12.5 15.3 16.6 13.3 13.6 -176 29<br />
Tax Rate 13.5 10.2 15.2 4.4 17.0 679 1260<br />
Revenue break-up<br />
(Rs mn) Q2FY11 Q3FY11 Q4FY11 Q1FY12 Q2FY12 YoY (%) QoQ (%)<br />
Global Generics 13,667 13,589 14,166 14,424 16,136 18.1 11.9<br />
NA 4416 4765 5918 5756 6287 42.4 9.2<br />
Europe 2366 2123 2005 1917 2117 -10.5 10.4<br />
India 3160 3007 2745 2936 3459 9.5 17.8<br />
Russia & Other CIS 2751 2875 2680 3018 3380 22.9 12.0<br />
Others 974 819 818 797 893 -8.3 12.0<br />
PSAI 4,617 4,980 5,551 4,832 5,933 28.5 22.8<br />
North America 814 770 749 842 1068 31.2 26.8<br />
Europe 1551 1830 2084 1693 2303 48.5 36.0<br />
India 653 622 711 662 752 15.2 13.6<br />
RoW 1599 1758 2007 1635 1810 13.2 10.7<br />
Proprietary products 420 417 453 528 610 45.2 15.5<br />
Total 18,704 18,986 20,170 19,784 22,679 21.3 14.6<br />
Emkay Research 17 November 2011 14
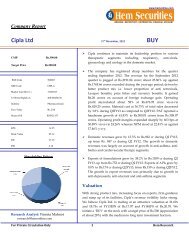
<strong>Dr</strong>. Reddy’s – Domestic Metrics<br />
<strong>Dr</strong>. Reddy’s <strong>Lab</strong> Confluence: Pharma; Pre-conference note<br />
<strong>Dr</strong>. Reddy’s therapeutic growth Field force productivity<br />
Therapies<br />
FY11 %<br />
Contribution<br />
MAT<br />
Sep'11<br />
MAT<br />
Sep'10<br />
% YoY<br />
Gr.<br />
Gastro 24.5 297.1 270.8 9.7<br />
CVS 19.5 236.1 214.2 10.2<br />
Pain Mgmt 10.9 132.0 141.8 -6.9<br />
Anti-infective 8.8 106.5 106.5 0.0<br />
Anti-diabetic 6.3 76.9 65.9 16.7<br />
Respiratory 5.7 69.2 58.8 17.6<br />
Dermatology 6.3 76.5 55.4 38.1<br />
Gynecology 1.2 15.0 15.3 -2.3<br />
CNS 0.9 10.6 10.5 0.6<br />
Others 15.9 192.4 180.2 6.8<br />
Acute 69.5 842.1 786.4 7.1<br />
Chronic 30.5 370.2 333.1 11.1<br />
Total Sales 100.0 1212.2 1119.4 8.3<br />
x<br />
Sep’11 MAT growth for <strong>Dr</strong>. Reddy has been lower at 8%<br />
� Acute segment which contributes 70% grew by 7%<br />
� Chronic segment which contributes 30% grew by 11%<br />
Emkay Research 17 November 2011 15<br />
3,000<br />
2,500<br />
2,000<br />
1,500<br />
1,000<br />
500<br />
0<br />
FY08 FY09 FY10 FY11<br />
Field force Productivity<br />
� The <strong>com</strong>pany has hired ~600 people during FY11<br />
� MR productivity declined due to higher attrition rate<br />
Growth drivers - Volume/ Price/ New launches Top 10 brand performance<br />
Total Gr. 8.3%<br />
4.0<br />
2.8<br />
1.5<br />
Total Gr. 14.4%<br />
4.3<br />
2.5<br />
7.6<br />
<strong>Dr</strong>. Reddy Industry<br />
Vol Gr. Price Gr. New launches<br />
� <strong>Dr</strong>. Reddy’s underperformed industry due to subdued volume growth in<br />
existing brands during MAT Sep’11<br />
� This was mainly due to increased <strong>com</strong>petition and high attrition rate in<br />
its field force<br />
Source: AIOCD, Emkay Research<br />
Rs Cr Therapy<br />
MAT<br />
Sep'11<br />
MAT<br />
Sep'10<br />
5.4<br />
5.2<br />
5.0<br />
4.8<br />
4.6<br />
4.4<br />
4.2<br />
4.0<br />
% YoY<br />
Gr.<br />
Omez Gastro 116.9 110.9 5.4<br />
Nise NSAID 71.3 87.3 -18.3<br />
Stamlo CVS 56.3 54.9 2.5<br />
Omez D Gastro 41.9 35.8 17.0<br />
Stamlo Beta CVS 39.1 36.6 6.9<br />
Atocor CVS 35.6 31.8 12.0<br />
Razo Gastro 33.8 31.8 6.1<br />
Mintop CVS 29.7 23.6 25.6<br />
Econorm Gastro 26.2 22.0 18.8<br />
Razo D Gastro 25.0 21.1 18.7<br />
Total 475.8 455.8 4.4<br />
� Top 10 brands contribute 43% to the domestic formulation sales<br />
� As iterated earlier, <strong>com</strong>petition continues to hurt the growth of the<br />
<strong>com</strong>pany’s top brand Omez. Also recent issues with DCGI has<br />
led to de-growth of Nise brand
Financial Snapshot<br />
<strong>Dr</strong>. Reddy’s <strong>Lab</strong> Confluence: Pharma; Pre-conference note<br />
(Rs mn) FY11 FY12E YoY % FY13E YoY %<br />
Global Generics 53,340 63,958 20 69,208 8<br />
NA 18,996 26,278 38 26,738 2<br />
Europe 8,431 8,361 -1 8,599 3<br />
India 11,690 12,911 10 14,744 14<br />
Russia & Other CIS 10,858 12,369 14 14,077 14<br />
Others 3366 4039 20 5049 25<br />
PSAI 19,647 21,409 9 23,541 10<br />
North America 3170 3329 5 3528 6<br />
Europe 7,020 7,792 11 8,727 12<br />
India 2619 2698 3 2860 6<br />
RoW 6,838 7,591 11 8,426 11<br />
Proprietary products 675 844 25 1013 20<br />
Others 1030 1184 15 1303 10<br />
Gross Revenues 74,692 87,395 17 95,064 9<br />
FTF 4,677 7,024 50 6,538 -7<br />
Base business 70,015 80,371 15 88,526 10<br />
EBITDA 17,121 20,443 19 22,579 10<br />
EBITDA % 22.9 23.4 47 23.8 36<br />
FTF - EBITDA 3,180 3,783 19 2,818 -26<br />
Base business - EBITDA 13,941 16,661 20 19,761 19<br />
Base EBITDA % 19.9 20.7 - 22.3 -<br />
PAT 12,314 13,660 11 15,393 13<br />
PAT % 16.5 15.6 -86 16.2 56<br />
FTF - PAT 1,590 3,253 105 2,423 -26<br />
Base business - PAT 10,724 10,407 -3 12,970 25<br />
EPS 72.9 80.7 11 91.2 13<br />
FTF - EPS 9.4 19.2 - 14.3 -<br />
Base - EPS 63.5 61.6 -3 76.7 25<br />
PE @ CMP 22.2 20.0 - 17.7 -<br />
Base PE @ CMP 25.5 26.3 - 20.2 -<br />
FTF/ Para-IV Opportunities<br />
Product Generic Name<br />
EPS<br />
2012<br />
Sales<br />
($ mn) FY12<br />
EPS<br />
2013<br />
Sales<br />
($ Mn) FY13<br />
Expected<br />
Launch<br />
Brand Sales<br />
($ Mn)<br />
Gemzar Gemcitabine 0.4 3.6 0.0 0.0 Launched 634 10+<br />
Effexor XR Venlafaxine 0.9 7.7 0.0 0.0 Launched 2300 10+<br />
Exclusivity<br />
Exelon Rivastigmine 0.7 5.3 0.2 1.7 Launched 379 Shared<br />
Zyprexa (20mg) Olanzipine 16.1 103.1 1.5 9.4 Launched 900 Sole<br />
Propecia Finasteride 0.0 0.0 2.6 16.8 Jan-12 500 Sole<br />
Avandia Rosiglitazone 0.1 0.8 0.8 9.1 Mar-12 400 Shared<br />
Boniva Ibandronate 0.1 0.6 0.6 6.8 Mar-12 500 Shared<br />
Plavix Clopidogrel 0.0 0.0 3.7 33.3 May-12 6666 Many<br />
Geodon * Ziprasidone 0.6 3.6 3.1 20.1 Sep-12 800 Shared<br />
Lexapro Escitlopram 0.0 0.0 0.8 6.9 Sep-12 2300 10+<br />
Clarinex Desloratidine 0.5 4.8 0.5 5.3 Sep -12 * 400 Shared¹<br />
Actos Pioglitazone 0.0 0.0 0.4 3.9 Jan-13 3100 10+<br />
Total 19.2 129.3 14.3 113.3 18879<br />
Emkay Research 17 November 2011 16
Financials<br />
In<strong>com</strong>e Statement Balance Sheet<br />
<strong>Dr</strong>. Reddy’s <strong>Lab</strong> Confluence: Pharma; Pre-conference note<br />
Y/E, Mar (Rs. mn) FY10 FY11 FY12E FY13E Y/E, Mar (Rs. mn) FY10 FY11 FY12E FY13E<br />
Net Sales 70,310 76,558 89,789 96,268 Equity share capital 844 846 846 846<br />
Growth (%) 2.2 8.9 17.3 7.2 Reserves & surplus 36,924 41,797 50,204 60,242<br />
Expenditure 54,549 59,437 69,346 73,648 Net worth 37,768 42,643 51,050 61,088<br />
Raw Materials 22,688 21,987 26,007 29,265 Minority Interest 0 0 0 0<br />
SGA 18,179 21,576 24,258 24,602 Secured Loans 9,275 14,394 13,394 11,894<br />
Employee Cost 10,948 12,786 14,663 15,080 Unsecured Loans 5,568 9,311 8,311 7,311<br />
Other Exp 2,734 3,088 4,418 4,701 Loan Funds 14,843 23,705 21,705 19,205<br />
EBITDA 15,762 17,121 20,443 22,620 Net deferred tax liability 71 -224 -224 -224<br />
Growth (%) 6.9 8.6 19.4 10.6 Total Liabilities 52,682 66,124 72,531 80,069<br />
EBITDA margin (%) 22.4 22.4 22.8 23.5<br />
Depreciation 4,131 3,981 4,366 4,756 Gross Block 64,469 79,752 84,752 89,752<br />
EBIT 11,631 13,140 16,077 17,864 Less: Depreciation 40,946 45,896 50,230 54,986<br />
EBIT margin (%) 16.5 17.2 17.9 18.6 Net block 23,522 33,855 34,522 34,766<br />
Other In<strong>com</strong>e 1,014 1,259 1,376 1,767 Capital work in progress 7,622 6,045 5,085 5,385<br />
Interest expenses 312 246 795 818 Investment 3,580 9 9 9<br />
PBT 6,183 14,153 12,692 15,857 Current Assets 38,202 49,842 56,843 66,152<br />
Tax 2,668 1,839 2,285 2,847 Inventories 13,394 15,992 16,262 17,586<br />
Effective tax rate (%) 43.2 13.0 18.0 18.0 Sundry debtors 11,599 16,507 17,548 18,802<br />
Adjusted PAT 8,435 12,314 13,660 18,687 Cash & bank balance 6,600 8,076 12,505 18,482<br />
(Profit)/loss from JV's/Ass/MI 0 0 0 3,253 Loans & advances 0 0 0 0<br />
Adjusted PAT after MI 8,435 12,314 13,660 15,434 Other current assets 6,609 9,267 10,529 11,281<br />
Growth (%) 11.0 46.0 10.9 13.0 Current lia & Prov 20,245 23,628 23,927 26,243<br />
Net Margin (%) 12.0 16.1 15.2 16.0 Current liabilities 16,746 20,188 20,697 22,172<br />
E/O items -6,150 0 0 0 Provisions 3,499 3,440 3,230 4,071<br />
Reported PAT 3,515 12,314 13,660 15,434 Net current assets 17,957 26,214 32,915 39,909<br />
Growth (%) -138.3 250.3 10.9 13.0 Misc. exp & Def. Assets 0 0 0 0<br />
Cash Flow Key Ratios<br />
Total Assets 52,682 66,124 72,531 80,069<br />
Y/E, Mar (Rs. mn) FY10 FY11 FY12E FY13E Y/E, Mar FY10 FY11 FY12E FY13E<br />
PBT (Ex-Other in<strong>com</strong>e) 5,169 12,894 11,316 14,091 Profitability (%)<br />
Depreciation 4,131 3,981 4,366 4,756 EBITDA Margin 22.4 22.4 22.8 23.5<br />
Interest Provided 312 246 795 818 Net Margin 12.0 16.1 15.2 16.0<br />
Other Non-Cash items 0 0 0 0 ROCE 23.4 24.2 25.1 25.7<br />
Chg in working cap 4,709 -6,784 -2,291 -1,017 ROE 9.6 30.6 22.2 23.2<br />
Tax paid -2,668 -1,839 -2,284 -2,855 RoIC 13.8 21.9 22.2 24.0<br />
Operating Cashflow 11,653 8,498 11,901 15,793 Per Share Data (Rs)<br />
Capital expenditure -1,709 -12,737 -4,072 -5,300 EPS 50.0 72.8 80.7 91.2<br />
Free Cash Flow 9,944 -4,239 7,829 10,493 CEPS 110.9 96.3 106.5 119.3<br />
Other in<strong>com</strong>e 1,014 1,259 1,375 1,772 BVPS 223.7 252.0 301.7 361.0<br />
Investments -3,057 3,571 0 0 DPS 11.3 11.3 10.0 15.0<br />
Investing Cashflow -3,752 -7,907 -2,698 -3,528 Valuations (x)<br />
Equity Capital Raised 226 243 3,253 2,423 PER 32.4 22.2 20.0 17.7<br />
Loans Taken / (Repaid) -5,133 8,862 -2,000 -2,500 P/CEPS 14.6 16.8 15.2 13.6<br />
Interest Paid -312 -246 -795 -818 P/BV 7.2 6.4 5.4 4.5<br />
Dividend paid (incl tax) -2,216 -2,217 -1,980 -2,969 EV / Sales 4.0 3.8 3.1 2.8<br />
In<strong>com</strong>e from investments 0 0 0 0 EV / EBITDA 17.8 16.9 13.8 12.1<br />
Others 511 -5,757 -3,253 -2,423 Dividend Yield (%) 0.7 0.7 0.6 0.9<br />
Financing Cashflow -6,924 885 -4,774 -6,288 Gearing Ratio (x)<br />
Net chg in cash 977 1,476 4,429 5,977 Net Debt/ Equity 0.2 0.4 0.2 0.0<br />
Opening cash position 5,623 6,600 8,076 12,505 Net Debt/EBIDTA 0.5 0.9 0.5 0.0<br />
Closing cash position 6,600 8,076 12,505 18,482 Working Cap Cycle (days) 77 103 96 97<br />
Emkay Research 17 November 2011 17
Notes<br />
<strong>Dr</strong>. Reddy’s <strong>Lab</strong> Confluence: Pharma; Pre-conference note<br />
Emkay Research 17 November 2011 18
November 17, 2011<br />
Reco<br />
Not Rated<br />
CMP<br />
Rs375<br />
Target Price<br />
NA<br />
EPS change FY11E/12E (%) NA<br />
Target Price change (%) NA<br />
Nifty 5,030<br />
Sensex 16,756<br />
Price Performance<br />
(%) 1M 3M 6M 12M<br />
Absolute (1) 3 4 (4)<br />
Rel. to Nifty 1 3 14 14<br />
Source: Bloomberg<br />
Relative Price Chart<br />
425<br />
400<br />
375<br />
350<br />
325<br />
Rs<br />
300<br />
Nov-10 Jan-11 Mar-11 May-11 Jul-11 Sep-11<br />
Source: Bloomberg<br />
Elder Pharma (LHS) Rel to Nifty (RHS)<br />
Stock Details<br />
Sector Pharmaceuticals<br />
Bloomberg ELDP@IN<br />
Equity Capital (Rs mn) 206<br />
Face Value(Rs) 10<br />
No of shares o/s (mn) 21<br />
52 Week H/L 435/309<br />
Market Cap (Rs bn/USD mn)<br />
%<br />
30<br />
20<br />
10<br />
0<br />
-10<br />
-20<br />
8/161<br />
Daily Avg Volume (No of sh) 90672<br />
Daily Avg Turnover (US$mn) 0.7<br />
Shareholding Pattern (%)<br />
Sep-11 Jun-10 Mar-10<br />
Promoters 38.5 38.5 39.6<br />
FII/NRI 32.3 32.5 32.0<br />
Institutions 8.3 9.1 7.9<br />
Private Corp 7.5 7.2 7.9<br />
Public 13.5 12.8 12.7<br />
Source: Capitaline<br />
Deepak Malik<br />
Deepak.malik@emkayglobal.<strong>com</strong><br />
+91 22 6612 1257<br />
Ashish Thavkar<br />
ashish.thavkar@emkayglobal.<strong>com</strong><br />
+91 22 6612 1254<br />
Bhavita Nagrani<br />
bhavita.nagrani@emkayglobal.<strong>com</strong><br />
+91 22 6624 2486<br />
Elder Pharma<br />
New launches to drive future growth<br />
� <strong>Company</strong> raised Rs 2.6bn to fund international investment in<br />
Nutraceutical business to access foothold in Regulated<br />
markets<br />
� Launched the brand “Carnisure” in CVS category which has<br />
achieved Rs.160 mn revenue in the first year of launch<br />
� Entered into a 50:50 Joint venture in Guernsey, UK for web<br />
marketing of its products<br />
� <strong>Company</strong>’s main focus is on Women’s healthcare, Pain<br />
Management, Nutraceuticals and Anti Infective<br />
Key Highlights<br />
� The <strong>Company</strong> raised Rs619mn by way of QIP and Rs1.92bn through NCDs in two<br />
tranches of Rs1.18bn and Rs730mn on 23 rd Dec 2010 and 31 st March 2011<br />
� Elder acquired 100% stake in UK based Nutraceutical <strong>com</strong>pany NutraHealth PLC UK<br />
in November 2010 for GBP 9.8mn to access multiple Nutrition brands in UK and to<br />
establish footprint in Regulated markets<br />
� <strong>Company</strong> enhanced the stake in Biomeda, Bulgaria to 92.2% by acquiring additional<br />
stake of 31.2% with an investment of Rs400mn. <strong>Company</strong> is further planning<br />
investment of Rs220mn in its facilities and making them EU <strong>com</strong>pliant<br />
� In the Indian market the <strong>com</strong>pany is known for its shelcal brand, which is 23rd largest<br />
brand in the Indian pharma market with ~25% market share. This brand is a part of<br />
women’s healthcare portfolio (contributes 23% to domestic sales) – other brands in<br />
this category are Deviry, B-Long and Hormorin<br />
Going Forward<br />
� Elder Pharma is planning to foray into the growing and lifestyle healthcare sector<br />
including hypertension, diabetes and Cardiac care<br />
� The <strong>com</strong>pany is also planning to spend up to Rs550mn in next 2 years for increasing<br />
sales force, updating its R&D facilities and for brand building exercises<br />
� Elder Pharmaceuticals will launch 12 new products this fiscal in the areas of<br />
gynecology, pain management and nutraceuticals<br />
� The newly launched Vitamin D drug under the name of D-360 is expected to boost<br />
sales in this therapy in the <strong>com</strong>ing quarters<br />
Valuations<br />
At current price, the stock trades at 12x FY11 EPS of Rs31 and 17X FY11 EV/EBITDA.<br />
Financials Rs mn<br />
YE- Net EBITDA EPS EPS RoE EV/<br />
Mar Sales (Core) (%) APAT (Rs) % chg (%) P/E EBITDA P/BV<br />
FY08 5,512 1173.4 19.4 698 36.6 32.2 20.3 10.2 8.8 2.1<br />
FY09 6,203 919.4 13.0 467 31.8 -13.2 12.3 11.8 12.2 2.0<br />
FY10 7,216 666.2 6.9 532 25.7 -19.1 12.2 14.6 19.0 1.6<br />
FY11 9,595 838.4 5.7 678 30.7 19.5 12.4 12.2 16.7 1.3<br />
Emkay Global Financial Services Ltd 19<br />
<strong>Company</strong> <strong>Update</strong>
Key Financials – Quarterly<br />
Elder Pharma Confluence: Pharma; Pre-conference note<br />
<strong>Company</strong> Description<br />
Elder Pharma was incorporated in 1983. The <strong>com</strong>pany is engaged into manufacturing and<br />
marketing of prescription pharmaceutical brands, surgical and medical devices. Elder is one<br />
the leading <strong>com</strong>panies in the pharmaceutical formulation market in India. It holds market<br />
leader position in three therapeutic segments - Women’s Healthcare, Wound Care and<br />
Nutraceuticals. It entered into alliances with foreign <strong>com</strong>panies for manufacture and sale of<br />
their products under license from them.<br />
In the domestic space, <strong>com</strong>pany’s large part of revenues <strong>com</strong>es from Shelcal brand in<br />
women healthcare segment. This brand contributes ~17% to its topline and women’s<br />
healthcare portfolio contributes 23% of the domestic sales. Anti Infectives contribute ~12%<br />
to total sales; the key brands in this space are Cefixime and Formic. <strong>Company</strong> has made<br />
two major acquisitions Biomeda (Bulgaria) and Brunel Healthcare (Brunel). Brunel’s<br />
acquisition has MHRA approved manufacturing facility. Glucosamine is a major API<br />
manufactured at this facility. Elder has raised the stake in Biomeda to 92.2%. Further<br />
<strong>com</strong>pany is intending to inject CAPEX of ~$5mn for up-gradation of facilities and making<br />
the plant EU <strong>com</strong>pliant.<br />
Rs mn Q2FY11 Q3FY11 Q4FY11 Q1FY12 Q2FY12 YoY (%) QoQ (%)<br />
Net Sales 2107 2515 3027 2997 3311 57.2 10.5<br />
Other Operating In<strong>com</strong>e 2 2 5 3 4 82.6 27.3<br />
Other In<strong>com</strong>e 12 19 9 22 22 85.7 1.8<br />
Total In<strong>com</strong>e 2121 2536 3040 3022 3337 57.4 10.4<br />
Total Expenditure 1704 2080 2529 2486 2780 63.2 11.8<br />
as % of sales 80.9 82.7 83.5 83.0 84.0<br />
Consumption of RM 1036 1304 1497 1503 1657 60.0 10.3<br />
as % of sales 49.2 51.8 49.4 50.1 50.1<br />
Employee Cost 284 281 479 433 468 64.7 8.2<br />
as % of sales 13.5 11.2 15.8 14.4 14.1<br />
Other expenditure 384 495 553 551 655 70.6 18.8<br />
as % of sales 18.2 19.7 18.3 18.4 19.8<br />
EBITDA 417 456 511 535 557 33.6 4.1<br />
Adj. EBITDA 431 456 524 544 572 32.8 5.1<br />
Interest 149 176 214 195 212 42.3 8.9<br />
PBDT 268 280 297 340 345 28.8 1.3<br />
Depreciation 75 80 90 87 91 21.0 3.9<br />
PBT 193 200 207 253 254 31.9 0.4<br />
Tax 58 43 34 53 62 7.8 17.0<br />
Reported Profit 135 157 173 200 192 42.1 (3.9)<br />
Extra-ordinary Items -11 -11 -11 -8 -12 10.8 57.7<br />
RPAT 147 168 184 208 205 39.7 (1.6)<br />
EPS 7.2 7.71 8.45 9.79 9.42 30.8 (3.8)<br />
Margins (%) (bps) (bps)<br />
EBIDTA 19.8 18.1 16.9 17.9 16.8 -296 -103<br />
Adj. EBITDA 20.5 18.1 17.3 18.2 17.3 -317 -88<br />
EBIT 16.2 14.9 13.9 15.0 14.1 -215 -86<br />
EBT 2.7 1.7 1.1 1.8 1.9 -86 10<br />
PAT 7.0 6.7 6.1 6.9 6.2 -77 -76<br />
Effective Tax rate 29.8 21.3 16.4 20.9 24.4 -544 345<br />
Emkay Research 17 November 2011 20
Financials<br />
Elder Pharma Confluence: Pharma; Pre-conference note<br />
In<strong>com</strong>e Statement (Rs. mn) Balance Sheet (Rs. mn)<br />
(Year Ending Mar 31) FY08 FY09 FY10 FY11 (Year Ending Mar 31) FY08 FY09 FY10 FY11<br />
Net Sales 5,512 6,203 7,216 9,595 Share Capital 188 189 189 206<br />
Growth (%) 23% 13% 16% 33% Reserves & Surplus 3,458 3,733 4,616 5,886<br />
Other In<strong>com</strong>e -43 312 601 908 Networth 3,646 3,922 4,805 6,092<br />
Total In<strong>com</strong>e 5,469 6,516 7,817 10,503 Minority Interest 0 0 104 31<br />
Expenditure 4,339 5,284 6,550 8,757 Secured Loans 1,704 3,345 4,041 7,056<br />
Raw Materials 2,584 3,139 4,055 5,583 Unsecured Loans 1,712 1,647 1,698 1,954<br />
% to Sales 46.9% 50.6% 56.2% 58.2% Loan funds 3,416 4,991 5,739 9,011<br />
Employee Cost 728 838 967 1,191 Net Deferred Tax 52 50 38 35<br />
% to Sales 13.2% 13.5% 13.4% 12.4% Total Liabilities 7,114 8,964 10,686 15,168<br />
Other Expenses 128 104 118 136<br />
% to Sales 2.3% 1.7% 1.6% 1.4% Gross Block 2,115 2,249 5,610 8,184<br />
Selling & Admin Expenses 899 1,203 1,411 1,848 Less: Acc Depreciation 424 536 705 1,709<br />
% to Sales 16.3% 19.4% 19.5% 19.3% Net Block 1,692 1,713 4,904 6,475<br />
Operating Profit 1,173 919 666 838 Capital Work in Progress 1,634 2,522 657 950<br />
EBITDA Margin (%) 21.3 14.8 9.2 8.7 Investments 879 502 660 102<br />
Depreciation 106 115 172 287 Current Assets 3,771 5,393 5,702 9,878<br />
EBIT 1,067 804 494 551 Inventories 837 881 1,434 2,418<br />
EBIT margin (%) 19.4 13.0 6.9 5.7 Sundry Debtors 1,396 1,776 1,954 2,825<br />
Interest 238 414 530 655 Cash and Bank 790 1,464 786 2,671<br />
% to Debt 7.0% 8.3% 9.2% 7.3% Loans and Advances 749 1,271 1,528 1,965<br />
Profit Before Tax 786 703 565 804 Current Liab and Prov 861 1,166 1,238 2,238<br />
Tax 77 80 105 172 Current Liabilities 626 879 986 1,881<br />
Fringe Benefit Tax 15 16 0 0 Provisions 235 286 252 357<br />
Deferred Tax -3 -2 -12 -3 Net Current Assets 2,910 4,227 4,464 7,641<br />
Net Profit 697 608 472 636 Total Assets 7,114 8,964 10,686 15,168<br />
Minority Interest (after tax) 0 0 -23 -7<br />
Profit after Min. Int. 697 608 495 642<br />
Extraordinary Items -1 141 -37 -35<br />
Adjusted Net Profit 698 467 532 678<br />
Net margin (%) 12.7 7.5 7.4 7.1<br />
Cash Flow (Rs. mn) Key Ratios<br />
(Year Ending Mar 31) FY08 FY09 FY10 FY11 (Year Ending Mar 31) FY08 FY09 FY10 FY11<br />
Opening Cash Position 570 790 1464 786 Profitability (%)<br />
Operating Cash Flow 208 1361 -910 431 EBITDA Margin 21.3 14.8 9.2 8.7<br />
Investing Cash Flow -1083 -347 -1611 -1552 Net Margin 12.7 7.5 7.4 7.1<br />
Financing Cash Flow 1095 -339 1843 3006 ROCE 16.7 10.0 5.0 4.3<br />
Net Change in Cash 220 674 -678 1885 ROE 20.3 12.3 12.2 12.4<br />
Closing Cash Position 790 1464 786 2671 ROIC 29.8 19.4 7.6 5.5<br />
Per Share Data (Rs)<br />
EPS 36.6 31.8 25.7 30.7<br />
CEPS 39.2 28.4 34.3 47.1<br />
BVPS 177.9 191.3 234.4 297.2<br />
DPS 2.3 2.3 2.8 3.0<br />
Valuations (x)<br />
PER 10.2 11.8 14.6 12.2<br />
P/CEPS 9.6 13.2 10.9 8.0<br />
P/BV 2.1 2.0 1.6 1.3<br />
EV / Sales 1.9 1.8 1.8 1.5<br />
EV / EBITDA 8.8 12.2 19.0 16.7<br />
Dividend Yield (%) 0.6 0.6 0.7 0.8<br />
Gearing Ratio (x)<br />
Net Debt/ Equity 0.7 0.9 1.0 1.0<br />
Net Debt/EBIDTA 2.2 3.8 7.4 7.6<br />
Source: Capitaline<br />
Emkay Research 17 November 2011 21
Notes<br />
Elder Pharma Confluence: Pharma; Pre-conference note<br />
Emkay Research 17 November 2011 22
November 16, 2011<br />
Reco<br />
Buy<br />
CMP<br />
Rs 334<br />
Previous Reco<br />
Buy<br />
Target Price<br />
Rs 401<br />
EPS change FY12E/13E (%) NA<br />
Target Price change (%) NA<br />
Nifty 5,069<br />
Sensex 16,883<br />
Price Performance<br />
(%) 1M 3M 6M 12M<br />
Absolute 13 4 10 (4)<br />
Rel. to Nifty 14 4 18 15<br />
Source: Bloomberg<br />
Relative Price Chart<br />
400<br />
370<br />
340<br />
310<br />
280<br />
Rs<br />
250<br />
Nov-10 Jan-11 Mar-11 May-11 Jul-11 Sep-11<br />
Source: Bloomberg<br />
Glenmark Pharma (LHS) Rel to Nifty (RHS)<br />
Stock Details<br />
Sector Pharmaceuticals<br />
Bloomberg GNP@IN<br />
Equity Capital (Rs mn) 270<br />
Face Value(Rs) 1<br />
No of shares o/s (mn) 270<br />
52 Week H/L 390/242<br />
Market Cap (Rs bn/USD mn)<br />
%<br />
20<br />
12<br />
4<br />
-4<br />
-12<br />
-20<br />
90/1,776<br />
Daily Avg Volume (No of sh) 577746<br />
Daily Avg Turnover (US$mn) 3.6<br />
Shareholding Pattern (%)<br />
Sep-11 Jun-11 Mar-11<br />
Promoters 48.3 48.3 48.3<br />
FII/NRI 33.2 31.9 31.2<br />
Institutions 6.4 6.9 6.9<br />
Private Corp 1.9 2.2 2.7<br />
Public 10.2 10.7 11.0<br />
Source: Capitaline<br />
Deepak Malik<br />
deepak.malik@emkayglobal.<strong>com</strong><br />
+91 22 6612 1257<br />
Ashish Thavkar<br />
ashish.thavkar@emkayglobal.<strong>com</strong><br />
+91 22 6612 1254<br />
Bhavita Nagrani<br />
bhavita.nagrani@emkayglobal.<strong>com</strong><br />
+91 22 6624 2486<br />
Glenmark Pharma<br />
Growth from all the corners<br />
� Domestic operations are cash cow for the <strong>com</strong>pany. Focus on<br />
specialties like derma, respiratory, CVS & gynaec will lead to<br />
16-18% revenue CAGR over FY11-13E<br />
� In US, strong ANDA basket coupled with limited <strong>com</strong>petition<br />
launches such as the Malorene, Cutivate and Oxycodone<br />
would lead to 15% revenue CAGR over FY11-13E<br />
� Post restructuring of operations (reducing working capital) in<br />
the SRM markets, we expect SRM sales to grow at 18% CAGR<br />
over FY11-13E<br />
� On account of good momentum in key business verticals, we<br />
maintain our Buy rating on the stock with a target price of<br />
Rs401 (18x FY12 Base Business EPS + Adjusted NPV of Rs45)<br />
India business – On a strong footing<br />
� Glenmark is gaining market share in the domestic market driven by steady volume<br />
growth and new product introductions. Focused approach on key specialty<br />
segments like dermatology, cardiology, respiratory, analgesics and gynecology has<br />
led to improvement in overall margins.<br />
� Indian operations are cash cow for the <strong>com</strong>pany. Strong performance from key<br />
specialties, new product launches coupled with recent addition to the filed force<br />
would lead to 16-18%+ growth in the Indian business. Total MR strength is ~2400<br />
US Generics – Strong portfolio with limited <strong>com</strong>petition opportunities<br />
� ANDA basket consists of 69 generic products authorized for distribution with 40<br />
pending for approval with the USFDA including 13 Para IV filings till date<br />
� Malorene – expected launch in Q3FY12 and Cutivate – expected launch in Q4FY12<br />
are key upside triggers for the stock<br />
� Management has guided for launch of 7 new products in the OCs, oral solids and<br />
semi solids space, as well as exclusive launches. It has already launched 5 OC<br />
products. We expect US business to clock 15% revenue CAGR over FY11-13E<br />
Glenmark’s NCE pipeline lends credibility to its research capabilities<br />
� Glenmark currently has a pipe-line of 5 NCE & NBE molecules which are under<br />
various stages of clinical development. This includes Crofelemer, which has been<br />
in-licensed by Glenmark from Napo Pharma<br />
� Glenmark has been successful in monetizing part of its NCE pipeline. While it has<br />
suffered a few setbacks in the past, we believe that overall, Glenmark’s ability to<br />
derive value from the NCE pipeline has been credible<br />
Valuation<br />
We expect Glenmark Pharma to report 24% revenue growth in FY12E and 8% growth in<br />
FY13E. We expect EBIDTA margins to move from 20.1% in FY11 to 26.1% in FY12 and<br />
23.8% in FY13. Earnings will grow by 19% CAGR over FY11-13E. We maintain Buy<br />
rating on the stock with a target of Rs401 (18x FY12 base business earnings + adjusted<br />
NPV of Rs45). At CMP, the stock is trading at 13.9x FY12E and 14.1x FY13E earnings.<br />
Financials Rs mn<br />
YE- Net EBITDA EPS EPS RoE EV/<br />
Mar Sales (Core) (%) APAT (Rs) % chg (%) P/E EBITDA P/BV<br />
FY10 24848 6196 24.9 3287 12.2 8.3 15.6 27.4 16.1 3.9<br />
FY11 29491 5923 20.1 4532 16.8 37.9 20.9 19.9 18.8 4.5<br />
FY12E 36475 9520 26.1 6477 24.0 42.9 27.9 13.9 10.9 3.4<br />
FY13E 39323 9437 24.0 6413 23.8 -1.0 22.0 14.1 10.7 2.8<br />
Emkay Global Financial Services Ltd 23<br />
<strong>Company</strong> <strong>Update</strong>
Key Financials – Quarterly<br />
Glenmark Pharma Confluence: Pharma; Pre-conference note<br />
Rs mn Q1FY11 Q2FY11 Q1FY12 Q2FY12 YoY % QoQ % YTD'12 YTD'11 YoY %<br />
Net Sales 6817.7 7235.8 8682.5 10554.5 45.9 21.6 19237.0 14053.5 36.9<br />
Other operating in<strong>com</strong>e 30.8 4.8 2.1 2.1 -55.3 0.0 4.3 35.5 -88.0<br />
Total Sales 6848.5 7240.5 8684.7 10556.6 45.8 21.6 19241.3 14089.0 36.6<br />
One-time licensing In<strong>com</strong>e 900 0 1125 1184.55 - 5.3 2309.55 900 156.6<br />
Base Sales 5948.5 7240.5 7559.7 9372.1 29.4 24.0 16931.7 13189.0 28.4<br />
Raw material cost 1905.2 2485.6 2307.8 3334.7 34.2 44.5 5642.4 4390.8 28.5<br />
% to Base Sales 32.0 34.3 30.5 35.6 33.3 33.3<br />
Staff cost 1054.2 1331.8 1347.0 1575.4 18.3 17.0 2922.4 2386.0 22.5<br />
% to Base Sales 17.7 18.4 17.8 16.8 17.3 18.1<br />
Other expenses 1565.6 2009.9 2062.0 3390.8 68.7 64.4 5452.9 3575.4 52.5<br />
% to Base Sales 26.3 27.8 27.3 36.2 32.2 27.1<br />
Total Expenditure 4525.0 5827.2 5716.8 8300.9 42.5 45.2 14017.7 10352.2 35.4<br />
% to Base Sales 76.1 80.5 75.6 88.6 82.8 78.5<br />
EBITDA 2323.5 1413.3 2967.9 2255.7 59.6 -24.0 5223.6 3736.8 39.8<br />
Adj. EBITDA 1423.5 1413.3 1842.9 1871.1 32.4 1.5 3714.0 2836.8 30.9<br />
Other in<strong>com</strong>e 90.6 154.4 123.4 -80.8 -152.3 -165.5 42.6 245.1 -82.6<br />
Interest 360.6 400.3 408.1 290.6 -27.4 -28.8 698.7 760.9 -8.2<br />
Depreciation 230.3 227.8 263.8 247.2 8.5 -6.3 511.0 458.1 11.5<br />
Exceptional Item 1316.8<br />
PBT 1823.2 939.6 2419.4 320.4 -65.9 -86.8 2739.7 2762.9 -0.8<br />
Tax 117.5 77.9 318.9 -237.9 -405.3 -174.6 81.0 195.4 -58.5<br />
PAT 1705.7 861.7 2100.4 558.3 -35.2 -73.4 2658.7 2567.4 3.6<br />
Exceptional Item 0.0 0.0 0.0 2116.8 - - 2116.8 0.0 -<br />
Payment to Paul Capital 0.0 1316.8<br />
Forex loss -80.0 800.0<br />
Adj PAT 863.7 781.7 1123.7 1252.6 60.2 11.5 2376.3 1645.4 44.4<br />
R EPS 6.3 3.2 7.8 2.1 -35.2 -73.4 9.8 9.5 3.6<br />
Adj. EPS 3.2 2.9 4.2 4.6 60.2 11.5 8.8 6.1 44.4<br />
bps bps bps<br />
EBITDA % 33.9 19.5 34.2 21.4 184.8 -1280.7 27.1 26.5 62.5<br />
Adj EBITDA % 23.9 19.5 24.4 20.0 44.5 -441.3 21.9 21.5 42.6<br />
PAT % 24.9 11.9 24.2 5.3 -661.3 -1889.7 13.8 18.2 -440.5<br />
Adj PAT % 14.5 10.8 14.9 13.4 256.9 -149.9 14.0 12.5 155.9<br />
Tax Rate % 6.4 8.3 13.2 -74.3 -8255.3 -8744.3 3.0 7.1 -411.5<br />
Rs mn Q1FY11 Q2FY11 Q1FY12 Q2FY12 YoY % QoQ % YTD'12 YTD'11 YoY %<br />
US 1830 2238 2512 3001 34.1 19.5 5512 4068 35.5<br />
Europe 80 134 175 185 37.9 5.7 361 215 67.9<br />
Latin America (Argentina) 75 115 29 41 -64.1 42.7 70 190 -63.1<br />
API 634 787 646 763 -3.0 18.2 1409 1421 -0.8<br />
Total Generics Business [A] 2620 3274 3362 3990 21.9 18.7 7352 5894 24.7<br />
Latin America ( Brazil & Others) 366 493 592 738 49.8 24.7 1330 859 54.9<br />
Semi Regulated Markets [SRM] 733 811 1047 1479 82.4 41.3 2526 1544 63.6<br />
Europe 212 351 215 378 7.4 75.5 593 563 5.2<br />
India 1878 2122 2254 2539 19.7 12.7 4793 3999 19.8<br />
Speciality Formulation [1] 3189 3777 4108 5134 35.9 25.0 9242 6966 32.7<br />
Recurring Revenues 5809 7051 7469 9124 29.4 22.2 16593 12860 29.0<br />
Out-licensing Revenues [2] 895 0 1112 1185 - - 2297 895 -<br />
Speciality Business (B= 1+2) 4084 3777 5220 6319 67.3 21.0 11539 7861 46.8<br />
Others 114 184 101 246 - - 347 298 16.2<br />
Consolidated Revenues 6818 7236 8683 10554 45.9 21.6 19237 14053 36.9<br />
Emkay Research 16 November 2011 24
Glenmark Pharma – Domestic Metrics<br />
Glenmark Pharma Confluence: Pharma; Pre-conference note<br />
Glenmark Pharma’s - therapeutic growth Field force productivity<br />
Therapies<br />
FY11 %<br />
Contribution<br />
MAT<br />
Sep'11<br />
MAT<br />
Sep'10<br />
YoY<br />
Gr. %<br />
Derma 31.0 316.4 272.7 16.0<br />
CVS 18.3 186.6 136.8 36.4<br />
Anti-infective 15.6 158.6 145.8 8.8<br />
Respiratory 15.4 157.4 135.3 16.3<br />
Pain 5.1 51.6 50.8 1.4<br />
Anti-Daibetic 4.7 48.4 49.8 -2.8<br />
Gastro 2.6 26.1 22.5 15.9<br />
Gynaec 2.3 23.5 23.0 1.9<br />
Opthalmology 2.2 22.6 19.6 15.0<br />
Others 2.8 28.4 17.4 63.5<br />
Acute 75.3 767.6 676.2 13.5<br />
Chronic 24.7 251.9 197.6 27.4<br />
Total Sales 100.0 1019.4 873.9 16.7<br />
X<br />
Sep’11 MAT growth for Glenmark has been strong at 17%<br />
� Acute segment which contributes 75% grew by 14%<br />
� Chronic segment which contributes 25% grew by 27%<br />
Emkay Research 16 November 2011 25<br />
2,500<br />
2,000<br />
1,500<br />
1,000<br />
Growth drivers - Volume/ Price/ New launches Top 10 brand performance<br />
Total Gr. 16.7%<br />
6.9<br />
7.4<br />
2.5<br />
� Glenmark out-performed industry due to healthy increase in price and<br />
good growth in new brands during MAT Sep’11<br />
Source: AIOCD, Emkay Research<br />
Total Gr. 14.4%<br />
4.3<br />
2.5<br />
7.6<br />
Glenmark Industry<br />
New launches Price Gr. Vol Gr.<br />
500<br />
0<br />
FY08 FY09 FY10 FY11<br />
Field force Productivity<br />
� The <strong>com</strong>pany has hired ~300 people during last year. Attrition rate<br />
stood at 18-20% for Glenmark<br />
� MR productivity hovers around 3.5 - 3.8x for the last 3 years<br />
Rs Cr Therapy<br />
MAT<br />
Sep'11<br />
MAT<br />
Sep'10<br />
4.0<br />
3.0<br />
2.0<br />
1.0<br />
% YoY<br />
Gr.<br />
Telma CVS 63.3 48.0 31.7<br />
Telma H CVS 59.3 45.3 30.9<br />
Candid-B Derma 52.9 46.6 13.7<br />
Ascoril Plus Respiratory 45.1 42.9 5.2<br />
Candid Derma 36.7 31.9 15.3<br />
Ascoril Resp 31.9 30.5 4.5<br />
Lizolid Anti-Infective 23.5 25.8 -8.8<br />
Alex Resp 21.9 20.7 5.7<br />
Altacef Anti-Infective 21.3 19.4 9.7<br />
Elovera Derma 19.1 17.8 7.3<br />
Total 375.0 328.8 14.0<br />
� Top 10 brands contribute 37% to the domestic formulation sales<br />
� Telma, Telma-H and the derma brands clocked healthy growth
Financial Snapshot<br />
Glenmark Pharma Confluence: Pharma; Pre-conference note<br />
(Rs mn) FY10 FY11 YoY % FY12E YoY % FY13E YoY %<br />
US Base Business 7230 8352 16 9578 15 11069 16<br />
Limited Competition 677 492 -27 500 2 1327 165<br />
Tarka 0 492 - 0 - 0 -<br />
Malorene 0 0 - 500 - 1001 -<br />
Cutivate 0 0 - 0 - 326 -<br />
Europe 299 544 82 652 20 783 20<br />
Latin America (Argentina) 343 401 17 421 5 442 5<br />
API 2627 3337 27 3683 10 4039 10<br />
1. Total Generics Business 10500 12633 20 14835 17 17659 19<br />
Latin America ( Brazil & Others) 1361 1919 41 2311 20 2718 18<br />
Semi Regulated Markets 3864 4070 5 4878 20 5622 15<br />
Europe 1363 1528 12 1742 14 2055 18<br />
India 7529 8447 12 9784 16 11268 15<br />
2. Speciality Business 14116 15963 13 18716 17 21663 16<br />
Recurring Revenues ( 1 + 2 ) 24616 28596 16 33550 17 39323 17<br />
3. Out-licensing Revenues 232 895 - 2925 - 0 -<br />
Medicis Pharma 232 0 - 0 - 0 -<br />
GRC 15300 (Sanofi) 0 895 - 0 - 0 -<br />
GBR 500 (Sanofi) 0 0 - 2925 - 0 -<br />
Consolidated Revenues ( 1 + 2 + 3 ) 24848 29491 19 36475 24 39323 8<br />
Limited <strong>com</strong>petition 677 492 - 500 - 1327 -<br />
Licensing Revenues 232 895 - 2925 - 0 -<br />
Base (Excl- limited <strong>com</strong>petition) 23939 28103 17 33050 18 37996 15<br />
Reported EBITDA 6,196 5,923 -4 9,520 61 9,437 -1<br />
EBITDA margins % 24.9% 20.1% 26.1 24.0<br />
EBITDA - Limited Competition 542 246 - 350 - 1061 -<br />
EBITDA - Licensing In<strong>com</strong>e 186 448 - 1901 - 0 -<br />
EBITDA - Base business 5468 5229 -4 7269 39 8376 15<br />
EBITDA % - Base Business 22.8% 18.6% 22.0 22.0<br />
Reported PAT 3,287 4,532 38 6,477 43 6,413 -1<br />
PAT margins % 13.2 15.4 17.8 16.3<br />
PAT - Limited Competition 271 123 - 140 - 424 -<br />
PAT - Licensing In<strong>com</strong>e 74 179 - 1141 - 0 -<br />
PAT - Base business 2942 4230 44 5197 23 5989 15<br />
PAT % - Base Business 12.3% 15.1% 15.7 15.8<br />
EPS 12.2 16.8 38 24.0 43 23.8 -1<br />
- Limited Competition 1.0 0.5 - 0.5 - 1.6 -<br />
- Licensing In<strong>com</strong>e 0.3 0.7 - 4.2 - 0.0 -<br />
- Base business 10.9 15.7 44 19.2 23 22.2 15<br />
Total Base EPS 11.9 16.1 35 19.8 23 23.8 20<br />
PE @ CMP 27.4 19.9 13.9 14.1<br />
PE - base 28.1 20.7 16.9 14.1<br />
Emkay Research 16 November 2011 26
Financials<br />
In<strong>com</strong>e Statement Balance Sheet<br />
Glenmark Pharma Confluence: Pharma; Pre-conference note<br />
Y/E, Mar (Rs. mn) FY10 FY11 FY12E FY13E Y/E, Mar (Rs. mn) FY10 FY11 FY12E FY13E<br />
Net Sales 24,848 29,491 36,475 39,323 Equity share capital 270 270 270 270<br />
Growth (%) 17.4 18.7 23.7 7.8 Reserves & surplus 23,018 20,102 26,105 32,044<br />
Expenditure 18,653 23,568 26,955 29,885 Net worth 23,288 20,372 26,375 32,314<br />
Raw Materials 8,061 9,918 11,782 12,623 Minority Interest 130 267 267 267<br />
SGA 4,583 5,009 6,493 6,999 Secured Loans 14,926 14,802 13,302 12,302<br />
Employee Cost 3,425 5,103 4,851 5,505 Unsecured Loans 3,768 6,314 5,314 4,314<br />
Other Exp 2,583 3,538 3,830 4,758 Loan Funds 18,694 21,116 18,616 16,616<br />
EBITDA 6,196 5,923 9,520 9,437 Net deferred tax liability 710 -1,081 -1,081 -1,081<br />
Growth (%) 47.3 -11.6 68.7 -0.3 Total Liabilities 42,822 40,674 44,177 48,117<br />
EBITDA margin (%) 24.9 20.1 26.1 24.0<br />
Depreciation 1,206 947 1,015 1,130 Gross Block 21,755 26,952 29,452 31,952<br />
EBIT 4,990 4,976 8,505 8,308 Less: Depreciation 3,882 4,829 5,844 6,974<br />
EBIT margin (%) 20.1 16.9 23.3 21.1 Net block 17,873 22,123 23,608 24,978<br />
Other In<strong>com</strong>e 507 1,359 473 529 Capital work in progress 6,008 0 0 0<br />
Interest expenses 1,640 1,566 1,490 1,291 Investment 181 319 319 319<br />
PBT 3,857 4,770 7,488 7,545 Current Assets 24,211 25,978 26,443 29,674<br />
Tax 569 237 1,011 1,132 Inventories 7,085 8,070 7,886 8,732<br />
Effective tax rate (%) 14.8 5.0 13.5 15.0 Sundry debtors 10,783 11,308 12,706 13,697<br />
Adjusted PAT 3,287 4,532 6,477 6,413 Cash & bank balance 1,070 1,949 927 1,936<br />
(Profit)/loss from JV's/Ass/MI 0 0 0 0 Loans & advances 5,273 4,651 4,924 5,309<br />
Adjusted PAT after MI 3,287 4,532 6,477 6,413 Other current assets 0 0 0 0<br />
Growth (%) 8.3 37.9 42.9 -1.0 Current lia & Prov 5,451 7,746 6,192 6,855<br />
Net Margin (%) 13.2 15.4 17.8 16.3 Current liabilities 5,251 7,560 5,827 6,461<br />
E/O items -249 0 0 0 Provisions 200 185 365 393<br />
Reported PAT 3,038 4,532 6,477 6,413 Net current assets 18,760 18,232 20,251 22,820<br />
Growth (%) 58.5 49.2 42.9 -1.0 Misc. exp & Def. Assets 0 0 0 0<br />
Cash Flow Key Ratios<br />
Total Assets 42,822 40,674 44,177 48,117<br />
Y/E, Mar (Rs. mn) FY10 FY11 FY12E FY13E Y/E, Mar FY10 FY11 FY12E FY13E<br />
PBT (Ex-Other in<strong>com</strong>e) 3,059 3,410 7,015 7,016 Profitability (%)<br />
Depreciation 1,206 947 1,015 1,130 EBITDA Margin 24.9 20.1 26.1 24.0<br />
Interest Provided 1,640 1,566 1,490 1,291 Net Margin 13.2 15.4 17.8 16.3<br />
Other Non-Cash items 0 0 0 0 ROCE 13.5 11.5 20.0 18.2<br />
Chg in working cap -2,441 1,670 -2,927 -1,560 ROE 15.6 20.9 27.9 22.0<br />
Tax paid -392 -237 -1,123 -1,132 RoIC 16.2 12.9 20.9 18.9<br />
Operating Cashflow 3,073 7,356 5,469 6,746 Per Share Data (Rs)<br />
Capital expenditure -3,970 -3,000 -2,500 -2,500 EPS 12.2 16.8 24.0 23.8<br />
Free Cash Flow -897 4,356 2,969 4,246 CEPS 17.7 20.3 27.8 28.0<br />
Other in<strong>com</strong>e 507 1,359 473 529 BVPS 86.0 74.8 97.0 119.0<br />
Investments 0 -138 0 0 DPS 0.4 0.5 1.5 1.5<br />
Investing Cashflow -3,463 -1,778 -2,027 -1,971 Valuations (x)<br />
Equity Capital Raised 4,092 396 0 0 PER 27.4 19.9 13.9 14.1<br />
Loans Taken / (Repaid) -1,985 2,158 -2,500 -2,000 P/CEPS 18.8 16.4 12.0 11.9<br />
Interest Paid -1,640 -1,566 -1,490 -1,291 P/BV 3.9 4.5 3.4 2.8<br />
Dividend paid (incl tax) -126 -158 -474 -474 EV / Sales 4.3 3.8 3.0 2.7<br />
In<strong>com</strong>e from investments 0 0 0 0 EV / EBITDA 16.1 18.8 10.9 10.7<br />
Others 405 -5,529 0 0 Dividend Yield (%) 0.1 0.1 0.4 0.4<br />
Financing Cashflow 745 -4,699 -4,464 -3,766 Gearing Ratio (x)<br />
Net chg in cash 355 879 -1,022 1,009 Net Debt/ Equity 0.7 0.9 0.7 0.5<br />
Opening cash position 715 1,070 1,949 927 Net Debt/EBIDTA 2.4 3.2 1.8 1.5<br />
Closing cash position 1,070 1,949 927 1,936 Working Cap Cycle (days) 267 204 196 196<br />
Emkay Research 16 November 2011 27
Notes<br />
Glenmark Pharma Confluence: Pharma; Pre-conference note<br />
Emkay Research 16 November 2011 28
November 17, 2011<br />
Reco<br />
Buy<br />
CMP<br />
Rs25<br />
Previous Reco<br />
Buy<br />
Target Price<br />
Rs392<br />
EPS change FY12E/13E (%) NA<br />
Target Price change (%) NA<br />
Nifty 5,069<br />
Sensex 16,883<br />
Price Performance<br />
(%) 1M 3M 6M 12M<br />
Absolute 6 (21) (16) (25)<br />
Rel. to Nifty 7 (21) (10) (9)<br />
Source: Bloomberg<br />
Relative Price Chart<br />
350<br />
320<br />
290<br />
260<br />
230<br />
Rs<br />
200<br />
Nov-10 Jan-11 Mar-11 May-11 Jul-11 Sep-11<br />
Source: Bloomberg<br />
Ipca <strong>Lab</strong> (LHS) Rel to Nifty (RHS)<br />
Stock Details<br />
Sector Pharmaceuticals<br />
Bloomberg IPCA@IN<br />
Equity Capital (Rs mn) 251<br />
Face Value(Rs) 2<br />
No of shares o/s (mn) 126<br />
52 Week H/L 351/230<br />
Market Cap (Rs bn/USD mn) 31/612<br />
Daily Avg Volume (No of sh) 203977<br />
Daily Avg Turnover (US$mn) 1.1<br />
Shareholding Pattern (%)<br />
%<br />
20<br />
12<br />
4<br />
-4<br />
-12<br />
-20<br />
Sep-11 Jun-11 Mar-11<br />
Promoters 46.1 46.1 46.1<br />
FII/NRI 10.1 10.4 9.1<br />
Institutions 22.2 22.2 22.7<br />
Private Corp 10.1 9.7 10.4<br />
Public 11.5 11.6 11.8<br />
Source: Capitaline<br />
Deepak Malik<br />
deepak.maliki@emkayglobal.<strong>com</strong><br />
+91 22 6612 1257<br />
Ashish Thavkar<br />
ashish.thavkar@emkayglobal.<strong>com</strong><br />
+91 22 6612 1254<br />
Bhavita Nagrani<br />
bhavita.nagrani@emkayglobal.<strong>com</strong><br />
+91 22 6624 2486<br />
Ipca <strong>Lab</strong>oratories Ltd<br />
Steady business, attractive valuations<br />
� Domestic formulations business to grow at a CAGR of 12%<br />
over FY11-13E due to pricing pressure, increased <strong>com</strong>petitive<br />
intensity & lower anti-malaria sales<br />
� Indore SEZ USFDA approval remain key upside catalyst –<br />
approval would pave way for improved profitability and<br />
revenue visibility<br />
� In the exports business, growth will be led by tender business<br />
in Africa and branded formulations business in CIS, Africa<br />
and Australia<br />
� Maintain Buy with a target of Rs392 (14xFY13 EPS)<br />
Field force addition and focus on new launches to boost domestic growth<br />
� IPCA has doubled its domestic formulations field force in the last two years to 4500<br />
now mainly in key therapies of Pain and CVS segment.<br />
� We expect domestic formulation business to clock 10% growth in FY12E. However,<br />
as the new field force be<strong>com</strong>es productive, growth would be back on track at 15% in<br />
FY13 thereby aiding 180bps expansion in EBITDA margins.<br />
USFDA approval for Indore SEZ plant remains the key trigger<br />
� The <strong>com</strong>pany is expecting USFDA to visit its Indore SEZ plant post the monsoon and<br />
expects approval by Q4FY12. Till date, Ipca has 24 filings in the US with 13 pending<br />
approvals<br />
� Post the approval, Ipca expects 4-5 launches from this facility in the initial year with<br />
peak revenue potential of Rs3-4bn over the next 2-3 years<br />
Momentum in branded business & anti-malarial tender to drive exports<br />
� Anti malarial business to grow from Rs1.2bn last year to Rs2.5bn this year and with<br />
the prequalification of Artisunate, <strong>com</strong>pany will further be able to participate in the<br />
rest of the 20% of anti malarial tender business (total market $250-$300mn)<br />
� Branded business to witness 35% revenue CAGR led by new launches<br />
Future growth drivers<br />
� Management has lowered it’s a domestic growth guidance to 9-10% in H2FY12,<br />
however has maintained its FY13E growth guidance at 15-18% and operating<br />
margins are expected to improve once the additional field force be<strong>com</strong>es productive<br />
Valuation<br />
We expect Ipca to report 14% growth in revenues in FY12E and 19% growth in FY13E.<br />
EBIDTA margins are expected to increase from 19.1% in FY11 to 19.9% in FY12E and<br />
20.9% in FY13E. Earnings will grow by 23% CAGR over FY11-13E. Based on strong<br />
growth in export formulations, we maintain our rating on the stock to Buy with a target<br />
price of Rs392 (14xFY13E earnings). At CMP, IPCA trades at 11x FY12E and 9x<br />
FY13E EPS.<br />
Financials Rs mn<br />
YE- Net EBITDA EPS EPS RoE EV/<br />
Mar Sales (Core) (%) APAT (Rs) % chg (%) P/E EBITDA P/BV<br />
FY10 15,596 3,236 20.7 1,991 16.0 20.4 26.6 15.6 11.0 3.6<br />
FY11 18,825 3,598 19.1 2,294 18.4 15.2 23.9 13.6 10.1 3.0<br />
FY12E 21,506 4,276 19.9 2,760 22.2 20.4 23.6 11.3 8.6 2.4<br />
FY13E 25,567 5,336 20.9 3,489 28.0 26.4 24.1 8.9 6.9 1.9<br />
Emkay Global Financial Services Ltd 29<br />
<strong>Company</strong> <strong>Update</strong>
Ipca <strong>Lab</strong>oratories Confluence: Pharma; Pre-conference note<br />
Key Financials – Quarterly Rs mn<br />
Q2FY11 Q3FY11 Q4FY11 Q1FY12 Q2FY12 YoY (%) QoQ (%) YTD'12 YTD'11 YoY (%)<br />
Revenue 5,143 4,634 7,382 5,263 6,180 20.2 17.4 11,444 9,288 23.2<br />
Expenditure 4,003 3,754 6,226 4,347 4,655 16.3 7.1 9,002 7,470 20.5<br />
as % of sales 78 81 84 83 75 - - 79 80 -<br />
Consumption of RM 2,044 1,912 3,226 2,104 2,435 19.1 15.7 4,538 3,793 19.7<br />
as % of sales 40 41 44 40 39 - - 40 41 -<br />
Employee Cost 700 649 1,099 836 728 4.0 (12.9) 1,564 1,357 15.2<br />
as % of sales 14 14 15 16 12 - - 14 15 -<br />
Other expenditure 1,259 1,193 1,901 1,408 1,492 18.5 6.0 2,900 2,321 25.0<br />
as % of sales 24 26 26 27 24 - - 25 25 -<br />
EBITDA 1,140 880 1,156 916 1,526 33.8 66.5 2,442 1,818 34.3<br />
Depreciation 137 142 228 154 176 28.5 14.1 330 266 24.2<br />
EBIT 1,003 738 928 762 1,350 34.5 77.1 2,112 1,552 36.1<br />
Other In<strong>com</strong>e 40 4 102 62 81 103.0 30.5 143 81 77.9<br />
Interest 62 56 113 83 118 89.7 41.2 201 111 81.6<br />
PBT 981 685 917 741 1,313 33.9 77.3 2,054 1,522 35.0<br />
Total Tax 337 188 306 215 262 (22.2) 21.9 478 460 3.8<br />
Adjusted PAT 730 553 611 526 1,051 44.1 99.9 1,577 1,147 37.4<br />
PAT after adjustment 652 553 717 526 1,051 61.3 99.9 1,577 1,070 47.4<br />
Extra ordinary items 296 142 26 91 -272 - - -181 267 (167.7)<br />
Reported PAT 940 640 636 617 780 (17.1) 26.4 1,396 1,329 5.1<br />
AEPS 5.2 4.4 5.8 4.2 8.4 61.3 99.9 12.7 8.6 47.4<br />
Margins (%) (bps) (bps) (bps)<br />
EBIDTA 22.2 19.0 15.7 17.4 24.7 252 728 21.3 19.6 177<br />
EBIT 19.5 15.9 12.6 14.5 21.8 233 736 18.5 16.7 175<br />
EBT 19.1 14.8 12.4 14.1 21.3 217 718 18.0 16.4 157<br />
PAT 12.7 11.9 9.7 10.0 17.0 433 702 13.8 11.5 226<br />
Effective Tax rate 34.3 27.4 33.4 29.0 20.0 (1,437) (907) 23.2 30.2 (698)<br />
Revenue Break-up<br />
Rs mn Q2FY11 Q3FY11 Q4FY11 Q1FY12 Q2FY12 YoY Gr. % QoQ Gr. % YTD’12 YTD’11 YoY %<br />
Formulations 3970 3446 3563 3956 4897 23.3 23.8 8852 6872 28.8<br />
Domestic 2219 1775 1288 1890 2292 3.3 21.3 4182 3901 7.2<br />
Exports 1751 1671 2275 2066 2605 48.8 26.1 4671 2971 57.2<br />
APIs 1172 1187 1176 1308 1283 9.5 -1.9 2591 2415 7.3<br />
Domestic 408 322 354 407 356 -12.7 -12.5 763 768 -0.6<br />
Exports 764 865 823 901 927 21.3 2.9 1828 1647 11.0<br />
Total 5142 4633 4739 5263 6180 20.2 17.4 11444 9287 23.2<br />
Emkay Research 17 November 2011 30
Ipca <strong>Lab</strong>s – Domestic Metrics<br />
Ipca <strong>Lab</strong>oratories Confluence: Pharma; Pre-conference note<br />
Ipca <strong>Lab</strong>s therapeutic growth Field Force Productivity<br />
Rs Cr<br />
FY11 %<br />
Contribution<br />
MAT<br />
Sep'11<br />
MAT<br />
Sep'10<br />
% YoY<br />
Gr.<br />
Anti-Malarials 23.6 232.4 204.4 13.7<br />
Pain Mgmt 19.2 189.4 141.9 33.5<br />
CVS 18.8 184.9 163.7 13.0<br />
Anti-Infective 8.8 86.2 90.6 -4.8<br />
Gastro 7.7 75.7 62.2 21.7<br />
Anti-diabetic 6.6 64.9 54.8 18.3<br />
CNS 3.7 36.8 36.9 -0.3<br />
Respiratory 3.7 36.4 31.6 15.1<br />
Derma 2.4 24.0 19.4 23.6<br />
Others 5.5 53.9 34.1 58.1<br />
Acute 70.4 693.4 581.9 19.2<br />
Chronic 29.6 291.1 257.7 13.0<br />
Total Sales 100.0 984.5 839.6 17.3<br />
x<br />
Sep’11 MAT growth for Ipca has been above industry rate at 17%<br />
� Acute segment which contributes 70% grew by 19%<br />
� Chronic segment which contributes 30% grew by 13%<br />
Emkay Research 17 November 2011 31<br />
4,500<br />
3,600<br />
2,700<br />
1,800<br />
Growth drivers - Volume/ Price/ New launches Top 10 brand performance<br />
Total Gr. 17.3%<br />
4.2<br />
3.5<br />
9.6<br />
Total Gr. 14.4%<br />
4.3<br />
2.5<br />
7.6<br />
Ipca Industry<br />
Vol Gr. Price Gr. New launches<br />
� Ipca’s out-performance to the industry was due to strong volume<br />
uptake in existing brands coupled with price increase and 4.2% growth<br />
from new launches during MAT Sep’11<br />
Source: AIOCD, Emkay Research<br />
900<br />
0<br />
FY08 FY09 FY10 FY11<br />
Field force Productivity<br />
� Ipca has added 600 people to its field force during FY11<br />
� MR productivity declined due to higher MR additions which are yet<br />
to contribute meaningfully to the top line<br />
Rs Cr<br />
MAT<br />
Sep’11<br />
MAT<br />
Sep’10<br />
1.8<br />
1.5<br />
1.2<br />
0.9<br />
% YoY<br />
Gr. Therapy<br />
Lariago 57.0 63.2 -9.8 Malaria<br />
HCQS 44.9 37.3 20.3 Malaria<br />
Rapither 38.6 26.6 44.7 CNS<br />
Zerodol P 37.1 34.5 7.5 Malaria<br />
Perinorm 35.1 22.3 57.2 Malaria<br />
Larinate 30.8 30.5 0.8 Gastro<br />
Zerodol SP 26.5 16.2 64.0 CNS<br />
Glyconorm M 24.2 18.5 30.6 CNS<br />
Zerodol 23.9 21.4 11.8 Diabetes<br />
Tenoric 23.8 14.6 62.7 Malaria<br />
Total 341.8 285.2 19.8<br />
� Top 10 brands contribute 35% to the domestic formulation sales<br />
� HCQS, Zerodol, Rapither and Perinorm clocked growth in excess of<br />
20%. However, <strong>com</strong>pany’s top malaria brand Lariago declined 10%<br />
during the period.
Financial Snapshot<br />
Ipca <strong>Lab</strong>oratories Confluence: Pharma; Pre-conference note<br />
Rs mn FY11 FY12E YoY % FY13E YoY %<br />
Formulations 13,881 16,490 18.8% 20,289 23.0%<br />
Domestic 6,964 7,669 10.1% 8,797 14.7%<br />
Exports 6,917 8,820 27.5% 11,491 30.3%<br />
Branded 1,500 2,010 34.0% 2,833 41.0%<br />
Generics 5418 6811 25.7% 8659 27.1%<br />
Europe 3121 3410 9.2% 4203 23.3%<br />
America 1072 1401 30.6% 2455 75.3%<br />
Malaria tender 1224 2000 63.4% 2000 0.0%<br />
APIs 4778 5017 5.0% 5278 5.2%<br />
Domestic 1,443 1,515 5.0% 1,637 8.0%<br />
Exports 3,335 3,501 5.0% 3,641 4.0%<br />
Other In<strong>com</strong>e 166 0 - 0 -<br />
Total Sales 18,825 21,506 14.2% 25,567 18.9%<br />
EBITDA 3,598 4,276 18.9% 5,336 24.8%<br />
EBITDA margins 19.1 19.9 20.9<br />
APAT 2,294 2,760 20.4% 3,489 26.4%<br />
PAT margins 12.2 12.8 13.6<br />
EPS 18.4 22.2 20.4% 28.0 26.4%<br />
PE @CMP 13.6 11.3 8.9<br />
Emkay Research 17 November 2011 32
Financials<br />
In<strong>com</strong>e Statement Balance Sheet<br />
Ipca <strong>Lab</strong>oratories Confluence: Pharma; Pre-conference note<br />
Y/E, Mar (Rs. mn) FY10 FY11 FY12E FY13E Y/E, Mar (Rs. mn) FY10 FY11 FY12E FY13E<br />
Net Sales 15,596 18,825 21,506 25,567 Equity share capital 250 251 251 251<br />
Growth (%) 20.6 20.7 14.2 18.9 Reserves & surplus 8,398 10,265 12,651 15,767<br />
Expenditure 12,360 15,227 17,230 20,231 Net worth 8,649 10,516 12,902 16,019<br />
Raw Materials 6,456 7,764 8,585 10,048 Minority Interest 0 0 0 0<br />
SGA 3,697 4,800 5,570 6,530 Secured Loans 3,791 4,554 4,854 4,754<br />
Employee Cost 2,207 2,663 3,075 3,653 Unsecured Loans 754 754 954 954<br />
Other Exp 0 0 0 0 Loan Funds 4,545 5,308 5,808 5,708<br />
EBITDA 3,236 3,598 4,276 5,336 Net deferred tax liability 793 807 807 807<br />
Growth (%) 21.9 11.2 18.9 24.8 Total Liabilities 13,987 16,631 19,518 22,534<br />
EBITDA margin (%) 20.7 19.1 19.9 20.9<br />
Depreciation 467 558 618 760 Gross Block 8,812 9,884 12,384 14,384<br />
EBIT 2,768 3,040 3,658 4,576 Less: Depreciation 2,433 2,892 3,510 4,270<br />
EBIT margin (%) 17.7 16.1 17.0 17.9 Net block 6,379 6,992 8,874 10,114<br />
Other In<strong>com</strong>e 161 246 244 275 Capital work in progress 383 1,132 1,132 1,132<br />
Interest expenses 329 314 364 377 Investment 325 408 408 408<br />
PBT 2,663 3,407 3,539 4,473 Current Assets 8,992 10,593 12,256 14,490<br />
Tax 627 784 778 984 Inventories 3,802 4,664 5,355 6,297<br />
Effective tax rate (%) 23.6 23.0 22.0 22.0 Sundry debtors 3,880 4,644 5,355 6,297<br />
Adjusted PAT 2,009 2,299 2,760 3,489 Cash & bank balance 108 104 256 361<br />
(Profit)/loss from JV's/Ass/MI 18 5 0 0 Loans & advances 1,201 1,182 1,290 1,534<br />
Adjusted PAT after MI 1,991 2,294 2,760 3,489 Current liab & Prov 0 0 0 0<br />
Growth (%) 20.4 15.2 20.4 26.4 Current liabilities 2,091 2,494 3,152 3,609<br />
Net Margin (%) 12.8 12.2 12.8 13.6 Provisions 1,850 2,073 2,677 3,101<br />
E/O items 63 434 0 0 Net current assets 241 420 474 508<br />
Reported PAT 2,054 2,628 2,760 3,489 Misc. exp & Def. Assets 6,900 8,099 9,104 10,880<br />
Growth (%) 104.2 28.0 5.0 26.4 Total Assets 13,987 16,631 19,518 22,534<br />
Cash Flow Key Ratios<br />
Y/E, Mar (Rs. mn) FY10 FY11P FY12E FY13E Y/E, Mar FY10 FY11 FY12E FY13E<br />
PBT (Ex-Other in<strong>com</strong>e) 2,502 3,160 3,294 4,199 Profitability (%)<br />
Depreciation 467 558 618 760 EBITDA Margin 20.7 19.1 19.9 20.9<br />
Interest Provided 329 314 364 377 Net Margin 12.8 12.2 12.8 13.6<br />
Other Non-Cash items 0 0 0 0 ROCE 22.7 21.3 21.4 22.9<br />
Chg in working cap -1,664 -1,210 -788 -1,607 ROE 26.6 23.9 23.6 24.1<br />
Tax paid -485 -784 -778 -984 RoIC 22.9 21.5 22.3 23.8<br />
Operating Cashflow 1,149 2,039 2,710 2,744 Per Share Data (Rs)<br />
Capital expenditure -1,317 -1,920 -2,500 -2,000 EPS 16.0 18.4 22.2 28.0<br />
Free Cash Flow -167 119 210 744 CEPS 19.2 19.4 27.1 34.1<br />
Other in<strong>com</strong>e 161 246 244 275 BVPS 69.5 84.5 103.6 128.7<br />
Investments 86 -83 0 0 DPS 3.3 3.5 3.5 3.5<br />
Investing Cashflow -1,069 -1,757 -2,256 -1,725 Valuations (x)<br />
Equity Capital Raised 45 39 0 0 PER 15.6 13.6 11.3 8.9<br />
Loans Taken / (Repaid) -54 763 500 -100 P/CEPS 13.0 12.9 9.2 7.3<br />
Interest Paid -329 -314 -364 -377 P/BV 3.6 3.0 2.4 1.9<br />
Dividend paid (incl tax) -409 -437 -437 -437 EV / Sales 2.3 1.9 1.7 1.4<br />
In<strong>com</strong>e from investments 0 0 0 0 EV / EBITDA 11.0 10.1 8.6 6.9<br />
Others 662 -338 0 0 Dividend Yield (%) 1.3 1.4 1.4 1.4<br />
Financing Cashflow -86 -286 -301 -914 Gearing Ratio (x)<br />
Net chg in cash -5 -4 153 105 Net Debt/ Equity 0.5 0.5 0.4 0.3<br />
Opening cash position 113 108 104 256 Net Debt/EBIDTA 1.3 1.4 1.2 1.0<br />
Closing cash position 108 104 256 361 WC Cycle 159 155 152 153<br />
Emkay Research 17 November 2011 33
Notes<br />
Ipca <strong>Lab</strong>oratories Confluence: Pharma; Pre-conference note<br />
Emkay Research 17 November 2011 34
November 16, 2011<br />
Reco<br />
Buy<br />
CMP<br />
Rs211<br />
Previous Reco<br />
Buy<br />
Target Price<br />
Rs359<br />
EPS change FY12E/13E (%) NA<br />
Target Price change (%) NA<br />
Nifty 5,069<br />
Sensex 16,883<br />
Price Performance<br />
(%) 1M 3M 6M 12M<br />
Absolute 8 5 25 (31)<br />
Rel. to Nifty 9 5 35 (16)<br />
Source: Bloomberg<br />
Relative Price Chart<br />
325<br />
280<br />
235<br />
190<br />
145<br />
Rs<br />
100<br />
Nov-10 Jan-11 Mar-11 May-11 Jul-11 Sep-11<br />
Source: Bloomberg<br />
Jubilant Life Sciences (LHS) Rel to Nifty (RHS)<br />
Stock Details<br />
Sector Pharmaceuticals<br />
Bloomberg JOL@IN<br />
Equity Capital (Rs mn) 159<br />
Face Value(Rs) 1<br />
No of shares o/s (mn) 159<br />
52 Week H/L 310/148<br />
Market Cap (Rs bn/USD mn) 34/671<br />
Daily Avg Volume (No of sh) 180734<br />
Daily Avg Turnover (US$mn) 0.7<br />
Shareholding Pattern (%)<br />
%<br />
10<br />
-2<br />
-14<br />
-26<br />
-38<br />
-50<br />
Sep-11 Jun-11 Mar-11<br />
Promoters 48.9 47.2 47.2<br />
FII/NRI 28.6 30.4 30.2<br />
Institutions 2.1 2.0 2.7<br />
Private Corp 8.3 8.6 8.2<br />
Public 12.1 11.8 11.8<br />
Source: Capitaline<br />
Deepak Malik<br />
deepak.malik@emkayglobal.<strong>com</strong><br />
+91 22 6612 1257<br />
Ashish Thavkar<br />
ashish.thavkar@emkayglobal.<strong>com</strong><br />
+91 22 6612 1254<br />
Bhavita Nagrani<br />
bhavita.nagrani@emkayglobal.<strong>com</strong><br />
+91 22 6624 2486<br />
Jubilant Life Sciences<br />
Growth momentum continues<br />
� Business is getting back on growth trajectory and new<br />
capacity additions in H2FY12 will provide further impetus<br />
� Ramp-up in Cadista will also lead to top-line growth and<br />
EBITDA margin expansion<br />
� Going forward, new capacity additions in pyridine & vitamin<br />
business, momentum in Cadista and +ve impact of currency<br />
depreciation will boost the top-line and the bottom-line<br />
� Maintain Buy with a target price of Rs359 (10xFY13E<br />
EV/EBITDA)<br />
Long – term contracts signed in CMO and Pyridine business<br />
� US$80mn contract for Symtet - Jubilant Life has signed a long term supply<br />
agreement in Proprietary Products business for Symtet with a leading international<br />
Life Sciences <strong>com</strong>pany. The total contract is valued at over US$ 80 mn to be<br />
supplied in 3 years starting from Q1FY13.<br />
� US$70mn contract in CMO business - Jubilant’s North American subsidiary,<br />
Jubilant HollisterStier, has entered into a multi year contract with a leading US<br />
pharma <strong>com</strong>pany to manufacture a prominent over the counter (OTC) women health<br />
and personal care product at its Montreal facility. This contract spans for a period of<br />
over 4 years with a possibility of extension for another 2 years for a higher quantity.<br />
The production of the product has already started in Sept’ 2011.<br />
Higher leverage remains a concern<br />
� Debt has increased from Rs32.8bn in Q1’12 to Rs36.2bn in Q2’12 – an increase of<br />
Rs3.4bn. This was mainly due to MTM on foreign currency loans of US$414mn.<br />
Average cost of Re debt (Rs15.9bn) has gone up to 11.5% from 9.5% in Q1’12<br />
Growth drivers going forward<br />
� Jubilant has set up a 10,000 mt plant for Vitamin B3 (Niacin/ Niacinamide) and has<br />
<strong>com</strong>menced trial batches in Q2’11. It is the largest producers of Beta-picoline, which<br />
is the key raw material used for production of Niacin/Niacinamide. Cost advantage<br />
owing to scale, vertical integration in Beta picoline and tax incentives (as this plant is<br />
set up in an SEZ in Gujarat) should help it to gain market share.<br />
� <strong>Company</strong> is further increasing its Pyridine capacity by 20%, which will <strong>com</strong>e on<br />
stream in H2FY12. This will help the <strong>com</strong>pany in backward integration for Symtet and<br />
Vitamn B3 production<br />
� Commissioning of Symtet plant by Q1FY13 for which the <strong>com</strong>pany has already<br />
signed the long term supply contract with a leading international life science co.<br />
Valuations<br />
We expect Jubilant to report 12% revenue growth in FY12 and 20% growth in FY13. We<br />
expect EBIDTA margins to improve from 16.1% in FY11 to 19.1% in FY12 and 19.3% in<br />
FY13. Earnings will grow by 21% CAGR over FY11-13E. We value the <strong>com</strong>pany at 10x<br />
FY13 EV/EBITDA with a target price of Rs359 and BUY rating. At CMP, the stock trades<br />
at 12xFY12E EPS of Rs17.7 and 8XFY13E EPS of Rs25<br />
Financials Rs mn<br />
YE- Net EBITDA EPS EPS RoE EV/<br />
Mar Sales (Core) (%) APAT (Rs) % chg (%) P/E EBITDA P/BV<br />
FY10 33,686 8,064 23.9 4,348 27.4 22.0 22.9 7.7 7.0 1.5<br />
FY11 34,420 5,541 16.1 2,711 17.1 (37.6) 10.3 12.4 12.0 1.5<br />
FY12E 38,505 7,368 19.1 2,810 17.7 3.6 12.7 11.9 9.2 1.5<br />
FY13E 46,325 8,919 19.3 3,967 25.0 41.2 16.6 8.4 7.5 1.3<br />
Emkay Global Financial Services Ltd 35<br />
<strong>Company</strong> <strong>Update</strong>
Jubilant Life Sciences Confluence: Pharma; Pre-conference note<br />
Key Financials – Quarterly Rs mn<br />
Rs mn Q1FY11 Q2FY11 Q4FY11 Q1FY12 Q2FY12 YoY (%) QoQ (%) YTD'12 YTD'11 YoY (%)<br />
Revenue 8,186 8,603 8,944 9,485 10,501 22.1 10.7 19,986 16,789 19.0<br />
Expenditure 6,771 7,121 7,620 7,623 8,120 14.0 6.5 15,743 13,892 13.3<br />
as % of sales 82.7 82.8 85.2 80.4 77.3 - - 78.8 82.7 -<br />
Consumption of RM 3,655 3,786 3,901 4,183 4,380 15.7 4.7 8,564 7,441 15.1<br />
as % of sales 44.6 44.0 43.6 44.1 41.7 - - 42.8 44.3 -<br />
Employee Cost 1,770 1,808 1,830 1,898 2,060 13.9 8.6 3,958 3,578 10.6<br />
as % of sales 21.6 21.0 20.5 20.0 19.6 - - 19.8 21.3 -<br />
Other expenditure 1,347 1,527 1,890 1,542 1,680 10.0 9.0 3,221 2,873 12.1<br />
as % of sales 16.4 17.7 21.1 16.3 16.0 - - 16.1 17.1 -<br />
EBITDA 1,415 1,482 1,323 1,862 2,381 60.6 27.8 4,243 2,897 46.4<br />
Depreciation 484 493 331 498 508 3.1 2.1 1,006 977 3.0<br />
EBIT 931 990 992 1,364 1,873 89.2 37.2 3,237 1,921 68.5<br />
Other In<strong>com</strong>e 23 42 47 37 34 - (7.4) 71 66 7.6<br />
Interest 195 248 323 434 497 100.7 14.5 931 442 110.4<br />
PBT 759 785 716 967 1,410 79.7 45.7 2,377 1,544 54.0<br />
Total Tax 58 26 (54) 152 93 257.7 (38.7) 245 84 191.9<br />
Adjusted PAT 702 759 770 816 1,317 73.6 61.4 2,132 1,460 46.0<br />
(Profit)/loss from JV's/Ass/MI (10.7) (5.2) (1.1) 2.7 97.1 - - 99.8 (15.9) -<br />
APAT after MI 690 763 771 806 1,179 54.6 46.3 1,985 1,453 36.6<br />
Extra ordinary items -208 -29 154 -42 -426 - - -468 -237 -<br />
Reported PAT 504 735 616 771 794 8.0 2.9 1,565 1,239 26.3<br />
Reported EPS 3.2 4.6 3.9 4.8 5.0 8.0 2.9 9.8 7.8 26.3<br />
Margins (%) (bps) (bps) (bps)<br />
EBIDTA 17.3 17.2 14.8 19.6 22.7 544 304 21.2 17.3 397<br />
EBIT 11.4 11.5 11.1 14.4 17.8 633 345 16.2 11.4 476<br />
EBT 9.3 9.1 8.0 10.2 13.4 431 323 11.9 9.2 270<br />
PAT 8.4 8.9 8.6 8.5 11.2 237 273 9.9 8.7 128<br />
Effective Tax rate 7.6 3.3 (7.5) 15.7 6.6 328 (908) 10.3 5.4 486<br />
Revenue Break-up<br />
Rs mn Q1FY11 Q2FY11 Q4FY11 Q1FY12 Q2FY12 YoY (%) QoQ (%) YTD'12 YTD'11 YoY (%)<br />
Life Sciences Ingredients 5230 5560 5730 6080 5920 6.5% -2.6% 12000 10790 11.2<br />
Generics 980 1100 1250 1310 2410 119.1% 84.0% 3720 2080 78.8<br />
Life Sciences Products 6210 6660 6980 7390 8330 25.1% 12.7% 15720 12870 22.1<br />
CMO 1400 1390 1330 1510 1540 10.8% 2.0% 3050 2790 9.3<br />
DDDS 540 510 560 520 580 13.9% 11.6% 1100 1050 4.8<br />
Others 30 30 30 30 30 2.1% 1.5% 60 60 1.1<br />
Life Sciences Services 1970 1929 1920 2060 2151 11.5% 4.4% 4211 3899 8.0<br />
Total Sales 8180 8589.4 8900 9450 10481 22.0% 10.9% 19931 16769 18.9<br />
Emkay Research 16 November 2011 36
Financial Snapshot<br />
Jubilant Life Sciences Confluence: Pharma; Pre-conference note<br />
Rs mn FY11 FY12E YoY % FY13E YoY %<br />
1. Products 2684 3009 12.1 3616 20.2<br />
i) Ingredients 2233 2494 11.7 3023 21.2<br />
a) Proprietary Prod. & Excl. Synthesis 949 1043.9 10.0 1351 29.4<br />
b) Nutritional Ingredients 192 230.4 20.0 311 35.0<br />
c) Life Science Chemicals 755 815 8.0 856 5.0<br />
d) API 337 404 20.0 505 25.0<br />
ii) Generics(Specialty Pharma) 452 515 14.1 593 15.1<br />
a) Radio Pharmaceuticals 129 142 10.0 156 10.0<br />
b) Allergenic Extracts 120 120 0.0 120 0.0<br />
a) Dosage Forms 203 254 25.0 317 25.0<br />
2. Services 749 833 11.2 1008 21.0<br />
i) CMO 527 587 11.5 724 23.4<br />
ii) DDDS 210 231 10.0 266 15.0<br />
iii) Healthcare 12 14 20.0 17 20.0<br />
Total ( 1 + 2 ) 3433 3842 11.9 4624 20.4<br />
EBITDA 5,541 7,368 33.0 8,919 21.1<br />
EBITDA % 16.1 19.1 19.3<br />
PAT 2,711 2,810 3.6 3,967 41.2<br />
PAT % 7.9 7.3 8.6<br />
EPS 17.1 17.7 3.6% 25.0 41.2%<br />
PE @ CMP 12.4 11.9 8.4<br />
Emkay Research 16 November 2011 37
Financials<br />
In<strong>com</strong>e Statement Balance Sheet<br />
Jubilant Life Sciences Confluence: Pharma; Pre-conference note<br />
Y/E, Mar (Rs. mn) FY10 FY11 FY12E FY13E Y/E, Mar (Rs. mn) FY10 FY11 FY12E FY13E<br />
Net Sales 33,686 34,420 38,505 46,325 Equity share capital 159 159 159 159<br />
Growth (%) 13.4 2.2 11.9 20.3 Reserves & surplus 21,855 21,563 21,449 25,098<br />
Expenditure 25,622 28,879 31,137 37,405 Net worth 22,013 21,723 21,609 25,257<br />
Raw Materials 15,853 15,426 16,884 20,067 Minority Interest 379 418 418 418<br />
Manufacturing exp -267 3,550 4,575 4,850 Secured Loans 23,117 32,908 34,108 33,308<br />
Employee Cost 6,453 7,184 7,338 9,016 Unsecured Loans 8,610 6,337 0 0<br />
Other Exp 3,583 2,719 2,340 3,473 Loan Funds 31,727 39,245 34,108 33,308<br />
EBITDA 8,064 5,541 7,368 8,919 Net deferred tax liability 1,924 1,712 1,712 1,712<br />
Growth (%) 31.2 -31.3 33.0 21.1 Total Liabilities 56,044 63,098 57,847 60,695<br />
EBITDA margin (%) 23.9 16.1 19.1 19.3<br />
Depreciation 1,247 1,800 2,100 2,200 Gross Block 48,453 51,633 63,410 66,410<br />
EBIT 6,817 3,741 5,268 6,719 Less: Depreciation 10,264 11,722 13,822 16,022<br />
EBIT margin (%) 20.2 10.9 13.7 14.5 Net block 38,189 39,911 49,588 50,388<br />
Other In<strong>com</strong>e 0 130 0 0 Capital work in progress 5,056 6,778 0 0<br />
Interest expenses 1,505 1,051 1,842 1,882 Investment 2,564 328 328 328<br />
PBT 5,312 2,820 3,426 4,838 Current Assets 22,315 28,228 19,829 24,591<br />
Tax 959 134 617 871 Inventories 6,910 6,913 7,191 9,784<br />
Effective tax rate (%) 19.3 5.6 18.0 18.0 Sundry debtors 5,186 5,205 5,321 6,840<br />
Adjusted PAT 4,352 2,686 2,810 3,967 Cash & bank balance 5,037 10,457 1,191 1,263<br />
(Profit)/loss from JV's/Ass/MI -5 -25 0 0 Loans & advances 5,183 5,654 6,126 6,704<br />
Adjusted PAT after MI 4,348 2,711 2,810 3,967 Other current assets 0 0 0 0<br />
Growth (%) 31.3 -37.6 3.6 41.2 Current lia & Prov 12,201 12,145 11,897 14,611<br />
Net Margin (%) 12.9 7.9 7.3 8.6 Current liabilities 10,371 10,466 9,400 11,375<br />
E/O items -329 -414 0 0 Provisions 1,831 1,679 2,497 3,237<br />
Reported PAT 4,019 2,297 2,810 3,967 Net current assets 10,114 16,082 7,932 9,980<br />
Growth (%) 41.9 -42.8 22.3 41.2 Misc. exp & Def. Assets 121 0 0 0<br />
Cash Flow Key Ratios<br />
Total Assets 56,044 63,098 57,847 60,695<br />
Y/E, Mar (Rs. mn) FY10 FY11 FY12E FY13E Y/E, Mar FY10 FY11 FY12E FY13E<br />
PBT (Ex-Other in<strong>com</strong>e) 5,485 2,819 3,426 4,838 Profitability (%)<br />
Depreciation 1,247 1,800 2,100 2,200 EBITDA Margin 23.9 16.1 19.1 19.3<br />
Interest Provided 1,505 1,051 1,842 1,882 Net Margin 12.9 7.9 7.3 8.6<br />
Other Non-Cash items 0 0 0 0 ROCE 15.0 7.2 9.2 11.3<br />
Chg in working cap -528 -548 -1,115 -1,976 ROE 22.9 10.3 12.7 16.6<br />
Tax paid -959 -134 -617 -871 RoIC 20.4 10.1 11.0 11.6<br />
Operating Cashflow 6,750 4,987 5,637 6,072 Per Share Data (Rs)<br />
Capital expenditure -2,011 -4,980 -5,000 -3,000 EPS 27.4 17.1 17.7 25.0<br />
Free Cash Flow 4,739 7 637 3,072 CEPS 37.3 31.0 30.9 38.8<br />
Other in<strong>com</strong>e 0 0 0 0 BVPS 139.5 139.5 138.7 161.7<br />
Investments 149 2,237 0 0 DPS 2.1 2.0 2.0 2.0<br />
Investing Cashflow -1,861 -2,744 -5,000 -3,000 Valuations (x)<br />
Equity Capital Raised 3,598 -1,284 -2,605 0 PER 7.7 12.4 11.9 8.4<br />
Loans Taken / (Repaid) -7,691 7,518 -5,137 -800 P/CEPS 5.7 6.8 6.8 5.4<br />
Interest Paid -1,505 -1,051 -1,842 -1,882 P/BV 1.5 1.5 1.5 1.3<br />
Dividend paid (incl tax) -279 -319 -319 -319 EV / Sales 1.7 1.9 1.8 1.4<br />
In<strong>com</strong>e from investments 0 0 0 0 EV / EBITDA 7.0 12.0 9.2 7.5<br />
Others 2,208 -1,688 0 0 Dividend Yield (%) 1.0 1.0 1.0 1.0<br />
Financing Cashflow -3,668 3,176 -9,902 -3,001 Gearing Ratio (x)<br />
Net chg in cash 1,220 5,420 -9,266 72 Net Debt/ Equity 1.2 1.3 1.5 1.3<br />
Opening cash position 3,817 5,037 10,457 1,191 Net Debt/EBIDTA 3.3 5.2 4.5 3.6<br />
Closing cash position 5,037 10,457 1,191 1,263 Working Cap Cycle (days) 75 77 88 94<br />
Emkay Research 16 November 2011 38
Notes<br />
Jubilant Life Sciences Confluence: Pharma; Pre-conference note<br />
Emkay Research 16 November 2011 39
Notes<br />
Jubilant Life Sciences Confluence: Pharma; Pre-conference note<br />
Emkay Research 16 November 2011 40
November 16, 2011<br />
Reco<br />
Accumulate<br />
CMP<br />
Rs505<br />
Previous Reco<br />
Accumulate<br />
Target Price<br />
Rs554<br />
EPS change FY12E/13E (%) NA<br />
Target Price change (%) 10<br />
Nifty 5,069<br />
Sensex 16,883<br />
Price Performance<br />
(%) 1M 3M 6M 12M<br />
Absolute 5 6 14 9<br />
Rel. to Nifty 7 6 23 32<br />
Source: Bloomberg<br />
Relative Price Chart<br />
550<br />
510<br />
470<br />
430<br />
390<br />
Rs<br />
350<br />
Nov-10 Jan-11 Mar-11 May-11 Jul-11 Sep-11<br />
Source: Bloomberg<br />
Sun Pharma (LHS) Rel to Nifty (RHS)<br />
Stock Details<br />
Sector Pharmaceuticals<br />
Bloomberg SUNP@IN<br />
Equity Capital (Rs mn) 1030<br />
Face Value(Rs) 1<br />
No of shares o/s (mn) 1030<br />
52 Week H/L 538/392<br />
Market Cap (Rs bn/USD mn)<br />
%<br />
40<br />
30<br />
20<br />
10<br />
0<br />
-10<br />
520/10,261<br />
Daily Avg Volume (No of sh) 1067005<br />
Daily Avg Turnover (US$mn) 10.2<br />
Shareholding Pattern (%)<br />
Sep-11 Jun-11 Mar-11<br />
Promoters 63.7 63.7 63.7<br />
FII/NRI 19.1 18.6 18.5<br />
Institutions 6.5 7.2 7.1<br />
Private Corp 5.1 5.1 5.1<br />
Public 5.6 5.5 5.6<br />
Source: Capitaline<br />
Deepak Malik<br />
Deepak.malik@emkayglobal.<strong>com</strong><br />
+91 22 6612 1257<br />
Ashish Thavkar<br />
ashish.thavkar@emkayglobal.<strong>com</strong><br />
+91 22 6612 1254<br />
Bhavita Nagrani<br />
bhavita.nagrani@emkayglobal.<strong>com</strong><br />
+91 22 6624 2486<br />
Sun Pharma<br />
Taro spearheads the growth<br />
� Domestic formulation to grow at 17% CAGR on back of new<br />
launches in FY12 & leadership in chronic therapies<br />
(psychiatrists, neuro, cardio, ophtho and ortho)<br />
� US business to show robust growth of CAGR of 30.5%, on the<br />
back of Para IV opportunities like Taxotere, Consolidation of<br />
Taro and launch of recently approved 15 ANDAs in H1FY12<br />
� Going forward - Management has maintained its guidance of<br />
28-30% growth in top-line for FY12<br />
� With strong traction from Taro and a stable domestic<br />
business – we maintain Accumulate rating with a target price<br />
of Rs554<br />
Domestic business – Focus on Chronic Therapies<br />
Domestic formulation (contributes ~40%) is expected to grow at 18% CAGR (FY11-<br />
FY13) on back of new sustained product launches and leadership in chronic therapy.<br />
Under the Sun-MSD JV - Sitagliptin Sitagliptin + Metformin <strong>com</strong>bination have been<br />
launched. The <strong>com</strong>pany also launched a dry powder inhaler for the asthma patients<br />
North America - Revenues from Taxotere and Growth in Taro are the Key<br />
<strong>Dr</strong>ivers<br />
� Sun Pharma launched Taxotere generics during the current year. We expect sales<br />
of ~ $40m for full year for SUNP. (Assuming current generic market size of $200m<br />
with 4 generic players) Large part of US generics growth is dependent upon the<br />
revenue from this product.<br />
� Integration of Taro’s US business would add a well-established portfolio of<br />
dermatology and pediatric products to Sun’s portfolio which do not overlap with Sun’s<br />
core portfolio. Any developments for Taro will add additional upside to our<br />
projections.<br />
� Further, if there is a USFDA clearance to Caraco (Warning letter given in 2008) there<br />
will be further upside in our projections. Historically Sun has been able to resolve the<br />
warning letters issued to its Cranbury facility and Taro’s Canadian facility. These<br />
instances vindicates sooner clearance of Caraco facility as well.<br />
� Sun has 388 ANDA filings (including 12 ANDAs filed in H1FY12; also includes<br />
Cardizem CD 360mg strength where Sun is the only player in US$75mn market) till<br />
date with 150 ANDAs pending for approval, highest number of filings by an Indian<br />
pharma <strong>com</strong>pany. Management has guided for 25 ANDA filings during FY12<br />
Valuation<br />
We expect Sun Pharma to report 28% growth in revenues in FY12E and 24% growth in<br />
FY13E. EBIDTA margins are expected to decrease from 34.8% in FY11 to 34.5% in<br />
FY12E and 37.4% in FY13E. Earnings will grow by 27% CAGR over FY11-13E. We<br />
revise our target price to Rs554 (22x FY13E core earnings of Rs23). At CMP, the stock<br />
trades at 23x FY12E and 18x FY13E EPS. Maintain Accumulate.<br />
Financials Rs mn<br />
YE- Net EBITDA EPS EPS RoE EV/<br />
Mar Sales (Core) (%) APAT (Rs) % chg (%) P/E EBITDA P/BV<br />
FY10 40,103 13,662 34.1 12,590 12.2 (30.7) 18.1 41.5 37.9 6.7<br />
FY11 57,214 19,890 34.8 18,386 17.8 46.0 22.2 28.4 25.3 5.5<br />
FY12E 73,135 25,204 34.5 22,365 21.6 21.6 22.6 23.3 19.9 4.6<br />
FY13E 90,360 33,836 37.4 29,533 28.5 32.0 24.8 17.7 14.6 3.8<br />
Emkay Global Financial Services Ltd 41<br />
<strong>Company</strong> <strong>Update</strong>
Quarterly break-up<br />
Sun Pharma Confluence: Pharma; Pre-conference note<br />
Rs mn Q2FY11 Q3FY11 Q4FY11 Q1FY12 Q2FY12 YoY (%) QoQ (%) YTD12 YTD11 YoY (%)<br />
Revenue 13,701 16,011 14,633 16,357 18,946 38 16 35,303 27,351 29<br />
Expenditure 9,030 11,605 10,197 10,883 11,106 23 2 21,988 16,521 33<br />
as % of sales 65.9 72.5 69.7 66.5 58.6 62.3 60.4<br />
Consumption of RM 3,794 4,324 3,132 4,071 3,639 -4 -11 7,709 7,151 8<br />
as % of sales 27.7 27.0 21.4 24.9 19.2 21.8 26.1<br />
Employee Cost 1,456 2,754 2,540 2,786 2,727 87 -2 5,513 2,702 104<br />
as % of sales 10.6 17.2 17.4 17.0 14.4 15.6 9.9<br />
Other expenditure 3,780 4,528 4,525 4,026 4,740 25 18 8,766 6,668 31<br />
as % of sales 27.6 28.3 30.9 24.6 25.0 24.8 24.4<br />
EBITDA 4,670 4,405 4,436 5,474 7,840 68 43 13,315 10,830 23<br />
Depreciation 352 805 482 647 668 90 3 1,315 754 74<br />
EBIT 4,319 3,601 3,954 4,827 7,173 66 49 12,000 10,076 19<br />
Other In<strong>com</strong>e 924 580 1,108 969 463 -50 -52 1,431 1,039 38<br />
Non-recurring in<strong>com</strong>e 0 0 0 0 720 - - 0 0<br />
PBT 5,242 4,181 5,062 5,796 7,635 46 32 13,431 11,115 21<br />
Total Tax 172 545 22 143 1,281 644 798 1,424 269 429<br />
Adjusted PAT 5,070 3,636 5,039 5,653 6,354 25 12 12,007 10,846 11<br />
Minority Interest 33.7 134.4 612 643 1097 - - 1740 167 943<br />
APAT after MI 5,037 3,502 4,427 5,010 5,257 4 5 10,267 10,679 -4<br />
Extra ordinary items 0 0 0 0 0 - - 0 0 -<br />
Reported PAT 5,037 3,502 4,427 5,010 5,977 19 19 10,987 10,679 3<br />
Reported EPS 4.9 3.4 4.3 4.8 5.8 19 19 10.6 10.3 3<br />
Margins (%) (bps) (bps) (bps)<br />
EBIDTA 34.1 27.5 30.3 33.5 41.4 729 791 37.7 39.6 (188)<br />
EBIT 31.5 22.5 27.0 29.5 37.9 634 835 34.0 36.8 (285)<br />
EBT 38.3 26.1 34.6 35.4 40.3 204 487 38.0 40.6 (259)<br />
PAT 36.8 21.9 30.3 30.6 31.5 (521) 92 29.1 39.0 (996)<br />
Effective Tax rate 3.3 13.0 0.4 2.5 16.8 1,349 1,432 10.6 2.4 818<br />
Quarterly Revenue Break-up<br />
Rs mn Q2FY11 Q3FY11 Q4FY11 Q1FY12 Q2FY12 Gr. YoY Gr. QoQ<br />
Domestic 6105 6403 5887 6385 7046 15 10<br />
US 4511 4833 4795 6220 7991 77 28<br />
FTF 1688 0 0 0 0 - -<br />
Caraco 1372 1829 1575 2303 3086 125 34<br />
Taro - US 1452 3004 3220 3916 4905 238 25<br />
RoW 1388 3828 2966 2521 2567 85 2<br />
Taro - RoW 363 1617 1734 1230 1305 260 6<br />
Sun – RoW * 1025 2211 1232 1291 1262 23 -2<br />
Formulations 12004 15064 13648 15126 17604 47 16<br />
API 1491 1157 1167 1476 1603 8 9<br />
Others 33 4 29 2 4 -87 106<br />
Total Sales 13527 16225 14844 16604 19211 42 16<br />
* We have assumed Taro’s RoW sales at US$29mn and then calculated Taro’s & Caraco’s US sales.<br />
Emkay Research 16 November 2011 42
Sun Pharma – Domestic Metrics<br />
Sun Pharma Confluence: Pharma; Pre-conference note<br />
Sun Pharma - Therapeutic growth Field Force Productivity<br />
Rs Cr<br />
FY11 %<br />
Contribution<br />
MAT<br />
Sep'11<br />
MAT<br />
Sep'10<br />
% YoY<br />
Gr.<br />
CNS 27.5 709.3 601.6 17.9<br />
CVS 19.5 503.5 408.4 23.3<br />
Gastro 13.9 358.8 283.3 26.7<br />
Gynecology 8.2 212.4 178.8 18.8<br />
Pain Mgmt 5.2 133.6 100.5 33.0<br />
Respiratory 4.2 108.1 93.9 15.1<br />
Ophthalmology 4.7 120.3 104.7 14.9<br />
Anti-Neoplastics 1.6 41.9 33.6 24.8<br />
Anti-diabetic 9.3 239.9 184.3 30.1<br />
Others 5.8 150.3 117.0 28.5<br />
Acute 40.8 1050.7 851.9 23.3<br />
Chronic 59.2 1527.3 1254.2 21.8<br />
Total Sales 100.0 2578.1 2106.1 22.4<br />
x<br />
Sep’11 MAT growth for Sun Pharma has been above industry rate at<br />
22%<br />
� Acute segment which contributes 41% grew by 23%<br />
� Chronic segment which contributes 59% grew by 22%<br />
Emkay Research 16 November 2011 43<br />
3,000<br />
2,000<br />
1,000<br />
Growth drivers - Volume/ Price/ New launches Top 10 brand performance<br />
Total Gr. 22.5%<br />
6.50<br />
2.00<br />
13.80<br />
Total Gr. 14.4%<br />
4.3<br />
2.5<br />
7.6<br />
Sun Industry<br />
Vol Gr. Price Gr. New launches<br />
� Sun Pharma’s out-performance was due to strong volume uptake in<br />
existing brands coupled with price increase and 6.5% growth from new<br />
launches during MAT Sep’11<br />
Source: AIOCD, Emkay Research<br />
0<br />
FY08 FY09 FY10 FY11<br />
Field force Productivity<br />
� Sun Pharma has added just 100 people to its field force during<br />
FY11<br />
� Higher MR productivity has resulted into industry out-performance<br />
� Sun has the highest MR productivity amongst its Indian peers<br />
Rs Cr Therapy<br />
MAT<br />
Sep'11<br />
MAT<br />
Sep'10<br />
9.0<br />
8.0<br />
7.0<br />
6.0<br />
% YoY<br />
Gr.<br />
Pantocid CNS 80.4 66.4 20.9<br />
Susten Gynaec 60.5 56.2 7.7<br />
Aztor CVS 60.1 50.0 20.3<br />
Glucored Anti-Diabeties 56.2 52.9 6.1<br />
Gemer Anti-Diabeties 53.6 40.5 32.2<br />
Pantocid dsr CNS 42.9 34.3 25.0<br />
Oxetol CNS 37.7 31.1 21.4<br />
Clopilet CVS 36.4 28.9 25.7<br />
Levipil CNS 34.7 19.0 82.1<br />
Cardivas CVS 33.4 28.3 17.7<br />
Total 495.7 407.8 21.6<br />
� Top 10 brands contribute 19% to the domestic formulation sales<br />
� Pantocid,, Oxetol, Gemer, & Oxetol clocked 20%+ growth during the<br />
period leading to 22% growth from the top 10 brands
Sun Pharma Confluence: Pharma; Pre-conference note<br />
Financial Snapshot<br />
FY11 YoY % FY12E YoY % FY13E YoY %<br />
A. Formulations ( 1 + 2 + 3 ) 52783 49.9 66923 26.8 83251 24.4<br />
1. Domestic 23801 30.1 27440 15.3 32350 17.9<br />
2. US ( a + b ) 23954 117.5 33197 38.6 43043 29.7<br />
a. Taro 10062 - 22031 119.0 22585 2.5<br />
b. Caraco 13892 26.1 11166 -19.6 20458 83.2<br />
- Base 6148 47.0 8119 32.1 8886 9.4<br />
- FTF 7743 - 3046 - 11572 -<br />
3. RoW 5029 -14.7 6286 25.0 7858 25.0<br />
B. API 5212 -5.1 6119 17.4 7221 18.0<br />
Domestic 1130 10.6 1220 8.0 1342 10.0<br />
Exports 4082 -8.7 4899 20.0 5879 20.0<br />
C. Others 70 -9.4 93 32.5 95 2.0<br />
Consolidated Revenues ( A + B + C ) 58066 42.4 73135 26.0 90567 23.8<br />
FTF 7743 13.4 3046 -60.7 11572 279.9<br />
Taro 10062 - 22031 119.0 22585 2.5<br />
Base (Exlc - FTF) 40261 18.6 48058 19.4 56410 17.4<br />
Reported EBITDA 19,890 45.6 25,204 26.7 33,836 34.2<br />
EBITDA % 34.8% 34.5 37.4<br />
- FTF EBITDA 5420 - 1791 - 5875 -<br />
- Taro EBITDA 2516 - 6389 154.0 6775 6.0<br />
- Sun Base EBITDA 11954 33.0 17023 42.4 21186 24.5<br />
Total Base EBITDA 14,470 61.0 23,412 61.8 27,961 19.4<br />
EBITDA % - Base Business 28.8% 33.4 35.4<br />
Reported PAT 18,386 46.0 22,365 21.6 29,533 32.0<br />
PAT % 32.1% 30.6 32.7<br />
- FTF PAT 4987 - 1648 - 5405 -<br />
- Taro PAT 2365 - 6169 160.9 6324 2.5<br />
- Sun PAT 11034 21.4 14548 31.8 17804 22.4<br />
Total Base PAT 13399 47.5 20717 54.6 24128 16.5<br />
PAT % - Base Business 26.6% 29.6 30.5<br />
Reported EPS 17.8 46.0 21.6 21.6 28.5 32.0<br />
- FTF EPS 4.8 - 1.6 - 5.2 -<br />
- Taro EPS 2.3 - 6.0 160.9 6.1 2.5<br />
- Sun EPS 10.7 21.4 14.0 31.8 17.2 22.4<br />
EPS - Base Business 12.9 47.5 20.0 54.6 23.3 16.5<br />
PE @ CMP 28.4 23.3 17.7<br />
Base PE @ CMP 39.0 25.2 21.6<br />
Emkay Research 16 November 2011 44
Para-IV Opportunities<br />
Product Generic Name<br />
Sun Pharma Confluence: Pharma; Pre-conference note<br />
Sales FY12<br />
($ mn)<br />
EPS<br />
2012<br />
Sales FY13 ($<br />
Emkay Research 16 November 2011 45<br />
mn)<br />
EPS<br />
2013<br />
Expected<br />
Launch<br />
Date<br />
Branded<br />
Sales<br />
($ mn)<br />
Exclusivity<br />
Gemzar Gemcitabine 3.6 0.1 0.0 0.0 Launched 634 10+<br />
Taxotere Docetaxel 40.3 1.0 20.2 0.5 Launched 1100 5<br />
Uroxatral Alfuzosin 6.3 0.2 0.0 0.0 Launched 250 8<br />
Eloxatin Oxaliplatin 0.0 0.0 60.0 1.7 Aug-12 1500 7<br />
Boniva<br />
Injectible<br />
Gabitril<br />
(2/4mg)<br />
Stalevo<br />
Ibandronate Sodium 0.0 0.0 3.6 0.2 Aug-12 71 5+<br />
Tiagabine HCL 1.1 0.0 0.0 0.0 Oct-12 18 Unshared<br />
Carbidopa, Entacapone,<br />
Levodopa<br />
0.0 0.0 28.7 0.8 Apr-13 205 Unshared<br />
Lexapro Escitalopram Oxalate 0.0 0.0 11.5 0.3 FY13 2300 4+<br />
Plavix Clopidogrel Bisulfate 0.0 0.0 50.0 1.0 May-13 6666 7+<br />
Prandin Repaglinide 0.0 0.0 24.0 0.7 FY13 200 Unshared<br />
Exelon Rivastigmine 15.0 0.3 4.5 0.1 Launched 93 2+<br />
Total 66.2 1.6 202.4 5.2 13037
Financials<br />
In<strong>com</strong>e Statement Balance Sheet<br />
Sun Pharma Confluence: Pharma; Pre-conference note<br />
Y/E, Mar (Rs. mn) FY10 FY11 FY12E FY13E Y/E, Mar (Rs. mn) FY10 FY11P FY12E FY13E<br />
Net Sales 40,103 57,214 73,135 90,360 Equity share capital 1,036 1,036 1,036 1,036<br />
Growth (%) -4.2 42.7 27.8 23.6 Reserves & surplus 77,254 94,173 112,406 136,483<br />
Expenditure 26,441 37,324 47,932 56,524 Net worth 78,289 95,208 113,442 137,519<br />
Raw Materials 10,977 14,607 19,399 24,578 Minority Interest 1,932 8,472 9,649 11,203<br />
SGA 9,146 11,695 15,197 16,925 Secured Loans 479 1,179 679 179<br />
Employee Cost 4,008 7,996 9,115 10,482 Unsecured Loans 1,233 3,077 2,577 2,077<br />
Other Exp 2,311 3,027 4,221 4,539 Loan Funds 1,712 4,256 3,256 2,256<br />
EBITDA 13,662 19,890 25,204 33,836 Net deferred tax liability -890 -3,652 -3,652 -3,652<br />
Growth (%) -26.8 45.6 26.7 34.2 Total Liabilities 81,042 104,284 122,694 147,325<br />
EBITDA margin (%) 34.1 34.8 34.5 37.4<br />
Depreciation 1,533 2,041 2,557 2,871 Gross Block 27,401 43,947 48,447 53,447<br />
EBIT 12,129 17,850 22,647 30,965 Less: Depreciation 8,013 10,287 12,844 15,715<br />
EBIT margin (%) 30.2 31.2 31.0 34.3 Net block 19,388 33,660 35,603 37,732<br />
Other In<strong>com</strong>e 1,686 2,733 2,942 2,825 Capital work in progress 1,448 2,000 2,000 1,000<br />
Interest expenses 0 0 0 0 Investment 30,664 22,310 22,310 22,310<br />
PBT 14,148 20,583 25,589 33,790 Current Assets 37,121 60,622 79,507 105,306<br />
Tax 679 1,284 2,047 2,703 Inventories 10,739 14,794 18,284 26,204<br />
Effective tax rate (%) 4.8 6.2 8.0 8.0 Sundry debtors 11,748 11,716 24,135 32,529<br />
Adjusted PAT 13,552 17,472 21,188 27,978 Cash & bank balance 6,073 22,387 22,388 29,263<br />
(Profit)/loss from JV's/Ass/MI 962 -913 -1,177 -1,554 Loans & advances 8,562 11,726 14,701 17,310<br />
Adjusted PAT after MI 12,590 18,386 22,365 29,533 Other current assets 0 0 0 0<br />
Growth (%) -30.7 46.0 21.6 32.0 Current liab & Prov 7,579 14,308 16,726 19,023<br />
Net Margin (%) 31.4 32.1 30.6 32.7 Current liabilities 4,095 9,203 10,783 12,148<br />
E/O items 334 0 0 0 Provisions 3,484 5,105 5,943 6,875<br />
Reported PAT 13,511 18,386 22,365 29,533 Net current assets 29,542 46,314 62,781 86,283<br />
Growth (%) -25.7 36.1 21.6 32.0 Total Assets 0 0 0 0<br />
Cash Flow Key Ratios<br />
Y/E, Mar (Rs. mn) FY10 FY11P FY12E FY13E Y/E, Mar FY10 FY11P FY12E FY13E<br />
PBT (Ex-Other in<strong>com</strong>e) 12,462 17,850 22,647 30,965 Profitability (%)<br />
Depreciation 1,533 2,041 2,557 2,871 EBITDA Margin 34.1 34.8 34.5 37.4<br />
Interest Provided 0 0 0 0 Net Margin 31.4 32.1 30.6 32.7<br />
Other Non-Cash items 0 0 0 0 ROCE 18 22 22 24<br />
Chg in working cap -4,675 -458 -16,466 -16,627 ROE 18 22 23 25<br />
Tax paid -1,106 -1,284 -2,047 -2,703 RoIC 29.9 34.0 32.1 34.8<br />
Operating Cashflow 8,214 18,147 6,691 14,506 Per Share Data (Rs)<br />
Capital expenditure -2,920 -13,205 -4,500 -4,000 EPS 12.2 17.8 21.6 28.5<br />
Free Cash Flow 5,295 4,943 2,191 10,506 CEPS 13.3 19.7 24.1 31.3<br />
Other in<strong>com</strong>e 1,686 2,733 2,942 2,825 BVPS 75.6 91.9 109.5 132.8<br />
Investments -12,069 8,354 0 0 DPS 3.2 4.7 5.4 6.2<br />
Investing Cashflow -13,302 -2,117 -1,558 -1,175 Valuations (x)<br />
Equity Capital Raised 0 0 0 0 PER 41.5 28.4 23.3 17.7<br />
Loans Taken / (Repaid) -77 2,544 -1,000 -1,000 P/CEPS 37.9 25.6 20.9 16.1<br />
Interest Paid 0 0 0 0 P/BV 6.7 5.5 4.6 3.8<br />
Dividend paid (incl tax) -3,321 -3,387 -4,132 -5,456 EV / Sales 12.9 8.8 6.9 5.5<br />
Others 0 0 0 0 EV / EBITDA 37.9 25.3 19.9 14.6<br />
Financing Cashflow -5,529 283 -5,132 -6,456 Dividend Yield (%) 0.6 0.9 1.1 1.2<br />
Net chg in cash -10,618 16,314 1 6,875 Gearing Ratio (x)<br />
Opening cash position 16,690 6,073 22,387 22,388 Net Debt/ Equity -0.1 -0.2 -0.2 -0.2<br />
Closing cash position 6,073 22,387 22,388 29,263 Net Debt/EBIDTA -0.3 -0.8 -0.7 -0.7<br />
Emkay Research 16 November 2011 46
Notes<br />
Sun Pharma Confluence: Pharma; Pre-conference note<br />
Emkay Research 16 November 2011 47
Notes<br />
Sun Pharma Confluence: Pharma; Pre-conference note<br />
Emkay Research 16 November 2011 48
November 17, 2011<br />
Reco<br />
Not Rated<br />
CMP<br />
Rs255<br />
Target Price<br />
NA<br />
EPS change FY11E/12E (%) NA<br />
Target Price change (%) NA<br />
Nifty 5,030<br />
Sensex 16,756<br />
Price Performance<br />
(%) 1M 3M 6M 12M<br />
Absolute 7 (4) (11) (16)<br />
Rel. to Nifty 9 (5) (3) (1)<br />
Source: Bloomberg<br />
Relative Price Chart<br />
350<br />
320<br />
290<br />
260<br />
230<br />
Rs<br />
200<br />
Nov-10 Jan-11 Mar-11 May-11 Jul-11 Sep-11<br />
Source: Bloomberg<br />
Vivimed <strong>Lab</strong>s (LHS) Rel to Nifty (RHS)<br />
Stock Details<br />
Sector Pharmaceuticals<br />
Bloomberg VILA@IN<br />
Equity Capital (Rs mn) 102<br />
Face Value(Rs) 10<br />
No of shares o/s (mn) 10<br />
52 Week H/L 348/216<br />
Market Cap (Rs bn/USD mn) 3/54<br />
Daily Avg Volume (No of sh) 43608<br />
Daily Avg Turnover (US$mn) 0.2<br />
Shareholding Pattern (%)<br />
%<br />
10<br />
2<br />
-6<br />
-14<br />
-22<br />
-30<br />
Sep-11 Jun-11 Mar-10<br />
Promoters 50.4 49.8 40.5<br />
FII/NRI 6.1 5.8 22.5<br />
Institutions 2.6 2.6 2.1<br />
Private Corp 7.3 7.8 7.4<br />
Public 33.7 33.9 27.5<br />
Source: Capitaline<br />
Deepak Malik<br />
Deepak.malik@emkayglobal.<strong>com</strong><br />
+91 22 6612 1257<br />
Ashish Thavkar<br />
ashish.thavkar@emkayglobal.<strong>com</strong><br />
+91 22 6612 1254<br />
Bhavita Nagrani<br />
bhavita.nagrani@emkayglobal.<strong>com</strong><br />
+91 22 6624 2486<br />
Vivimed <strong>Lab</strong>s<br />
In investment phase<br />
� Vivimed is raising funds through various sources to fund its<br />
Capex program of $43mn. Till date, <strong>Company</strong> has raised<br />
funds through FCCBs (~$ 7.5m) and private equity of $28m<br />
� <strong>Company</strong> is investing the raised funds for investment in SEZ<br />
in Andhra Pradesh for enhancing its Pharma business<br />
(contributes 25% to overall sales)<br />
� Further, the <strong>com</strong>pany is expanding its existing facilities in<br />
Specialty Chemicals (contributes 75% to overall sales) to<br />
augment the capacities and to enhance its productivity<br />
� The new capacities are expected to <strong>com</strong>e on-stream by the<br />
mid of next year which will drive the overall growth<br />
<strong>Company</strong>’s Projects and Capex<br />
Vivimed raised $7.5 mn from International Finance Corporation in the form of FCCBs<br />
and private equity of $28m. The <strong>com</strong>pany has a total capex requirement of $43mn to<br />
its projects.<br />
� Greenfield project at Andhra Pradesh at, Choutuppal<br />
� SEZ plant at Srikakulamand (Andhra Pradesh)<br />
� Expansion of its Bidar, Karnatka, and Bonthapally, Andhra Pradesh, plants.<br />
The <strong>com</strong>pany has also acquired stake in Klar Sehen Pvt. Ltd., (KSPL), a 30 year old<br />
Kolkata based Pharmaceutical <strong>com</strong>pany with strong marketing presence in Indian<br />
Markets in the regions of North East, Bihar and Andhra Pradesh<br />
Entered into alliance, In June 2010, International Specialty Products (ISP) and Vivimed<br />
jointly announced a manufacturing alliance for the production of UV absorbers. Through<br />
this alliance both the <strong>com</strong>panies can jointly market specific products used in sprays and<br />
lotions that include products having UVA and UVB protective properties. <strong>Company</strong> has<br />
already started the supply from Oct 10’<br />
Growth <strong>Dr</strong>ivers<br />
� <strong>Company</strong> does API supply of specialty chemicals to Unilever, P&G, Loreal and J&J.<br />
The <strong>com</strong>pany is increasing supply for existing products and also entering into<br />
Collaboration for different products thereby increasing the product basket and<br />
revenue share<br />
� Vivimed has legacy of 20 years plus, and is one of the most preferred supplier and<br />
preferred vendor for large FMCG players like P&G, L’oreal, Unilever etc.<br />
� The <strong>com</strong>pany has filed registrations in eight African countries and has appointed<br />
front-end team (sales team) for marketing of these products<br />
Valuations<br />
At current price, the stock trades at 5x FY11 EPS of Rs48 and 10X FY11 EV/EBITDA.<br />
Financials Rs mn<br />
YE- Net EBITDA EPS EPS RoE EV/<br />
Mar Sales (Core) (%) APAT (Rs) % chg (%) P/E EBITDA P/BV<br />
FY08 1,810 286.5 15.8 178 17.0 1.4 19.0 15.0 21.8 4.2<br />
FY09 2,761 340.7 12.3 359 20.3 19.8 16.6 12.5 23.7 3.5<br />
FY10 3,435 613.2 17.9 864 30.9 51.7 15.2 8.3 12.3 2.4<br />
FY11 4,160 801.5 19.3 1,314 47.7 54.7 20.2 5.3 10.2 1.8<br />
Emkay Global Financial Services Ltd 49<br />
<strong>Company</strong> <strong>Update</strong>
Key Financials – Quarterly<br />
Vivimed <strong>Lab</strong>s Confluence: Pharma; Pre-conference note<br />
<strong>Company</strong> Description<br />
Vivimed <strong>Lab</strong>s Ltd (VLL) is a specialty chemicals <strong>com</strong>pany and has a wide range of products<br />
(active ingredients). The <strong>com</strong>pany supplies API to leading global manufacturers of Beauty<br />
Care products (like Hair care, skin care, sun care and oral care products) and Industrial<br />
care products (such as Anti-Microbial, anti-fouling agents and biocides). The <strong>com</strong>pany has<br />
strong relationships with global majors like Unilever, P&G, Johnson & Johnson, L’Oreal,<br />
Novartis& Astra Zeneca.<br />
Large part of <strong>com</strong>pany’s revenues in specialty chemicals <strong>com</strong>es from Asia pacific (~42% of<br />
the total revenues), and in Pharmaceuticals space, India contributes the highest (~24% of<br />
the total revenues). <strong>Company</strong> has capex program of ~$43mn, for which <strong>com</strong>pany has<br />
already raised funds of $35.5m. <strong>Company</strong> is planning to invest these funds for various<br />
Greenfield and brownfield projects and also for making acquisitions.<br />
Rs mn Q2FY11 Q3FY11 Q4FY11 Q1FY12 Q2FY12 YoY (%) QoQ (%)<br />
Revenues 1057 1056 1198 1205 1287 21.8 6.8<br />
Other Operating In<strong>com</strong>e 0 1 8.2 0.8 1.2 300.0 50.0<br />
Total In<strong>com</strong>e 1057 1057 1206 1206 1288 21.9 6.8<br />
Total Expenditure 843 814 989 959 1009 19.8 5.2<br />
Consumption of RM 682 608 621 636 741 8.7 16.6<br />
as % of sales 64.5 57.6 51.9 52.7 57.6<br />
Employee Cost 53 65 36 49 71 35.3 46.4<br />
as % of sales 5.0 6.2 3.0 4.0 5.5<br />
Other expenditure 128 0 332 275 197 53.4 (28.5)<br />
as % of sales 12.1 0.0 27.7 22.8 15.3<br />
EBITDA 214 242 217 247 279 30.2 13.0<br />
Interest 38 60 0 65 79 109.3 21.5<br />
EBDT 177 182 217 182 200 13.3 9.9<br />
Depreciation 21 15 36 27 38 81.3 43.0<br />
Minority Interest 0 0 0 0 0<br />
PBT 156 167 181 156 162 4.1 4.2<br />
Tax 20 34 -11 32 38 85.8 19.9<br />
Reported Profit before EOI 135 133 192 124 124 (8.2) 0.2<br />
EOI 0 0 0 0 0<br />
Reported Profit 135 133 122 124 124 (8.2) 0.2<br />
EPS 14 11 10.45 10.24 9.98 (26.5) (2.5)<br />
Margins (%) (bps) (bps)<br />
EBIDTA 20.3 23.0 18.1 20.5 21.7 140 119<br />
EBIT 18.3 21.5 15.1 18.3 18.7 43 44<br />
EBT 14.7 15.8 15.1 12.9 12.6 -214 -31<br />
PAT 12.8 12.6 10.2 10.3 9.7 -315 -63<br />
Effective Tax rate 13.1 20.2 -5.9 20.3 23.4 1028 306<br />
Emkay Research 17 November 2011 50
Financials<br />
Vivimed <strong>Lab</strong>s Confluence: Pharma; Pre-conference note<br />
In<strong>com</strong>e Statement (Rs. mn) Balance Sheet (Rs. mn)<br />
(Year Ending Mar 31) FY08 FY09 FY10 FY11 (Year Ending Mar 31) FY08 FY09 FY10 FY11<br />
Net Sales 1,810 2,761 3,435 4,160 Share Capital 94 94 100 102<br />
Growth (%) 53% 24% 21% Reserves & Surplus 754 931 1,349 1,865<br />
Other In<strong>com</strong>e & Stock Adjusments 35 312 601 908 Networth 848 1,025 1,449 1,967<br />
Total In<strong>com</strong>e 1,845 3,073 4,036 5,068 Minority Interest 0 0 0 0<br />
Expenditure 1,524 2,421 2,822 3,359 Secured Loans 556 2,238 2,346 3,070<br />
Raw Materials 1,177 1,791 2,142 2,526 Unsecured Loans 612 767 7 7<br />
% to Sales 65.0% 64.8% 62.4% 60.7% Loan funds 1,167 3,005 2,353 3,077<br />
Employee Cost 76 168 221 200 Net Deferred Tax 120 130 162 147<br />
% to Sales 4.2% 6.1% 6.4% 4.8% Total Liabilities 2,136 4,160 3,964 5,191<br />
Other Expenses 112 200 165 199<br />
% to Sales 6.2% 7.2% 4.8% 4.8% Gross Block 1,079 2,542 2,891 3,078<br />
Selling and Admin Expenses 159 262 294 434 Less: Accumulated Depreciation 144 257 344 435<br />
% to Sales 8.8% 9.5% 8.6% 10.4% Net Block 936 2,285 2,547 2,643<br />
Operating Profit 287 341 613 802 Capital Work in Progress 110 269 11 17<br />
EBITDA Margin (%) 15.8 12.3 17.9 19.3 Investments 0 0 0 0<br />
Depreciation 40 72 87 92 Current Assets 1,379 1,833 1,941 3,147<br />
EBIT 246 269 526 710 Inventories 462 691 794 845<br />
EBIT margin (%) 13.6 9.7 15.3 17.1 Sundry Debtors 564 708 939 1,276<br />
Interest 67 181 219 213 Cash and Bank 155 170 56 111<br />
% to Debt 5.7% 6.0% 9.3% 6.9% Loans and Advances 197 264 152 916<br />
Profit Before Tax 214 400 908 1,405 Current Liabilities and Provisions 288 226 536 616<br />
Tax 24 27 56 94 Current Liabilities 239 207 424 467<br />
Fringe Benefit Tax 15 16 0 0 Provisions 49 19 112 149<br />
Deferred Tax -3 -2 -12 -3 Net Current Assets 1,091 1,607 1,405 2,531<br />
Net Profit 178 359 864 1,314 Total Assets 2,136 4,160 3,964 5,191<br />
Minority Interest (after tax) 0 0 0 0<br />
Profit after Min. Int. 178 359 864 1,314<br />
Extraordinary Items 0 0 0 0<br />
Adjusted Net Profit 178 359 864 1,314<br />
Net margin (%) 9.8 13.0 25.1 31.6<br />
Cash Flow (Rs. mn) Key Ratios<br />
(Year Ending Mar 31) FY08 FY09 FY10 FY11 (Year Ending Mar 31) FY08 FY09 FY10 FY11<br />
Opening Cash Position 50 155 170 56 Profitability (%)<br />
Operating Cash Flow -43 -168 551 104 EBITDA Margin 15.8 12.3 17.9 19.3<br />
Investing Cash Flow -454 -1611 -71 -724 Net Margin 9.8 13.0 25.1 31.6<br />
Financing Cash Flow 602 1793 -594 675 ROCE 11.5 8.6 12.9 15.5<br />
Net Change in Cash 105 14 -114 55 ROE 19.0 16.6 15.2 20.2<br />
Closing Cash Position 155 170 56 111 ROIC 13.2 9.6 13.8 15.9<br />
Per Share Data (Rs)<br />
EPS 17.0 20.3 30.9 47.7<br />
CEPS 15.7 31.0 68.4 101.1<br />
BVPS 61.0 73.8 104.2 141.5<br />
DPS 0.8 1.0 1.1 1.5<br />
Valuations (x)<br />
PER 15.0 12.5 8.3 5.3<br />
P/CEPS 16.2 8.2 3.7 2.5<br />
P/BV 4.2 3.5 2.4 1.8<br />
EV / Sales 3.4 2.9 2.2 2.0<br />
EV / EBITDA 21.8 23.7 12.3 10.2<br />
Dividend Yield (%) 0.3 0.4 0.4 0.6<br />
Gearing Ratio (x)<br />
Net Debt/ Equity 1.2 2.8 1.6 1.5<br />
Net Debt/EBIDTA 3.5 8.3 3.7 3.7<br />
Source: Capitaline<br />
Emkay Research 17 November 2011 51
Notes<br />
Vivimed <strong>Lab</strong>s Confluence: Pharma; Pre-conference note<br />
Emkay Research 17 November 2011 52
Emkay Rating Distribution<br />
Confluence: Pharma; Pre-conference note<br />
BUY Expected total return (%) (stock price appreciation and dividend yield) of over 25% within the next 12-18 months.<br />
ACCUMULATE Expected total return (%) (stock price appreciation and dividend yield) of over 10% within the next 12-18 months.<br />
HOLD Expected total return (%) (stock price appreciation and dividend yield) of upto 10% within the next 12-18 months.<br />
REDUCE Expected total return (%) (stock price depreciation) of upto (-)10% within the next 12-18 months.<br />
SELL The stock is believed to under perform the broad market indices or its related universe within the next 12-18 months.<br />
DISCLAIMER: This document is not for public distribution and has been furnished to you solely for your information and may not be reproduced or redistributed to<br />
any other person. The manner of circulation and distribution of this document may be restricted by law or regulation in certain countries, including the United States.<br />
Persons into whose possession this document may <strong>com</strong>e are required to inform themselves of, and to observe, such restrictions. This material is for the personal<br />
information of the authorized recipient, and we are not soliciting any action based upon it. This report is not to be construed as an offer to sell or the solicitation of<br />
an offer to buy any security in any jurisdiction where such an offer or solicitation would be illegal. No person associated with Emkay Global Financial Services Ltd.<br />
is obligated to call or initiate contact with you for the purposes of elaborating or following up on the information contained in this document. The material is based upon<br />
information that we consider reliable, but we do not represent that it is accurate or <strong>com</strong>plete, and it should not be relied upon. Neither Emkay Global Financial Services<br />
Ltd., nor any person connected with it, accepts any liability arising from the use of this document. The recipient of this material should rely on their own investigations<br />
and take their own professional advice. Opinions expressed are our current opinions as of the date appearing on this material only. While we endeavor to update on<br />
a reasonable basis the information discussed in this material, there may be regulatory, <strong>com</strong>pliance, or other reasons that prevent us from doing so. Prospective<br />
investors and others are cautioned that any forward-looking statements are not predictions and may be subject to change without notice. We and our affiliates,<br />
officers, directors, and employees world wide, including persons involved in the preparation or issuance of this material may; (a) from time to time, have long or short<br />
positions in, and buy or sell the securities thereof, of <strong>com</strong>pany (ies) mentioned herein or (b) be engaged in any other transaction involving such securities and earn<br />
brokerage or other <strong>com</strong>pensation or act as a market maker in the financial instruments of the <strong>com</strong>pany (ies) discussed herein or may perform or seek to perform<br />
investment banking services for such <strong>com</strong>pany(ies)or act as advisor or lender / borrower to such <strong>com</strong>pany(ies) or have other potential conflict of interest with respect<br />
to any re<strong>com</strong>mendation and related information and opinions. The same persons may have acted upon the information contained here. No part of this material may<br />
be duplicated in any form and/or redistributed without Emkay Global Financial Services Ltd.’sprior written consent. No part of this document may be distributed in<br />
Canada or used by private customers in the United Kingdom. In so far as this report includes current or historical information, it is believed to be reliable, although<br />
Emkay its accuracy Research and <strong>com</strong>pleteness 28 June, cannot 2011 be guaranteed.<br />
60
EMKAY GLOBAL FINANCIAL SERVICES LIMITED<br />
th<br />
Corporate Add: B - Ruby Mills Tower, 7 Floor, South East Wing, Senapati Bapat Marg, Dadar (W), Mumbai - 400 028<br />
India.<br />
Tel.: +91 22 6612 1212 l Web: www.emkayglobal.<strong>com</strong>