Company Update Dr. Reddy's Lab - Myiris.com - Personal finance ...
Company Update Dr. Reddy's Lab - Myiris.com - Personal finance ...
Company Update Dr. Reddy's Lab - Myiris.com - Personal finance ...

You also want an ePaper? Increase the reach of your titles
YUMPU automatically turns print PDFs into web optimized ePapers that Google loves.
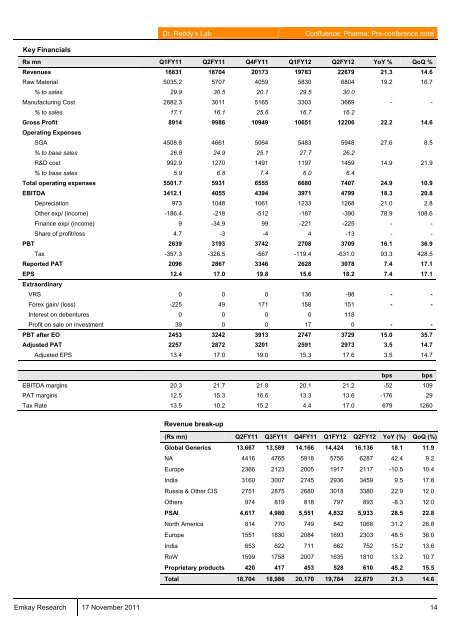
Key Financials<br />
<strong>Dr</strong>. Reddy’s <strong>Lab</strong> Confluence: Pharma; Pre-conference note<br />
Rs mn Q1FY11 Q2FY11 Q4FY11 Q1FY12 Q2FY12 YoY % QoQ %<br />
Revenues 16831 18704 20173 19783 22679 21.3 14.6<br />
Raw Material 5035.2 5707 4059 5830 6804 19.2 16.7<br />
% to sales 29.9 30.5 20.1 29.5 30.0<br />
Manufacturing Cost 2882.3 3011 5165 3303 3669 - -<br />
% to sales 17.1 16.1 25.6 16.7 16.2<br />
Gross Profit 8914 9986 10949 10651 12206 22.2 14.6<br />
Operating Expenses<br />
SGA 4508.8 4661 5064 5483 5948 27.6 8.5<br />
% to base sales 26.8 24.9 25.1 27.7 26.2<br />
R&D cost 992.9 1270 1491 1197 1459 14.9 21.9<br />
% to base sales 5.9 6.8 7.4 6.0 6.4<br />
Total operating expenses 5501.7 5931 6555 6680 7407 24.9 10.9<br />
EBITDA 3412.1 4055 4394 3971 4799 18.3 20.8<br />
Depreciation 973 1048 1061 1233 1268 21.0 2.8<br />
Other exp/ (in<strong>com</strong>e) -186.4 -218 -512 -187 -390 78.9 108.6<br />
Finance exp/ (in<strong>com</strong>e) 9 -34.9 99 -221 -225 - -<br />
Share of profit/loss 4.7 -3 -4 4 -13 - -<br />
PBT 2639 3193 3742 2708 3709 16.1 36.9<br />
Tax -357.3 -326.5 -567 -119.4 -631.0 93.3 428.5<br />
Reported PAT 2096 2867 3346 2628 3078 7.4 17.1<br />
EPS 12.4 17.0 19.8 15.6 18.2 7.4 17.1<br />
Extraordinary<br />
VRS 0 0 0 136 -98 - -<br />
Forex gain/ (loss) -225 49 171 158 151 - -<br />
Interest on debentures 0 0 0 0 118<br />
Profit on sale on investment 39 0 0 17 0 - -<br />
PBT after EO 2453 3242 3913 2747 3729 15.0 35.7<br />
Adjusted PAT 2257 2872 3201 2591 2973 3.5 14.7<br />
Adjusted EPS 13.4 17.0 19.0 15.3 17.6 3.5 14.7<br />
bps bps<br />
EBITDA margins 20.3 21.7 21.8 20.1 21.2 -52 109<br />
PAT margins 12.5 15.3 16.6 13.3 13.6 -176 29<br />
Tax Rate 13.5 10.2 15.2 4.4 17.0 679 1260<br />
Revenue break-up<br />
(Rs mn) Q2FY11 Q3FY11 Q4FY11 Q1FY12 Q2FY12 YoY (%) QoQ (%)<br />
Global Generics 13,667 13,589 14,166 14,424 16,136 18.1 11.9<br />
NA 4416 4765 5918 5756 6287 42.4 9.2<br />
Europe 2366 2123 2005 1917 2117 -10.5 10.4<br />
India 3160 3007 2745 2936 3459 9.5 17.8<br />
Russia & Other CIS 2751 2875 2680 3018 3380 22.9 12.0<br />
Others 974 819 818 797 893 -8.3 12.0<br />
PSAI 4,617 4,980 5,551 4,832 5,933 28.5 22.8<br />
North America 814 770 749 842 1068 31.2 26.8<br />
Europe 1551 1830 2084 1693 2303 48.5 36.0<br />
India 653 622 711 662 752 15.2 13.6<br />
RoW 1599 1758 2007 1635 1810 13.2 10.7<br />
Proprietary products 420 417 453 528 610 45.2 15.5<br />
Total 18,704 18,986 20,170 19,784 22,679 21.3 14.6<br />
Emkay Research 17 November 2011 14