
Create successful ePaper yourself
Turn your PDF publications into a flip-book with our unique Google optimized e-Paper software.
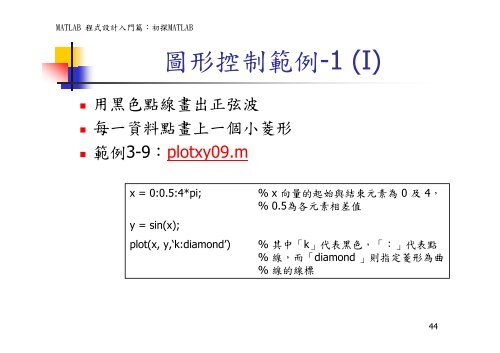
MATLAB 程 式 設 計 入 門 篇 : 初 探 MATLAB圖 形 控 制 範 例 -1 (I)• 用 黑 色 點 線 畫 出 正 弦 波• 每 一 資 料 點 畫 上 一 個 小 菱 形• 範 例 3-9:plotxy09.mx = 0:0.5:4*pi; % x 向 量 的 起 始 與 結 束 元 素 為 0 及 4,% 0.5 為 各 元 素 相 差 值y = sin(x);plot(x, y,‘k:diamond’)% 其 中 「k」 代 表 黑 色 ,「:」 代 表 點% 線 , 而 「diamond 」 則 指 定 菱 形 為 曲% 線 的 線 標44