TRC-SFD-1-07 - Tribology Group - Texas A&M University
TRC-SFD-1-07 - Tribology Group - Texas A&M University
TRC-SFD-1-07 - Tribology Group - Texas A&M University

You also want an ePaper? Increase the reach of your titles
YUMPU automatically turns print PDFs into web optimized ePapers that Google loves.
<strong>Texas</strong> A&M <strong>University</strong>Mechanical Engineering DepartmentTurbomachinery laboratoryParameter Identification of an End Sealed <strong>SFD</strong>Part I: Identification of Force Coefficients andOperating Conditions Leading to Air Ingestion.Research Progress Report to the Turbomachinery Research Consortium<strong>TRC</strong>-<strong>SFD</strong>-1-<strong>07</strong>Luis San AndrésMast-Childs ProfessorPrincipal InvestigatorAdolfo DelgadoResearch AssistantMay 20<strong>07</strong><strong>TRC</strong> Project 32513/1519C3
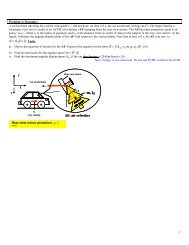
Executive SummaryOpen end squeeze film dampers operating with low levels of pressurization are proneto air ingestion and entrapment that drastically reduce their damping capabilities. Endseals can significantly reduce the severity of air ingestion. A prior <strong>TRC</strong> report [3]advances an experimental work to identify the force coefficients of a combined squeezefilm damper and mechanical end seal. The test damper configuration includes outlet portsfor oil flow through the damper at the sealed end. The system parameters are identified ina two step procedure. First, the mechanical seal friction force is identified from circularorbits tests prior to pumping oil through the damper (i.e. dry system). Second, thesqueeze film force coefficients are extracted from the system force coefficients identifiedfrom circular orbit tests with oil circulating through the damper.This report extends the experimental work advanced in [3] to include theidentification of force coefficients for the same <strong>SFD</strong> damper but with closed outlet ports(i.e. no-thru flow). An identification method, suited for non-linear systems, allows tosimultaneously identify the squeeze film force coefficients and dry friction forceintroduced by the mechanical seal. The identification procedure shows similar (within10 %) damping and added mass coefficients than those reported for the thru-flowconfiguration. The oil temperature in the squeeze film land does not increase significantlydespite the no-thru flow condition. The oil temperature remains constant due to the shortlength of the experiments, the relatively small amount of energy (work) input into thesystem, and the large amount of oil stored in the <strong>SFD</strong> inlet plenum. In an actualapplication, the no-thru flow condition is expected to lead to an increase of the oiltemperature and a significant reduction of damping.In addition, tests are conducted to find the onset excitation amplitude and frequenciesleading to air ingestion. The results, for the maximum allowable shaker loads,demonstrate no evidence of oil cavitation in the damper land. On the other hand, for thelargest test amplitude (74 um at 50 Hz) and one of the highest test frequencies (32 um at100 Hz), the experiments indicate the ingestion of air into the <strong>SFD</strong> land. Visualobservations of the <strong>SFD</strong> land shows that, besides the seal interface, air is being ingestedthrough other passages including the juncture of the instrumentation facing the damperfilm land. The amount of air ingested is relatively small and the damper performance isnot greatly affected.2
Table of ContentsExecutive Summary............................................................................................................ 2Nomenclature...................................................................................................................... 6I Introduction ...................................................................................................................... 7II Literature Review............................................................................................................8III Test Rig Description .................................................................................................... 11IV Parameter identification............................................................................................... 14IV.1 Experimental procedure................................................................................ 14IV.2 Identification method.................................................................................... 16IV.3 Results: Dynamic force coefficients ............................................................. 20V Onset amplitude and frequency leading to air ingestion and lubricant cavitation in test<strong>SFD</strong> ................................................................................................................................... 26V.1 Experimental procedure................................................................................ 26V.2 Experimental Results .................................................................................... 30VI Conclusions and Recommendations............................................................................ 36VII References .................................................................................................................. 38List of TablesTable 1 Test conditions for dynamic load tests (CCO). Lubricated <strong>SFD</strong>......................... 14Table 2 <strong>SFD</strong> inertia coefficients and dry friction force identified from circular centeredorbit tests (frequency range 20-70 Hz, no thru-flow) ............................................... 22Table 3 Test conditions for dynamic load tests (CCO). Lubricated <strong>SFD</strong>. No thru-flow. 26List of FiguresFigure 1 Test rig for dynamic force measurements and flow visualization in a sealed end<strong>SFD</strong> ........................................................................................................................... 11Figure 2 Sealed-end <strong>SFD</strong> assembly cross section view.................................................... 12Figure 3 Sealed-end <strong>SFD</strong> assembly cut view. .................................................................. 13Figure 4 <strong>SFD</strong> housing reference coordinate system and location of sensors. .................. 13Figure 5 Recorded load and ensuing displacement orbits for four amplitude loadmagnitudes. Clearance circle noted. (20 Hz, lubricated <strong>SFD</strong>, CCO) ....................... 15Figure 6 Recorded load and ensuing displacement orbits for four amplitude loadmagnitudes. Clearance circle noted. (60 Hz, lubricated <strong>SFD</strong>, CCO) ....................... 163
Figure 7 Schematic view of the equivalent representation of the <strong>SFD</strong> with mechanicalseal ............................................................................................................................ 17Figure 8 Elements of a four-input/two output representation of the non-linear mechanicalseal-<strong>SFD</strong> system [16]................................................................................................ 18Figure 9 Dry friction force identified from circular centered orbits. Dotted line representsdry friction estimated from energy method and tests under dry conditions. ............ 21Figure 10 Real part of dynamic stiffnesses versus frequency. Circular centered orbits ofamplitude x,y: 50 μm (K sx = 853 kN/m, K sy = 885 kN/m.) ......................................... 22Figure 11 Imaginary part of linear impedance function versus excitation frequency.(C <strong>SFD</strong>xx ) Circular centered orbits of amplitude x,y: 50 μm ( no thru-flow) ............. 23Figure 12 Squeeze film damping coefficient (C <strong>SFD</strong>yy ) versus orbit amplitude. (CircularCentered Orbits, No thru-flow, flow restrictor: 2.8 mm [3]) .................................... 24Figure 13 Squeeze film damping coefficients (C <strong>SFD</strong>xx, C <strong>SFD</strong>yy ) and system dampingcoefficients (C s-xx, C s-yy ) versus excitation frequency for increasing orbit amplitudes.(Circular Centered Orbits, No thru-flow) ................................................................. 25Figure 14 Excitation load and response orbits (motion) from experimental data. (110 Hz,Load: [N], displacement [μm], 32 μm)..................................................................... 28Figure 15 Excitation load and response orbits (motion) from experimental data. (90 Hz,Load: [N], displacement [μm], 50 μm)..................................................................... 28Figure 16 Excitation load and response orbits (motion) from experimental data. (50 Hz,Load: [N], displacement [μm], 74 μm)..................................................................... 29Figure 17 Cut view of <strong>SFD</strong> housing detailing the location of pressure sensors............... 30Figure 18 Pk-pk dynamic pressures in squeeze film land versus frequency and variousorbit amplitudes. ....................................................................................................... 31Figure 19 Pk-pk dynamic pressures in discharge groove versus frequency and variousorbit amplitudes. ....................................................................................................... 32Figure 20 Dynamic pressure measurements at <strong>SFD</strong> land and discharge groove (includingfilm thickness at sensor location). (100 Hz, 32 μm orbit amplitude, supply pressure=31 kPa, no thru-flow) ................................................................................................ 33Figure 21 Dynamic pressure measurements at <strong>SFD</strong> land and discharge groove (includingfilm thickness at sensor location). (90 Hz, 50 μm orbit amplitude, supply pressure=31 kPa, no thru-flow) ................................................................................................ 334
Figure 22 Dynamic pressure measurements at <strong>SFD</strong> land and discharge groove (includingfilm thickness at sensor location). (60 Hz, 62 μm orbit amplitude, supply pressure=31 kPa, no thru-flow) ................................................................................................ 34Figure 23 Dynamic pressure measurements at <strong>SFD</strong> land and discharge groove(including film thickness at sensor location). (50 Hz, 74 μm orbit amplitude, supplypressure= 31 kPa, no thru-flow)................................................................................ 34Figure 24 Cut view of <strong>SFD</strong> detailing alternative paths for air ingestion.......................... 355
NomenclaturecBearing radial clearance [m]C rv Structure remnant damping coefficient [N.s/m]C sα Structure damping coefficient [N.s/m] α=x,yC s-αβ Identified system damping coefficients [N.s/m] α,β=x,yC <strong>SFD</strong>αβ Identified squeeze film damping coefficients [N.s/m] α,β=x,yD2 R. Damper journal diameter [m]eAmplitude or radius of circular centered orbit [m]F x,y External (shaker) forces applied to bearing [N]F , Complex components of external forces applied to bearing [N]xF yF df nDry friction force from contact in mechanical seal [N]Test system natural frequency [Hz]H αβ, L αβ ,G αβ Dynamic transfer functions [N/m], α,β=x,yK sx ,K sy Structural (support) stiffnesses [N/m]L, R Length and radius of <strong>SFD</strong> land [m]M s Mass of <strong>SFD</strong> housing [kg]M f Estimated mass of lubricant (feed plenum & end groove) [kg]M <strong>SFD</strong>αβ Squeeze film inertia coefficients [kg], α,β=x,yM s-αβ Identified system inertia coefficients [kg], α,β=x,yM plenum Oil mass at the <strong>SFD</strong> inlet plenum [kg]TLubricant temperature [°C]u,v Non-linear system inputs [-]uv , Complex components of model non-linear system inputs [-]x,y Bearing dynamic motions along X,Y directions [m]x,y Complex components of bearing motions [m]x,yBearing dynamic velocities along X,Y directionsZ (ω) Vector of displacements in frequency domain [m]ρ, η Lubricant density [kg/m 3 ] and viscosity [Pa-s]ω Excitation frequency [rad/s]6
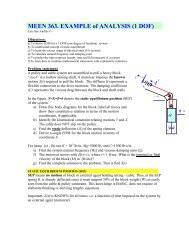
I IntroductionSqueeze film dampers (<strong>SFD</strong>) aid to reduce synchronous vibration and enhancestability characteristics in rotating machinery. <strong>SFD</strong>s are prone to air ingestion andlubricant cavitation due to typically low inlet feed pressures. These phenomena are morepervasive with increasing vibration amplitudes and operation frequencies. End sealed<strong>SFD</strong>s represent an alternative to reduce or retard the occurrence of air ingestion,commonly present in open or partially sealed <strong>SFD</strong> configurations.Prior <strong>TRC</strong> reports [1-3] describe the design and testing of a <strong>SFD</strong> with an endmechanical seal that replicates a configuration currently in use by one of the <strong>TRC</strong>members. Prior to this work, no experimental data was available on this type of sealed<strong>SFD</strong> configuration. The last (2006) <strong>TRC</strong> report [3] includes flow measurements anddynamic force excitation tests to assess the effectiveness of the end mechanical seal inpreventing air entrapment and to identify the force coefficients, respectively. The testconfiguration includes outlet ports that allow the oil to exit at the sealed end of thedamper. The system parameters are identified in a two step procedure. First, themechanical seal friction force is identified from circular orbits tests prior to pumping oilthrough the damper (i.e. dry system). Second, the squeeze film force coefficients areextracted from the system force coefficients identified from circular orbit tests with oilcirculating through the damper. The test results indicate that the end seal is effective inpreventing air ingestion for the range of frequencies and journal displacement amplitudestested.This report details experiments to identify the forced coefficients of the mechanicallysealed <strong>SFD</strong> operating with closed outlet ports (i.e. no-thru flow). This configuration is ofspecial interest for unmanned aerial vehicles (UAV). A non-linear identificationtechnique is adopted to identify simultaneously the dry friction force and the squeeze filmforce coefficients, thus eliminating the need for additional “dry system” tests. The testresults are compared to prior test results obtained with thru-flow condition. In addition,the report includes experiments to determine the operating conditions (frequency andamplitude of motion) leading to air entrapment. A literature review of prior experimentalwork on <strong>SFD</strong>s relevant to this experimental investigation and non-linear parameteridentification techniques follows.7
II Literature ReviewThe 2006 <strong>TRC</strong> report [3] presents a compilation of the most relevant work related tothe present experimental study. Recall that Della Pietra and Adilleta [4,5] present acomprehensive compilation of the experimental and theoretical work conducted on <strong>SFD</strong>sup to 2002. The following are experimental work publications on <strong>SFD</strong> since the lastreport [3] that are pertinent to this research.Defaye et al. [6] present a series of experiments to evaluate the influence ofgeometric and operating parameters on the force performance of a <strong>SFD</strong>. The geometricparameters considered include feeding systems (grooves, holes) and their axial location.The operating parameters include lubricant inlet pressure, temperature and journaldynamic eccentricity. The test results show that for a <strong>SFD</strong> with deep circumferential feedgrooves, two independent pressure fields are generated in the squeeze film lands, with atotal tangential (damping) force smaller than that generated without a feeding groove.Lubricant cavitation effects are more pronounced at a lower frequency for a <strong>SFD</strong> withorifice feeding (i.e. no groove). In terms of the operating conditions, high supplypressures delay air ingestion and oil cavitation; while high temperatures (i.e. lowerlubricant viscosities) increase the thru flow and diminish the damping capacity of the test<strong>SFD</strong>.Adilleta and Della Pietra [7] present measurements of the dynamic pressure fielddistribution in a squeeze film damper describing off-centered circular orbits. The testconditions include two journal orbit radii (5 % and 25 % of radial clearance), whirlingfrequencies ranging from 5 Hz-50 Hz, and two lubricant discharge configurations thatregulate the amount of air ingested through the damper end. Air ingestion effects areproperly characterized by an empirical parameter derived from a physical modeldeveloped by Diaz and San Andrés [8]. The dynamic squeeze film pressure waves aredisplayed for each of the operation conditions. The test results show that lubricant vaporcavitation is more pervasive at lower inlet feed lubricant pressures. In many cases, thecavitation region with lubricant vapor is followed by a short zone with tensile stresses (-0.4 bar). Furthermore, the onset of film rupture due to vapor cavitation only alters thenegative region of the dynamic pressure field. This research will be extended to includehigher precession frequencies characterizing practical rotordynamic applications.8
A review of publications related to parameter identification of non-linear systemsfrom dynamic force excitation tests is of interest. As detailed in the 2006 <strong>TRC</strong> report [3],the mechanical seal-<strong>SFD</strong> force response is non-linear due to dry friction interactions atthe seal interface. Previously, the system parameters were identified in a two stepprocedure with the mechanical seal friction force first identified from circular orbits testsprior to pumping oil through the damper (i.e. dry system).Rice and Fitzpatrick [9] present one the first formal techniques tailored to identifyparameters in non-linear mechanical systems using random force excitations. Theprocedure is based on a cross-spectra frequency analysis to decouple the linear and nonlinearforce contributions of the mechanical system using residual coherence functions[10]. Non-linear effects are modeled as non-linear inputs with linear operators on amultiple-input/single output transfer function model. The method demonstrates to berobust and computationally light. However, non-Gaussian errors associated to multipleinput/outputsystems could not be quantified. Thus, a series of tests using different levelsof force excitation are needed to validate the identified parameters.Rouvas et al. [11] present the application of spectral density methods to identifylinearized force coefficients in fluid film bearings. The test system is excited with impactloads and the bearing force coefficients identified from averaging 200 tests repetitions.The results obtained with power spectral density formulation are similar to those obtainedby averaging the data in the time domain, provided that the time data of each repetition isnot shifted with respect to each other. The authors validate the use of the power spectraldensity methods to reduce errors due to signal noise and averaging in the time domain.Rice and Xu [12] present a general identification method for non-linear systems basedon the representation of the system response in terms of the Volterra expansion in thefrequency domain. The method employs force excitations with identical frequencyspectra at different amplitude levels to decouple the linear and non-linear responses in thefrequency domain. The parameters are identified from each decoupled response using astandard least-squares technique. The authors also present an application of the techniqueto identify the parameters of an insulation material from test data obtained in actualexperiments.Adams et al. [13] present a frequency domain technique to simultaneously estimatethe linear frequency response matrix and the non-linear parameters of a mechanical9
system. The method relies on the principle that the non-linear feedback is directly linkedto the spatial nature of the non-linear system. The application of the method is illustratedon two numerical simulations of single or multiple-input/multiple-output SDOF andMDOF systems. The results show the method is effective in determining the linear andnon-linear system parameters simultaneously.Yang et al. [14] present a technique for diagnosing vibration using sensitivityfunctions that are used to correlate the influence of each system parameter over theoverall system response. For a SDOF system, these functions are simply defined as thepartial derivative of the impedance function with respect to the specific system parameter(i.e. mass, damping, stiffness). The definition of these functions can be extended toMDOF systems. The authors include a practical application of the sensitivity function tolocate and eliminate a vibration problem in a vehicle exhaust system.Yang et al. [15] extend the method in [14] for the parameter identification ofmechanical systems using sensitivity functions that are expressed in terms of the systemtransfer functions. The identification procedure involves the linearization of non-linearsources. Although this implies the a-priori knowledge of the non-linear source, theidentification procedure can be used to evaluate if the system nonlinearities assumed inthe model (i.e. cubic stiffness, quadratic damping, etc.) characterize the system response.The application of the method is illustrated numerically with a 2-DOF system, includingan element with a non-linear quadratic stiffness, which is excited with periodic (singlefrequency) load excitations. The numerical results demonstrate the method effectivenessin determining the degree of freedom in which the nonlinearity is present, and invalidating the modeling assumption (i.e. quadratic stiffness).The present identification method is an adaptation of the Rice and Fitzpatrick [9]method, and also uses definitions from a similar implementation of the method given bySan Andrés and Aguilar [16].10
III Test Rig DescriptionFigure 1 depicts a schematic view of the test rig also described in the prior <strong>TRC</strong>report [3]. Following the same description, the test rig consist of a vertical rigid shaft,mounted on three precision ball bearings (natural frequency 400 Hz [3]), which holds asteel journal of 5” (127 mm) diameter and 3” (76.2 mm) long. The bearing assemblyincludes two steel plates clamping an acrylic bearing. The two horizontal plates areattached by two vertical steel plates, which also serve as an interface to apply externalforces onto the bearing assembly. The top plate includes a lubricant supply connection, astatic pressure gauge displaying the feed pressure into the bearing and four eddy currentsensors facing the shaft. The composite bearing housing hangs from a top structure withfour steel rods providing structural stiffness to the test bearing section. A mechanism atopof the test rig, comprising two sliding flat plates (top and bottom support plates), allowsadjusting the position of the bearing center with respect to the shaft to simulate centeredand off-centered operation conditions.Top SupportPlateMain FramesupportsSteelRodsBottom SupportPlateAccelerometerOscilloscopeXAcrylicHousingShakerSignalDischargeorificeRing carrierJournalVerticalplateLoad CellPowerSupplyPC DAQShaft1)127mm (5 in)ShakerSignal inputShaker Cooler FanTo ComputerFigure 1 Test rig for dynamic force measurements and flow visualization in a sealed end<strong>SFD</strong>The bearing housing design integrates a <strong>SFD</strong> land and an annulus that accommodatesa metallic ring (ring carrier). A wave spring pushes the ring holder against the journal and11
provides a contact force between the matting surfaces to seal the damper. Figure 2 and 3depict a cross section and a cut view of the end sealed <strong>SFD</strong> design along with itscomponents, respectively. The configuration tested in [3] included four outlet ports at thedischarge groove that allowed flow of the oil across the damper. In the current test set upthese ports are sealed (i.e. no thru flow allowed).Oil inletEddycurrentsensorPlexiglasBearingVerticalplateRecirculationannulus DischargegrooveHousingTop plateO-ringsO-ringsWave springRing carrierJournalcm0 2.5 5 7.5 10Pipe PluginsertShaftDischargeorificeBottom plateFigure 2 Sealed-end <strong>SFD</strong> assembly cross section view.Figure 4 shows the instrumentation arrangement and the reference coordinate systemon the <strong>SFD</strong> housing. The instrumentation consists of two accelerometers, four Eddycurrent sensors and two load cells. The system is excited via two electromagnetic shakerssuspended from separate steel structures (90 degrees apart). Slender stingers connect theelectromagnetic shakers to the piezoelectric load cells attached to vertical plates on thebearing housing. A customized data acquisition system records all the sensor signals andcontrols the electromagnetic shakers.12
Oil inletEddy current sensorHousingtop plateNominal clearance0.005 in (0.127 mm)Plexiglas bearingJournalVerticalplateShaftRing carrierWavespringDischarge Recirculation groove annulusBottom plate2 in (50.8 mm)Figure 3 Sealed-end <strong>SFD</strong> assembly cut view.1:Accelerometers2: Load Cells3: Stingers4: Eddy currentsensor holder411XY23Figure 4 <strong>SFD</strong> housing reference coordinate system and location of sensors.13
IV Parameter identificationIV.1 Experimental procedureThe system is excited with single frequency loads ensuing circular centered orbits ofthe test element. The tests include four motion amplitudes (25 μm to 50 μm) atfrequencies ranging from 20 Hz to 70 Hz. The excitation load amplitudes are adjustedthroughout the test frequency range to maintain constant amplitude circular orbits (25 μm,31μm, 38 μm, 50 μm). The tests conditions are similar to those in Ref. [3] to allow directcomparisons of the end results. Table 1 presents the test conditions and lubricantproperties. Figures 5 and 6 show the recorded displacement orbits for two selectedfrequencies (20 and 60 Hz).Table 1 Test conditions for dynamic load tests (CCO). Lubricated <strong>SFD</strong>Inlet Pressure (P s ) *31 kPaDischarge groove pressure (P r )* 8.6 kPa-15.5 kPaFrequency Range20-70 Hz (5 Hz step)Lubricant temperature (T) 23-25 0 C (73-77 0 F)Viscosity (η)3.1 cP- 2.8 cPClearance (c)125-127 μm (4.9-5 mil)Orbit amplitude (e)25-50 μm (1-2 mil)*: Gauge pressure. **: no thru-flow.14
300Y Load [N](90 N,82 N)(98 N,88 N)(105 N,95 N)150− 300 − 1500 150 300(127 N,113 N)− 150− 300X Load [N]130Max. clearance:127 μmY displacement [um]25 μm31 μm38 μm65− 130 − 650 65 13050 μm− 65− 13020 HzX displacement [um]Figure 5 Recorded load and ensuing displacement orbits for four amplitude loadmagnitudes. Clearance circle noted. (20 Hz, lubricated <strong>SFD</strong>, CCO)15
300(131 N,128 N)(154 N,148 N)(182 N,171 N)150Y Load [N]− 300 − 1500 150 300(238 N,225 N)− 150− 300X Load [N]130Max. clearance:127 μmY displacement [um]25 μm38 μm31 μm65− 130 − 650 65 13050 μm− 65− 13060 HzX displacement [um]Figure 6 Recorded load and ensuing displacement orbits for four amplitude loadmagnitudes. Clearance circle noted. (60 Hz, lubricated <strong>SFD</strong>, CCO)IV.2 Identification methodThe seal-<strong>SFD</strong> force parameters are identified from circular centered orbits using anadaptation of the methods presented in Refs. [9,16] using single frequency dynamic loadexcitations. Figure 7 shows a schematic view of the equivalent mechanical systemrepresentation of the <strong>SFD</strong> with mechanical seal.16
M sM fK sxC <strong>SFD</strong>xxC <strong>SFD</strong>yyF djournalF dxyC sxK sy C sy<strong>SFD</strong>housingC sα : Structural damping(equivalent viscous damping)C <strong>SFD</strong>αα: Squeeze film dampingF d : Friction forceK sα : Structural (support) stiffnessM f : Estimated mass of lubricantM s : Housing massα: x,yFigure 7 Schematic view of the equivalent representation of the <strong>SFD</strong> with mechanical sealThe equations of motion for the test bearing section are [3]⎡Ms + Mf0 ⎤⎧x⎫ ⎧Csxx⎫ ⎧Ksxx⎫ ⎧Fx ⎫ ⎧Fx ⎫ ⎧Fx⎫⎢0 Ms M⎥⎨ ⎬ + ⎨ ⎬ + ⎨ ⎬ = ⎨ ⎬ − ⎨ ⎬ − ⎨ ⎬⎣ +f ⎦⎩y⎭⎩Csyy ⎭ ⎩Ksyy⎭ ⎩Fy⎭ ⎩Fy⎭ ⎩Fy⎭seal<strong>SFD</strong>(1)where M f is the mass of fluid enclosed in the plenum above the fluid film land sectionand in the discharge groove. (C s ) x,y are the equivalent viscous damping coefficients thatcharacterize the damping arising from the structural support. These coefficients, obtainedfrom impact tests on the dry structure [3], equal 230 N.s/m.The <strong>SFD</strong> linearized reaction forces are⎧F 0 0x ⎫ ⎡C<strong>SFD</strong>⎤xx ⎧x⎫ ⎡M<strong>SFD</strong>⎤xx ⎧x⎫⎨ ⎬ = ⎢ ⎥⎨ ⎬+⎢ ⎥⎨ ⎬⎩Fy ⎭ 0 C<strong>SFD</strong> y 0 M<strong>SFD</strong> ⎢ yy ⎥⎩⎣ ⎦ ⎭ ⎢⎣ <strong>SFD</strong> yyy ⎥⎦⎩⎭(2)where {C <strong>SFD</strong>αβ } αβ=x,y {M <strong>SFD</strong>αβ } αβ=x,y are the damping and inertia force coefficients,respectively. As demonstrated in a prior report [3], cross-coupled force coefficients arenegligible since the damper operates without oil cavitation.The seal dry friction (non-linear) force is expressed as [16]⎧F ⎫ ⎧x⎫ 1 ⎧u⎫⎨ ⎬ ⎨ ⎬ ⎨ ⎬⎩⎩ ⎭x= Fd= F2 2dFy⎭ y vseal ⎩⎭x + y(3)17
2 2where F d is the friction force amplitude and u,v= { x, y} / x + y are the non-linearinput paths to the system, and derived from two original inputs (x and y) in the timedomain 1 . Thus, the system is represented as a four-input/two output equivalent modelshown in Figure 8, where D is the time derivative operator.xD 2 ( M + M + M ) + D( C + C ) + K+ F xs f <strong>SFD</strong> <strong>SFD</strong> sx sxxxxxuF dyD 2 ( M + M + M ) + D( C + C ) + Ks f <strong>SFD</strong> <strong>SFD</strong> sy syyyyy+F yvF dFigure 8 Elements of a four-input/two output representation of the non-linear mechanicalseal-<strong>SFD</strong> system [16]Periodic single frequency load excitations are represented as( )ωF () t = F cos( ωt) + F sin( ωt)= F − iF e = F ei t iωtx xc xs xc xs x( )ωF () t = F cos( ωt) + F sin( ωt)= F − iF e = F ei t iωty yc ys yc ys y(4)and the ensuing bearing displacement and accelerations for the model linear path inputs(i.e. x and y) are also periodic with identical frequency (ω), and expressed as⎧x⎫ ⎧x−ix⎫ ⎧x⎫ ⎧x⎫⎧a⎫Z e e e⎩ ⎭ ⎩ ⎭ ⎩ ⎭ ⎩ ⎭ ⎩ ⎭c s iωt iωt x iωt( ω) = ⎨ ⎬= ⎨ ⎬ = ⎨ ⎬ ; ⎨ ⎬=⎨ ⎬y yac−i ysy y y(5)In the frequency domain the system is represented as1 Recall that in the experiments, the excitation forces are the actual inputs and the displacements (x,y) andmodeled non-linear inputs (u, v) represent the outputs of the system.18
2( ω−ω− )F = L x + F u ; L = K − M + i Cx xx d xx sxs xx s xx2( ω ω )y−−F = L y + F v ; L = K − M + i Cy yy d yy s s yy s yy(6)whereM = M + M + M; M = M + M + M;s−xx <strong>SFD</strong>xxf s−yy <strong>SFD</strong>yyfC = C + C ; C = C + C ;−s xx <strong>SFD</strong>xxsx s yy <strong>SFD</strong>yysy−(7)and ( x, y), ( F , F ) are the discrete Fourier Transform (DFT) of time varyingxydisplacements and forces, respectively. L xx , L yy are the linear transfer functions containingthe stiffness, inertia and damping coefficients. ( uv) , represent the DFT of the model2 2non-linear inputs ({ x, y} / x + yT ), obtained by building the velocity vector ( x, y) Tconstructed using the Fourier coefficients of the displacement (x c , x s ). This procedureeffectively reduces signal noise.The dry friction force (F d ) can be identified from Eq.(6) using two single frequencyforce excitations with different amplitude levels provided that the force coefficients in Eq.(7) are independent of the vibration amplitude. However, this is not the case for the <strong>SFD</strong>since, as theory predicts and experimental results demonstrate [3], damping coefficientsare a function of the amplitude of journal motion. This dependency of the dampingcoefficient on the vibration amplitude is assumed to be linear for small differences isamplitudes, as shown in previous experimental work [3]. Thus, the squeeze film dampingforces are represented in the general form C <strong>SFD</strong>xx = a x x + b x and C <strong>SFD</strong>yy = a y y + b y , witha x,y and b x,y as generic constants. For multiple excitation load levels2( − )H = K − ω M + iωC + iω( a x + b ) + F Gi i ixx sxs xx sx x x d xx2( )y−i i iH = K − ω M + iωC + iω( a y + b ) + F G ; i=1... Nyy s s yy sy y y d yy(8)with19
HHixxiyyiiFxi u= ; Gi xx=ix xiiFyi v= ; Gi yy=iy y(9)where N is number of independent load excitations. The friction force is identified fromthree load excitations inducing three different orbit amplitudesFd=H + H −2HG G G1 3 2αα αα αα1 3 2αα+αα−2αα; α : x,y(10)with the superscripts (1,2,3) representing independent test with different excitationamplitudes. Note that the displacement differences are constant(i.e.1 2 2 3 1 2x x x x ; x x 0.05c− = − − ≈ )Once the friction force is identified, it can be used directly for any other excitationamplitude without any restrictions on orbit amplitude level since the friction force is onlya function of the seal assembly force (i.e. normal force). The parameters from the lineartransfer functions (L xx ,L yy ) are obtained from least square fits of their real and imaginaryparts, i.e.K − ω M = Re( L ) = Re( H −F G )2sxs−xx xx xx d xx( ω )C = Im( L ) = Im( H −F G )s−xx xx xx d xxK − ω M = Re( L ) = Re( H −F G )2sys−yy yy yy d yy( ω− )C = Im( L ) = Im( H −F G )s yy yy yy d yy(11)The squeeze film added mass and damping and damping coefficients are then extractedfromM = M −M −M<strong>SFD</strong>xx s−xx s fM = M −M −M<strong>SFD</strong>yy s−yy s fC = C−−C;C = C −C<strong>SFD</strong>xx s xx sx<strong>SFD</strong>yy s−yy sy(12)IV.3 Results: Dynamic force coefficientsThis section presents the identified force coefficients for the no thru-flowconfiguration and compares them to coefficients obtained for the previous test20
configurations including open outlets at the discharge groove (i.e. with thru-flow). Figure9 depicts the dry friction force (F d ) identified from the procedure outlined above. Theresults also include the dry friction coefficient (F d =53 N) identified, as in prior reports,from dry system tests (i.e. with no lubricant). Appendix A details the experimentalprocedure to obtain the dry friction force from dry system tests. The test results showgood correlation between both methods, with the current F d being ~2% larger than thatidentified via energy methods and in a lengthier two step procedure. Furthermore, thefriction force remains fairly constant throughout the test frequency range.80Friction Force [N]60402000 10 20 30 40 50 60 70 80Frequency [Hz]Fd (derived from Lxx)Fd (derived from Lyy)Fd (from dry tests)Figure 9 Dry friction force identified from circular centered orbits. Dotted line representsdry friction estimated from energy method and tests under dry conditions.Figure 10 shows, for the largest amplitude of orbital motion (50 μm), the real part ofthe linear path transfer function (L xx , L yy ) and the corresponding curve fit. Table 2presents the identified values of added mass coefficients and the average identified dryfriction force. The added mass results are similar to those obtained in the prior report [3]for the thru-flow configurations (within 15 %). The present results, just like the previousones, show large values of added mass coefficients (i.e. half the system mass) andevidence the importance of fluid inertia effects in <strong>SFD</strong>s.21
443ωC <strong>SFD</strong>xx3ωC <strong>SFD</strong>yyIm(Lxx) [MN/m]2C <strong>SFD</strong>xxIm(Lyy) [MN/m]2C <strong>SFD</strong>yy1C <strong>SFD</strong>xx (50 um) =8800 Ns/mr 2 =0.991C <strong>SFD</strong>yy (50 um) =7700Ns/mr 2 =0.9900 20 40 6000 20 40 60Frequency [Hz]Frequency [Hz]Figure 11 Imaginary part of linear impedance function versus excitation frequency. (C <strong>SFD</strong>xx )Circular centered orbits of amplitude x,y: 50 μm ( no thru-flow)Figure 12 shows the squeeze film damping coefficient (C <strong>SFD</strong>yy ) versus orbitamplitude. The figure also includes the coefficient (C <strong>SFD</strong>yy ) obtained from the thru-flowconfiguration using 2.8 mm flow restrictors [3], an improved damping prediction forsmall motions about a centered condition [17], and predictions based on the short lengthbearing model [18]. The error bars denote the uncertainty associated to each coefficientfollowing the uncertainty analysis detailed in Ref. [19]. The damping increases forincreasing orbit amplitudes as in the previous test configuration. Furthermore, the currentdamping coefficient is slightly larger (~10 %) but within the uncertainty of that reportedfor the thru-flow configuration using the 2.8 mm flow restrictors. Thus the damperoperating with no thru-flow is also effective. The improved damping prediction forcentered conditions (from Ref. [17]) is within the uncertainty values of the dampingcoefficient identified for the smallest orbit amplitude. These experimental results are ofinterest in applications that need fully sealed dampers and can contain the oil within thedamper land for extended periods of time (i.e. UAV application).Note, however, that the current test results correspond to laboratory tests maintaininga relatively constant temperature, ~ 2 0 C variation at <strong>SFD</strong> land and oil plenum (see Table1). The temperatures are maintained constant throughout the experiments due to theirshort duration (~ 30 min), the low level of energy input into the system (maximum power5.7 W- average work 3.1 kJ) and the large mass of oil (0.59 kg) in the inlet plenum abovethe damper land that together with other system components account for a thermal23
capacity of 4.1 kJ. In actual applications, with no-thru flow and with a limited volume ofoil, it would be necessary to consider the increase of oil temperature and thecorresponding viscosity reduction when estimating the system damping performance.Damping coefficient [kN.s/m] Cyy [kN.s/m]108642no thru-flowPrediction (centeredcondition) [17]2.8 mm flowrestrictor020 30 40 50 60Orbit amplitude [μm]Displacement [um]C <strong>SFD</strong>yyPrediction (open ends)Figure 12 Squeeze film damping coefficient (C <strong>SFD</strong>yy ) versus orbit amplitude. (CircularCentered Orbits, No thru-flow, flow restrictor: 2.8 mm [3])Figure 13 depicts the identified system and squeeze film damping coefficient versusexcitation frequency. The system damping coefficient, which includes the equivalentaction of dry friction, is frequency dependent and notably larger than the extractedsqueeze film damping coefficient. Also notice that the system damping is larger for thesmallest amplitude (i.e. 25 μm). These characteristics are distinctive of a system with dryfriction [3]. On the other hand, the squeeze film damping coefficients are independent ofthe frequency, and largest for the largest amplitude tested (i.e. 50 μm). These resultsindicate that the identification method is effective in discerning the squeeze film dampingcontribution from the overall system damping.24
Damping coefficient [kN.s/m]30252015105C s-xxC <strong>SFD</strong>xx50 μm38 μm25 μm50 μm 38 t μm 25 μm00 20 40 60 80Frequency [Hz]Damping coefficient [kN.s/m]30252015105C s-yyC <strong>SFD</strong>yy50 μm38 μm25 μm50 μm 38 t μm 25 μm00 20 40 60 80Frequency [Hz]Figure 13 Squeeze film damping coefficients (C <strong>SFD</strong>xx, C <strong>SFD</strong>yy ) and system dampingcoefficients (C s-xx, C s-yy ) versus excitation frequency for increasing orbit amplitudes.(Circular Centered Orbits, No thru-flow)25
V Onset amplitude and frequency leading to air ingestion andlubricant cavitation in test <strong>SFD</strong>This section presents results from single frequency load excitation experimentsconducted on the <strong>SFD</strong> test rig with closed outlet ports (i.e. no thru-flow). The staticpressure at the inlet plenum and the discharge groove are 3 psia (31 kPa). Periodic loadsexcite the <strong>SFD</strong> inducing circular centered orbits with radii ranging from 31 μm to 74 μm(i.e. from 25% to 60% of radial clearance). The experiments serve to identify the limitorbital motion amplitudes for onset of air ingestion and lubricant cavitation. Table 3summarizes the test conditions.Table 3 Test conditions for dynamic load tests (CCO). Lubricated <strong>SFD</strong>. No thru-flow.Inlet pressure (P s ) *31 kPaDischarge groove pressure (P r )* 31 kPaFrequency range20-120 Hz (5 Hz step)Lubricant temperature (T) 25 0 C-26 0 C (76 0 F-79 0 F)Viscosity (η)3.1 cP- 2.8 cPClearance (c)125-127 μm (4.9-5 mils)Orbit amplitude (e)31-69 μm (1.2-2.7 mils)Flow restrictors (hole diameter) No thru-flow.*: Gauge pressure.V.1 Experimental procedureSingle frequency dynamic loads excite the test system with constant circular orbitamplitudes for the given range of frequencies (5, 10 Hz increments). The test maximumfrequency for each orbit amplitude is limited by the shaker maximum force. Specifically,the experiments are halted once the shakers output force reaches 80% (360 N) of theirmaximum capacity (445 N). For the smallest orbit amplitude tested (32 μm) the systemwas excited up to 110 Hz, and up to 50 Hz for the largest amplitude tested (74 μm).Figures 14 through 16 depict the excitation forces and corresponding damper orbitsfor 32 μm, 50 μm and 74 μm at the highest frequency tested for each amplitude level (i.e.110 Hz, 90 Hz and 50 Hz), respectively. Figures 13 and 15 show a fairly circular load andcircular bearing orbits. Figure 14 shows a more elliptical orbit for the excitation load andresponse orbit of 50 μm. The ellipticity may be attributed to the structural orthotropy of26
the system (K sx = 853 kN/m, K sy = 885 kN/m) that becomes more evident for largeamplitude of motions.500Max. load445 N(366 N,328 N)250Y Load [N]− 500 − 250 0 250 500− 250− 500110 HzX Load [N]130Max.clearance127 μmY displacement [um]32 μm65− 130− 65 0 65 130− 65− 130X displacement [um]27
Figure 14 Excitation load and response orbits (motion) from experimental data. (110 Hz,Load: [N], displacement [μm], 32 μm)(402 N,311 N)500250Max. load445 NY Load [N]− 500 − 250 0 250 500− 250− 500X Load [N]13090 HzMax.clearance127 μmY displacement [um]50 μm65− 130− 65 0 65 130− 65− 130X displacement [um]Figure 15 Excitation load and response orbits (motion) from experimental data. (90 Hz,Load: [N], displacement [μm], 50 μm)28
(320 N,219 N)500250Max. load445 NY Load [N]− 500 − 250 0 250 500− 25<strong>07</strong>4 μm− 500X Load [N]1306550 HzMax.clearance127 μmY displacement [um]− 130− 65 0 65 130− 65− 130X displacement [um]Figure 16 Excitation load and response orbits (motion) from experimental data. (50 Hz,Load: [N], displacement [μm], 74 μm)29
V.2 Experimental ResultsFigure 17 shows the location of the dynamic pressure sensors. The two sensors arelocated at the mid-span of the <strong>SFD</strong> land and discharge groove, respectively.PressuretransducersSqueeze filmlandDischargegrooveFigure 17 Cut view of <strong>SFD</strong> housing detailing the location of pressure sensorsThe presence of air in the squeeze film land is evaluated by examining the peak-topeakpressures and the actual dynamic pressure waves. The presence air bubbles in thedamper land is associated with a decrease of the peak-to-peak dynamic pressure [20]. Airingestion and formation of bubbles can also be identified from the shape of the dynamicpressure wave. The presence of air bubbles in the damper land produces a flat pressurezone between the minimum and maximum pressure peaks. The length of this flat portionin the dynamic pressure wave is an indicative of the severity of air ingestion [20]. On theother hand, the deformation (flattening) of the low pressure peak is an indicative of oilvapor cavitation [7,20,21].Figure 18 shows the peak-to-peak values of the dynamic pressure at the squeeze filmland (c=127 μm). The peak pressures steadily increase with frequency and amplitude oforbital motion. Furthermore, the film pressure shows a linear dependency on theexcitation frequency with a constant slope for most of the test conditions. However, forthe lowest amplitude tested (32 um) the dynamic pressure significantly deviates from thelinear pattern (i.e. reduction of the slope) for frequencies above 90 Hz. Thus, at suchoperating conditions, it is likely the occurrence of oil cavitation or air entrapment into the30
damper film land. This can be further corroborated by examining the shape of thedynamic pressure waves.1.5Pk-Pk Pressure (bar)10.574 μm62 μm50 μm32 μm00 30 60 90 120Frequency (Hz)Figure 18 Peak-peak dynamic pressures in squeeze film land versus frequency andvarious orbit amplitudes.Figure 19 displays the peak-to-peak dynamic pressure recorded at the dischargegroove. The peak pressure remains nearly constant for frequencies up to 60 Hz, thenincreases as the excitation frequency increases. The pressure at the discharge grooverepresents around 30 % of the pressure measured at the land for the smaller excitationamplitude tested. For the lowest test frequency, the formation of the dynamic pressure atthe groove rapidly increases with frequency, and becomes comparable (up to 60 % for 32μm orbits) to the values of pressure generated in the film land.31
1.5Pk-Pk Pressure (bar)10.532 μm50 μm62 μm74 μm00 30 60 90 120Frequency (Hz)Figure 19 Peak-peak dynamic pressures in discharge groove versus frequency andvarious orbit amplitudes.Figures 20 through 23 show the dynamic pressure waves at the squeeze film land anddischarge groove for all the amplitude orbits (32 μm, 50 μm, 62 μm, 74 μm) at thehighest test frequencies. None of the figures shows evidence of oil cavitation (i.e.minimum peak pressure is not altered). In addition, there is not strong evidence of airingestion for the 50 μm and 62 μm orbit amplitudes at the maximum test frequencies (seeFigures 21 and 22). On the other hand, Figures 20 and 23 show the formation of a flatportion (uniform pressure) in the dynamic pressure wave between the transition fromminimum to maximum pressure, thus indicating the presence of air in the damper filmland [20]. Visual observations of the squeeze film land at such operating conditionsevidence the presence of small air bubbles at both operating conditions (Figures 20 and23). Although, it is possible that air is being ingested through the seal interface, visualinspection of the damper land during operation also suggests that air is ingested throughdifferent passages such as the juncture of the temperature and pressure sensors and thePlexiglas housing (see Figure 24). In addition, the severity of air ingestion is rather mildconsidering the short length of the flat region in between the peaks of the dynamic32
pressure 2 . Thus, the damper performance is not severely affected at such operatingconditions.Absolute Pressure [bar]21.751.51.2510.750.50.250Air ingestion400Pressure @ discharge groove300Film thicknessPressure @ <strong>SFD</strong> land100 Hz, 32 μm00 5 10 15 20time*w [rad]200100Film thickness [um]Figure 20 Dynamic pressure measurements at <strong>SFD</strong> land and discharge groove (includingfilm thickness at sensor location). (100 Hz, 32 μm orbit amplitude, supply pressure= 31kPa, no thru-flow)Absolute Pressure [bar]2400Pressure @ discharge groove1.7590 Hz, 50 μm1.53001.2512000.750.51000.25 Pressure @ <strong>SFD</strong> landFilm thickness000 5 10 15 20time*w [rad]Film thickness [um]Figure 21 Dynamic pressure measurements at <strong>SFD</strong> land and discharge groove (includingfilm thickness at sensor location). (90 Hz, 50 μm orbit amplitude, supply pressure= 31 kPa,no thru-flow)2 Digital videos of different levels of air ingestion and corresponding squeeze film pressure waves areshown in the <strong>Tribology</strong> group website (http://phn.tamu.edu/TRIB<strong>Group</strong>) [22].33
Absolute Pressure [bar]24001.75Pressure @ discharge groove 60 Hz, 62 μm1.53001.2512000.750.51000.25Pressure @ <strong>SFD</strong> landFilm thickness000 5 10 15 20time*w [rad]Film thickness [um]Figure 22 Dynamic pressure measurements at <strong>SFD</strong> land and discharge groove (includingfilm thickness at sensor location). (60 Hz, 62 μm orbit amplitude, supply pressure= 31 kPa,no thru-flow)Absolute Pressure [bar]21.751.51.2510.750.50.250Air ingestiontime*w [rad]Pressure @ discharge groove 400Film thicknessPressure @ <strong>SFD</strong> land50 Hz, 74 μm00 5 10 15 20300200100Film thickness [um]Figure 23 Dynamic pressure measurements at <strong>SFD</strong> land and discharge groove (includingfilm thickness at sensor location). (50 Hz, 74 μm orbit amplitude, supply pressure= 31 kPa,no thru-flow)34
ThermocoupleconnectionStatic pressureconnectionPipe fittingsFigure 24 Cut view of <strong>SFD</strong> showing likely paths for air ingestion.35
VI Conclusions and RecommendationsThis report describes the identification of force coefficients in a <strong>SFD</strong> with amechanical seal and evaluates the effectiveness of the seal in preventing air ingestion.The damper discharge ports are closed so there is no thru-flow. An identification methodis implemented to simultaneously identify the squeeze film force coefficients and thefriction force from the mechanical seal. The squeeze film damping coefficients areaccurately identified from a curve fit of the linear path transfer function Im(L xx L yy ),which evidences the effectiveness of the method in determining the non-linear viciouslikedamping contribution of the mechanical seal.The damper added mass coefficients are similar to those reported for the thru-flowconfiguration. The damper damping coefficients are a function of the orbital amplitudeand similar (10 % larger) to those reported for the damper thru-flow configuration. Theoil temperature remains relatively constant throughout the experiments despite there isno-thru lubricant flow. The temperature equilibrium during the tests is associated to thesmall duration of the tests, the small amount of work input into the system, and the largeamount of oil residing in the inlet plenum. In an actual application, i.e. damper operatingwith no thru-flow, the oil will heat up and the damping capacity will be greatly affected.In addition, tests are conducted to find the onset excitation amplitude and frequenciesleading to air ingestion. The results, for the maximum allowable loads, demonstrate noevidence of oil cavitation in the damper film land. On the other hand, for the largest testamplitude (74 um at 50 Hz) and the highest test frequency (32 um at 110 Hz), pressuremeasurements indicate the ingestion of air into the squeeze film land. Besides the sealinterface, visual observation evidences the ingestion of air through passages like thejuncture of the instrumentation facing the squeeze film land and discharge groove.However, the severity of the air ingestion is relatively small for the test excitationamplitudes and frequencies.The test results demonstrate that the damper is effective in avoiding air ingestion andits damping performance is not greatly affected. Thus, the <strong>SFD</strong> with closed outlet ports(i.e. no thru-flow) is a viable option for a UAV application. However, dampingpredictions should be accompanied with a thermal analysis based on the geometricconfiguration and operating conditions to predict the temperature variation of the oil. Inaddition, further tests have to be conducted to simulate other operation conditions like36
non-circular and off-centered orbits, for example. Also, tests need to be conducted forlarger contact forces at the seal interface and to evaluate their impact in the <strong>SFD</strong>performance.Future work will include tests with multiple frequency excitations to simulate actualoperating conditions in multi-spool engines. The identification method will be extendedto obtain the force coefficients from eccentric journal orbits with multiple frequencies.37
VII References[1] Delgado, A., and San Andrés, L., 2004, “Sealed end Squeeze Film Damper: Test rigDescription and Identification of Structural Parameters,” <strong>TRC</strong> report, <strong>TRC</strong>-<strong>SFD</strong>-1-04, May.[2] Delgado, A., and San Andrés, L., 2005, “Identification of Force Coefficients in aSqueeze Film Damper with a Mechanical Seal,” <strong>TRC</strong> report, <strong>TRC</strong>-<strong>SFD</strong>-1-05, May.[3] Delgado, A., and San Andrés, L., 2006, “Identification of Force Coefficients in aSqueeze Film Damper with a Mechanical Seal,” <strong>TRC</strong> report, <strong>TRC</strong>-<strong>SFD</strong>-1-06, May.[4] Della Pietra, L., and Adiletta, G., 2002,”The Squeeze Film Damper over Four Decadesof Investigations. Part I: Characteristics and Operating Features,” Shock Vib. Dig, 34(1), pp.3-26.[5] Della Pietra, L., and Adiletta, G., 2002,”The Squeeze Film Damper over Four Decadesof Investigations. Part II: Rotordynamic Analyses with Rigid and Flexible Rotors,” ShockVib. Dig., 34(2), pp. 97-126.[6] Defaye, C., Arghir, M., Carpentier, P., Bonneau, O., Debailleux, C., and Imbourg, F.,2005 “Experimental Investigation of the Design Parameters and of the Working Conditionson the Global Characteristics of a Squeeze Film Damper,” Proc. World Tribol. Cong.,Washington DC, p 287-288[7] Adiletta, G., Della Pietra, L., 2006, “Experimental Study of a Squeeze Film Damperwith Eccentric Circular Orbits,” J. Tribol., 128(2), 2006, pp. 365-377[8] Diaz, S., and San Andrés, L ,1999, “Method for Identification of Bearing ForceCoefficients and its Application to a Squeeze Film Damper with a Bubbly LubricantTribol. Trans., 42(4), , p 739-746[9] Rice, H.J., Fitzpatrick, J.A., 1991, “Procedure for the Identification of Linear and Non-Linear Multi-Degree-of-Freedom Systems,” J. Sound Vib., 149(3), pp. 397-411[10] Fitzpatrick, J. A., and Rice, H. J., 1988, “Simplified Partial Coherence Functions forMultiple Input/Output Analysis,” J. Sound Vib.,122(1), pp. 171-174[11] Rouvas, C., Murphy, B. T., and Hale, R. K., 1992, “Bearing Parameter IdentificationUsing Power Spectral Density Methods,” ImechE, C432, pp. 297-302.[12] Rice, H. J., and Xu, K. Q., 1996, “Linear Path Identification of General Non-LinearSystems,” Mech. Syst. Signal Process., 10(1), pp. 55-63.[13] Adams, D. E., and Allemang, R. J., 2000, “ A Frequency Domain Method forEstimating the Parameters of a Non-linear Structural Dynamic Model Through Feedback,”Mech. Syst. Signal Process., 14(4), pp. 637-656.[14] Yang, C., Adams, D. E., and Ciray, S., 2005, “System Identification of Non-linearMechanical Systems Using Embedded Sensitivity Functions,” J. Vib. Acoust. , 127(6), pp.530-541.[15] Yang, C., Adams, D. E., and Yoo, S. W., 2003, “ Diagnosing Vibration Problems withEmbedded Sensitivity Functions,” J. Sound Vib., 37(4), pp. 12-17.[16] San Andrés, L., and Aguilar, R., 2000, “Leakage and Dynamic Response of a HybridBrush Seal-Gas Damper Seal,” <strong>TRC</strong>-SEAL-3-00, Research Progress Report, <strong>Texas</strong> A&M38
<strong>University</strong>[17] San Andrés, L., and Delgado, A., 20<strong>07</strong>, “Parameter Identification of an End Sealed<strong>SFD</strong> Part II: Improved Predictions of Added Mass Coefficients for Grooved <strong>SFD</strong>s and OilSeals,” <strong>TRC</strong> report, <strong>TRC</strong>-<strong>SFD</strong>-2-<strong>07</strong>, May.[18] Zeidan, F.Y., San Andrés, L., and Vance, J. M., 1996, “Design and Application ofSqueeze Film Dampers in Rotating Machinery,” Proc. 25 th Turbomachinery Symposium,Houston, TX, pp.169-188.[19] San Andrés, L., and Delgado, A., 2006, “Identification of Force Coefficients in aSqueeze Film Damper with a Mechanical End Seal- Centered Circular Orbit Tests,” ASMEPaper No. IJTC2006-12041 (accepted for publication in ASME J. Tribol.)[20] Diaz, S., and L. San Andrés, 2001, "Air Entrainment Versus Lubricant Vaporization inSqueeze Film Dampers: An Experimental Assessment of their Fundamental Differences,”ASME J. Eng. Gas Turbines Power, 123(4), pp. 871-877.[21] Zeidan, F, and Vance, J., 1990, “ Cavitation Regimes in Squeeze Film Dampers andTheir Effect on the Pressure Distribution,” STLE Tribol. Trans., 33(3), pp. 447-453[22] San Andrés, L., 2006, “ <strong>Tribology</strong> <strong>Group</strong>,” <strong>Texas</strong> A&M <strong>University</strong>,http://phn.tamu.edu/TRIB<strong>Group</strong>/proj_<strong>SFD</strong>_air_ing.htm (accessed on 05/15/<strong>07</strong>)39
Appendix A Identification of dry friction force (dry system tests)The mechanical seal dry friction force is obtained from circular orbit tests withoutany lubricant in the system. The system is excited with two constant load levels (66, 78Ν) for six frequencies (20-35 Hz). Figure A1 depicts the excitation force anddisplacement orbit at 28 Hz.Following the procedure described in [3], the energy dissipated by the system isequated to the input work. Figure A2 shows the energy dissipated by the identifiedresidual damping (C rv ) and dry friction force (F μ ), and the work input into the system.20010<strong>07</strong>8 Ν66 ΝY Load [N]− 200 − 1000 100 200− 100− 200X Load [N]13080 μmMax.clearance127 μmY displacement [um]6555 μm− 130 − 650 65 130− 65− 130X displacement [um]Figure A 1 Recorded load and ensuing displacement orbits for two amplitude load levels.Clearance circle noted. (28 Hz, dry <strong>SFD</strong>, CCO)40
0.03Energy Dissipated [N.m]0.020.01020 25 30 35Frequency [Hz]Work (input force)Energy dissipated (c=230 (C rv =230 N.s/m, N.s/m, Ff=53 F μ =53 N) N)Figure A 2 Work exerted by input force (= dissipated energy) estimated from combineddamping model [3]. (Dry system tests)41