EPD - Axpo
EPD - Axpo
EPD - Axpo
- No tags were found...

Create successful ePaper yourself
Turn your PDF publications into a flip-book with our unique Google optimized e-Paper software.
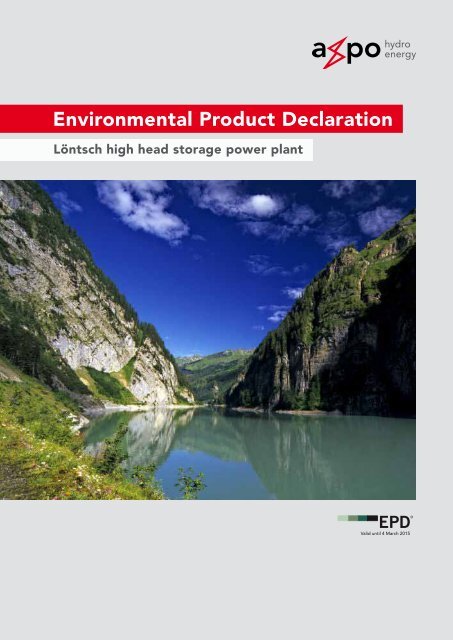
Environmental Product DeclarationLöntsch high head storage power plantValid until 4 March 2015
SummaryCompany<strong>Axpo</strong> AG, a wholly owned subsidiary of the <strong>Axpo</strong>Holding AG, is the leading Swiss electricityproducer. For more than 90 years, <strong>Axpo</strong> AG hasguaranteed a reliable supply of electricity. Hydro electric and nuclear power plants cover the baseload. Fluctuating demand and peak loads are balancedusing storage and pumped storage plants.Product and declared unitThe high head storage power plant on the Löntschis wholly owned by <strong>Axpo</strong> AG. Utilising head of 370 mand its 60 Megawatt (MW) installed capacity to producevaluable peak load energy, Löntsch PowerStation makes an important contribution to the electricityproduction requirements in North-EastSwitzerland.Verification of the results presentedThe complete material presented in this <strong>EPD</strong> ® hasbeen reviewed and certified by the accredited certificationbody Bureau Veritas Certification Sweden.Environmental impact of electricity generationin the Löntsch power plantThe Life-Cycle Assessmentt methodology has beenapplied to quantify the environmental impact. Itcomprises the full electricity generation process andall associated processes from “cradle to grave”.The main results of the Life-Cycle Assessment (LCA)are summarized in the table below. Further resultsincluding resource depletion and land usage as wellas information on biodiversity or hydrology are givenin the <strong>EPD</strong>.The declared product is 1 kilowatt hour (kWh) netelectricity generated by Löntsch power plant andthereafter distributed to a customer connected tothe <strong>Axpo</strong> AG network during the reference year2009/10 (1 October to 30 September).The International <strong>EPD</strong> ® SystemThe international <strong>EPD</strong> ® system managed by the International<strong>EPD</strong> Cooperation (IEC) is a Type III environmentaldecla ra tion programme according to ISO14025. The relevant governing documents in hierarchicalorder are PCR-CPC 17, General Pro gramme Instructionsfor environmental product declaration(<strong>EPD</strong>), ISO 14025 and ISO 14044. Electricity belongsto the product category UNCPC Code 17, Group171 – Electrical energy.Environmental impact Unit 1 kWh net electricity atLöntsch power plant1 kWh net electricity at<strong>Axpo</strong> AG customerGreenhouse gases (100 years) g CO 2 -equivalents 4.68 (4.13 to 6.28) 4.90 (4.39 to 6.53)Ozone-depleting gases g CFC-11-equivalents 2.66 · 10 –7 (1.78 · 10 –7 to 4.63 · 10 –7 ) 2.75 · 10 –7 (1.83 · 10 –7 to 4.55 · 10 –7 )Formation of ground-level ozone g ethylene-equivalents 2.97 · 10 –3 (2.42 · 10 –3 to 4.24 · 10 –3 ) 3.09 · 10 –3 (2.54 · 10 –3 to 4.54 · 10 –3 )Acidifying substances g SO 2 -equivalents 1.80 · 10 –2 (1.53 · 10 –2 to 2.28 · 10 –2 ) 1.88 · 10 –2 (1.61 · 10 –2 to 2.34 · 10 –2 )Eutrophying substances g PO 43–-equivalents 4.58 · 10 –3 (1.85 · 10 –3 to 1.75 · 10 –2 ) 4.74 · 10 –3 (1.99 · 10 –3 to 1.84 · 10 –2 )Depletion of fossil resources MJ-equivalents 5.61 · 10 –2 (4.79 · 10 –2 to 7.07 · 10 –2 ) 5.85 · 10 –2 (5.07 · 10 –2 to 7.32 · 10 –2 )All results are rounded.
The dam installationThe original Klöntal Lake was formed as the result ofa huge prehistoric landslide from the Wiggis massif inthe area where the Klöntal valley narrows betweenRhodannenberg and Sackberg. The reservoir capacityof the natural lake was increased by the constructionof an earth dam wall with an impermeable clay core.The dam wall lies on landslide debris compacted bynatural mud deposits. The dam is up to 110 m thickand up to 21.5 m high, while the crown of the dam is6 m thick and 220 m wide. The utilizable reservoircapacity is 39.8 million m 3 . For energy productiononly the additional reservoir capacity that was createdby the dam construction is used. The residualwater channel of the Löntsch leads from the Rhodannenbergdam about 5.1 km down to Netstal, where itmeets the water discharged from the power plant.One kilometre further downstream, the Löntsch flowsinto the Linth. A trumpet spillway in Lake Klöntaldischarges flood waters into the dam’s bottom outlettunnels with a maximum capacity of 47 m 3 /s. Thisprevents the dam from overflowing in the event ofexcessive inflows when the lake is already full. Thewater intakes for the Löntsch power plant are locatedaround 740 m west of the Rhodannenberg dam wellin the Ruestelchopf area. From the intakes, the utilizedwater flows along the 4 km long head race tothe surge tank. From here, the water flows throughsteel-lined pressure shaft and penstock into thedistribution pipes in the power station. After passingthrough the turbine, the water either flows through ashort tail race then into the Löntsch or is transferreddirectly to the lower-lying Dorfbach power plant.The power stationThe machine house contains two vertical-axis Francisturbines, each rated at a maximum of 40 MW. Anhorizontal-axis 8 MW Pelton turbine utilizes theconcessionary minimum discharge and produceselectricity for the plant’s own requirements. Thecapacity of the head race tunnels limits the maximumwater discharge rate to 20 m 3 /s. If both main turbinesare operated the maximum power available is 60 MW.On average, 120 million kWh are produced per year.The annual operation at maximum generator performanceis 2000 hours. The electricity generated isdistributed via <strong>Axpo</strong>’s 50-kV and 16-kV networks.Maintenance and serviceThe Löntsch power plant operator together withthe cantonal authorities are responsible for the maintainanceof the road along Lake Köntal. The powerplant staff are also responsible for keeping the shoresof the lake and the various picnic sites clean. To preservetrees growing around picnic sites, firewood isprovided for tourists and hikers in the summer months.The power plant operator is also responsible forthe maintenance of the hiking trails in the lake area.Access for maintenance and operation is either bymeans of the road to Lake Klöntal or the aerial cablewayup to the surge tank.
2 Manufacturer and product2.2.2 Electricity production life-cycle in theLöntsch power plantCore processes: construction, operation anddismantling of the power plantThe core processes involve the operation and theconstruction and dismantling of the power stationand all associated installations. The constructionincludes all the works associated with the reservoirand the production of the required materials: thebuilding of the dam wall, the intakes, the penstock,the power station, the surge tanks and the transportcableway, as well as the excavation of the head racetunnels. The energy required for the construction,mainly diesel fuel, is also included in the core process.The power plant was built between 1905 and1908. In 1975, some parts were refurbished: the powerstation, the surge tanks and the pressure tunnelswere rebuilt. Parts installed after the constructionwere also taken into consideration. This includes theturbines, cranes, generators, transformers, emergencypower supply and all the general electrical equipment.Operational inputs in the reference year includethe fuel used by vehicles and emergency generators,the oil required for heating the buildingsand the chemicals required during operations –mainly lubricating oil.Additionally, methane emissions are considered in thecore processes. Methane is formed mainly in lakesediments and may diffuse through the water columnto the lake surface or it is released as consequence ofwater turbining. Regarding the situation of lake Klöntal,methane emissions via the lake surface can onlybe partly attributed of the anthropogenic use ofhydropower as the lake had already been formedearlier by a natural landslide.Upstream processes: Preparation of the operatingmaterialsFor the purposes of this study the upstream processesrefer to the production of electricity and lubricating oilused as inputs to the core process.Downstream processes: distribution of electricityThe Löntsch power plant produces electricity, whichis fed into the <strong>Axpo</strong> AG inter-regional grid that supplieselectricity to consumers throughout the areacovered by the <strong>Axpo</strong> network. This distribution networkconsists of a total of 2006 km of high voltage(110/50 kV) and 60 km of medium voltage (16 kV)power lines. <strong>Axpo</strong> AG customers are usually publiclyownedelectric utilities in Switzerland that transformand distribute electricity to end customers. Duringthe reference year 2009/10, 16.5 Terrawatthours(TWh) electricity were distributed via the <strong>Axpo</strong> AGnetwork. Total losses due to the distribution within the<strong>Axpo</strong> AG network amounted to approximately 130gigawatt hours (GWh) in 2009/10, which correspondsto 0.8 %.Environmental Product Declaration8 I 9
3 Environmental impact declaration3.1 The Life-Cycle Assessment methodologyAccording to the ISO 14025 standard, the LCA methodologywas applied to quantify the global environmentalimpact. LCA is a clearly structured frameworkbased on international standards 2 that facilitates thequantification and assessment of emissions to theenvironment and re source usage along the entireelectricity production chain. The LCA findings includecomprehensive assessments of the overall energy,mass and emission flows and the proportionate contributionsof each of the key processes involved.Furthermore, it also provides quantification of significantenvironmental indicators, such as greenhousegas emissions. However, despite these advantages,there are some issues beyond the scope of an LCA.For example, the LCA study only takes into accountthe normal operating conditions and processes.Unusual process conditions such as accidents areexcluded. Additionally, while attempting to considerthe “big picture” or total process chain, one caneasily loose sight of the local environmental effectse.g. the impact on flora and fauna in the immediatevicinity of the power plant. Finally, an LCA study onlyquantifies environmental impacts; no economic, socialor ethical aspects are considered.3.2 System boundaries, allocations,and data sourcesThe LCA comprises the full plant life-cycle and associatedprocesses from ”cradle to grave”, starting withthe construction of the plant and the installation ofthe equipment, followed by the operation of the plantand ending with the dismantling and restoration ofthe original conditions. The reference period is the2009/10 year. The period chosen covers one businessyear of the Löntsch power plant. The figure below is asimplified process chain with system boundaries forthe LCA of electricity from the Löntsch power plant.Upstream processes Core processes Downstream processesConstruction anddecommissioning ofthe power plant, e. g.power house and damInfrastructureProduction of chemicalsand electricityOperation of theLöntsch power plantDistribution inthe <strong>Axpo</strong> AG networkLCA system boundariesInstallations (e. g. turbinecomponents, cranes,generators, transformers)Simplified process chain of electricity generation and distribution from Löntsch power plant during the reference year 2009/10.2 ISO 14040 and ISO 14044 as well as Product Category Rules, PCR-CPC17
3 Environmental impact declarationData for all processes in the process chain presentedabove were gathered from the original constructionplans or provided directly by the operating personnelof the Löntsch power plant. These data provide areliable basis for an LCA study. For the calculation ofthe LCA results, all available data were used withouta cut-off for supposedly unimportant data. Relevantdata on material and energy supply (power mix, heatand process steam), building material supply (e.g.steel and concrete production), transport servicesand waste treatment processes were taken from theecoinvent database 3 . The ecoinvent database is ajoint initiative of institutes and departments of theSwiss Federal Institute of Technology and providesconsistent, transparent and quality-assured Life-CycleInventory (LCI) data.3.2.1 Core processesAll the materials used for the construction of theLöntsch Power Plant (stone and clay) as well as theenergy used for digging the head race tunnels wererecorded in detail and published in a special editionof the Schweizerische Bauzeitung 4 (Swiss ConstructionNewspaper) as early as 1910. The volumes ofmaterials used for the new power plant constructionsundertaken in 1975 were estimated by experts. Thelife span of the plant was assumed to be 80 years. Theassessment of the type and quantities of materialsrequired for the installations (turbines, generatorsand electrotechnology etc.) was made by the operatingpersonnel. A specific, technical life span wasestimated for each installation. The amounts of fueland consumption of auxiliary materials were takenfrom internal records.Methane emissions were measured in 2011 applyingvarious methods. The measuring program was performedby the Swiss Federal Institute of AquaticScience and Technology EAWAG 5 . The specific methaneemission factors vary between 0.3 to 3.1 mg CH 4m -2 d -1 depending on the applied measuring method.According to EAWAG this result corresponds totypical emission factors found in alpine lakes.3.2.2 Upstream processesData on the impact of the production of heating oil,fuel and auxiliary materials as well as the assumptionsabout the electric power mix for the operationalneeds of the power station were taken from the ecoinventdatabase.3 ecoinvent database 2007, Swiss Centre for Life-Cycle Inventories, http://www.ecoinvent.org4 ”Elektrizitätswerk am Löntsch, Baden”, in Schweizerische Bauzeitung, Band LV and LVI, 19105 Report “Methane emissions from lake Klöntal„, EAWAG, January 2012Environmental Product Declaration10 I 11
3.2.3 Downstream processesComprehensive data on the operation of the <strong>Axpo</strong> AGdistribution grid, such as distribution losses or SulphurhexafluorideSF 6 emissions was available. Swiss-specificdata on the construction and decommissioning of thehigh voltage and medium voltage transmission gridwas taken from the ecoinvent database. Generic transportdistances for the consumption of auxiliary materialswere used likewise based on ecoinvent data.3.3 Ecoprofile of electricity generationResults of the LCA are presented in the Ecoprofiletables below and then discussed in greater depththereafter. More detailed LCA results were availableto the certifying body. Quantities are expressed perdeclared unit 1 kWh generated electricity (net) atLöntsch power plant during the reference year2009/10. The annual electricity production in theLöntsch reservoir power station varies greatly dependingon the meteorological conditions whichdetermine the water collection in the catchment areaof Lake Klöntal. Therefore, this report also declaresan annual operational average kWh i. e. the annualaverage net production of 1 kWh of electricity overthe past ten years of operation.The ecoprofile consist of various types of LCA resultsthat can be summarized in three categories:• Life-Cycle Inventory (LCI) results:Inventory results are direct emissions to and resourceconsumption from the environment. Examplesof inventory results are CO 2 emissions orthe quantities of copper used.• Life-Cycle Impact Assessment (LCIA) results:In the impact assessment, inventory results thatcontribute to the same environmental impact (e.g.climate change due to increasing greenhouse gasconcentrations in the atmosphere) are grouped andtheir importance in relation to a specific basic substanceis characterized with a factor (e.g. globalwarming potential of greenhouse gases in relationto CO 2 ).• Material flows:This category includes waste material and materialrecycling processes and flows.
3 Environmental impact declarationEcoprofile –Resource useUnitUpstreamprocessesCore processesoperationCore processesinfrastructurePer kWh atpower plantPer kWh atcustomerNon-renewable material resourcesGravel and sand g 1.71 · 10 –1 7.89 · 10 –3 2.81 · 10 1 2.83 · 10 1 2.85 · 10 1Calcite g 3.36 · 10 –2 8.88 · 10 –4 1.79 1.83 1.85Iron g 8.36 · 10 –3 8.33 · 10 –4 4.85 · 10 –1 4.95 · 10 -1 5.28 · 10 -1Clay g 8.89 · 10 –3 2.83 · 10 –4 6.59 6.60 6.66Nickel g 7.92 · 10 –4 2.11 · 10 –5 2.70 · 10 –2 2.79 · 10 –2 2.84 · 10 –2Chromium g 3.38 · 10 –4 6.41 · 10 –6 1.02 · 10 –2 1.06 · 10 –2 1.07 · 10 –2Barite g 4.62 · 10 –4 3.44 · 10 –4 7.76 · 10 –4 1.58 · 10 –3 1.65 · 10 –3Aluminium g 5.95 · 10 –4 6.24 · 10 –6 6.80 · 10 –3 7.40 · 10 –3 1.54 · 10 –2Fluorite g 1.97 · 10 –4 5.72 · 10 –6 1.67 · 10 –4 3.70 · 10 –4 3.99 · 10 –4Copper g 6.53 · 10 –4 1.01 · 10 –5 2.60 · 10 –2 2.67 · 10 –2 2.77 · 10 –2Magnesite g 9.47 · 10 –5 1.10 · 10 –5 7.16 · 10 –3 7.27 · 10 –3 7.34 · 10 –3Zinc g 1.08 · 10 –5 2.31 · 10 –6 2.63 · 10 –4 2.76 · 10 –4 3.64 · 10 –4Kaolinite g 1.05 · 10 –5 5.91 · 10 –8 5.88 · 10 –5 6.94 · 10 –5 7.09 · 10 –5Uranium g 1.46 · 10 –4 1.41 · 10 –7 7.14 · 10 –6 1.53 · 10 –4 1.55 · 10 –4Zirconium g 1.07 · 10 –9 1.02 · 10 –10 3.96 · 10 –9 5.13 · 10 –9 5.36 · 10 –9Renewable material resourcesWood m 3 7.88 · 10 –8 2.25 · 10 –10 2.04 · 10 –8 9.18 · 10 –8 9.53 · 10 –8Non-renewable fossil energy resourcesHard coalMJ- 8.34 · 10 –3 6.04 · 10 –5 1.62 · 10 –2 2.46 · 10 –2 2.59 · 10 –2equivalentsCrude oilMJ- 2.78 · 10 –3 3.99 · 10 –3 7.95 · 10 –3 1.47 · 10 –2 1.53 · 10 –2equivalentsNatural gasMJ- 6.34 · 10 –3 2.47 · 10 –4 4.06 · 10 –3 1.07 · 10 –2 1.10 · 10 –2equivalentsLigniteMJ- 4.66 · 10 –3 2.38 · 10 –5 1.10 · 10 –3 5.79 · 10 –3 5.94 · 10 –3equivalentsRenewable energy resourcesEnergy, in biomass kWh 2.02 · 10 –4 6.64 · 10 –7 5.98 · 10 –5 2.63 · 10 –4 2.72 · 10 –4Converted kinetic energy inwind powerkWh 5.38 · 10 –5 2.74 · 10 –7 1.22 · 10 –5 6.62 · 10 –5 6.72 · 10 –5Converted potential energy inhydropowerkWh 4.17 · 10 –3 1.23 3.85 · 10 –4 1.23 1.24Converted solar energy kWh 3.85 · 10 –6 5.02 · 10 –9 2.41 · 10 –7 4.10 · 10 –6 4.14 · 10 –6Electricity consumption inLöntsch PPkWh – 2.44 · 10 –2 – 2.44 · 10 –2 2.71 · 10 –2Use of recycled materialAluminium scrap g 2.27 · 10 –4 3.38 · 10 –6 2.44 · 10 –3 2.67 · 10 –3 5.92 · 10 –3Iron scrap g 4.99 · 10 –3 5.39 · 10 –4 3.30 · 10 -1 3.36 · 10 –1 3.46 · 10 –1Copper scrap g 2.06 · 10 –4 3.20 · 10 –6 8.24 · 10 –3 8.45 · 10 –3 8.76 · 10 –3Lead scrap g 1.18 · 10 –4 1.81 · 10 –6 2.68 · 10 –5 1.47 · 10 –4 4.69 · 10 –4Other scrap from electronicdevicesg 1.49 · 10 –7 2.28 · 10 –8 3.38 · 10 –2 3.38 · 10 –2 3.41 · 10 –2Other recycled metal g 3.65 · 10 –9 1.17 · 10 –10 3.05 · 10 –9 6.81 · 10 –9 7.01 · 10 –9Water consumptionFreshwater g 1.01 · 10 2 9.64 · 10 -1 6.91 · 10 1 1.71 · 10 2 1.76 · 10 2Saltwater g 4.79 8.53 · 10 –2 5.80 · 10 -1 5.46 5.55Water for turbining m 3 9.23 · 10 –2 1.20 1.33 · 10 –2 1.30 1.31Environmental Product Declaration12 I 13
Ecoprofile –Pollutant emissionsUnitUpstreamprocessesCore processesoperationCore processesinfrastructurePer kWh atpower plantPer kWh atcustomerAirborne emissions – impact assessment resultsGreenhouse gases (100 years) g CO 2 - 1.54 4.99 · 10 –1 2.64 4.68 4.90equivalentsOzone-depleting gases g CFC-11-equivalents1.05 · 10 –7 3.87 · 10 –8 1.22 · 10 –7 2.66 · 10 –7 2.75 · 10 –7Formation of ground-levelozonegethyleneequivalentsAcidifying substances g SO 2 -equivalents5.99 · 10 –4 2.95 · 10 –4 2.07 · 10 –3 2.97 · 10 –3 3.09 · 10 –36.19 · 10 –3 6.21 · 10 –4 1.12 · 10 –2 1.80 · 10 –2 1.88 · 10 –2Airborne emissions contributing to given impact assessment resultsAmmonia g 2.92 · 10 –5 5.35 · 10 –6 2.29 · 10 –4 2.63 · 10 –4 2.74 · 10 –4Carbon dioxide, fossil g 1.44 2.97 · 10 -1 2.49 4.22 4.37Carbon monoxide, biogenic g 1.75 · 10 –5 4.74 · 10 –8 7.39 · 10 –6 2.50 · 10 –5 2.92 · 10 –5Carbon monoxide, fossil g 7.81 · 10 –4 7.24 · 10 –4 1.58 · 10 –2 1.73 · 10 –2 1.89 · 10 –2Dinitrogen monoxide g 9.89 · 10 –5 5.55 · 10 –6 4.97 · 10 –5 1.54 · 10 –4 1.58 · 10 –4Methane, bromodifluoro-,Halon 1211g 8.45 · 10 –9 5.09 · 10 -11 4.77 · 10 –9 1.33 · 10 –8 1.36 · 10 –8Methane, bromotrifluoro-,Halon 1301g 2.16 · 10 –9 3.64 · 10 –9 7.08 · 10 –9 1.29 · 10 –8 1.34 · 10 –8Methane, biogenic, total g 2.13 · 10 –4 8.39 · 10 –3 1.84 · 10 –5 8.62 · 10 –3 8.69 · 10 –3Methane, biogenic, from lakeKlöntal and PPg – 8.39 · 10 –3 – 8.39 · 10 –3 8.46 · 10 –3Methane, fossil g 2.63 · 10 –3 2.79 · 10 –4 4.29 · 10 –3 7.19 · 10 –3 7.51 · 10 –3Nitrogen oxides g 2.68 · 10 –3 5.38 · 10 –4 6.69 · 10 –3 9.90 · 10 –3 1.02 · 10 –2NMVOC, non-methanevolatile organic compoundsg 3.04 · 10 –4 1.93 · 10 –4 1.22 · 10 –3 1.72 · 10 –3 1.77 · 10 –3Sulphur dioxide g 4.80 · 10 –3 3.43 · 10 –4 7.49 · 10 –3 1.26 · 10 –2 1.32 · 10 –2Other relevant non-radioactive airborne emissionsCarbon dioxide, biogen g 9.20 · 10 –2 2.57 · 10 –4 3.69 · 10 –2 1.29 · 10 –1 1.32 · 10 –1Particles, 10 µm g 9.55 · 10 –4 2.02 · 10 –5 4.29 · 10 –3 5.27 · 10 –3 5.54 · 10 –3Arsenic g 2.25 · 10 –7 4.48 · 10 –9 6.77 · 10 –6 7.00 · 10 –6 7.26 · 10 –6Cadmium g 7.11 · 10 –8 4.46 · 10 –9 2.26 · 10 –6 2.34 · 10 –6 2.42 · 10 –6Dioxins g 2.05 · 10 –13 1.60 · 10 –14 5.88 · 10 –12 6.10 · 10 –12 6.36 · 10 –12PAH, polycyclic aromatichydrocarbonsg 1.28 · 10 –7 4.26 · 10 –9 9.30 · 10 –7 1.06 · 10 –6 1.69 · 10 –6Radioactive airborne emissionsCarbon 14 kBq 2.84 · 10 –4 2.60 · 10 –7 1.31 · 10 –5 2.98 · 10 –4 3.01 · 10 –4Krypton (all isotopes) kBq 1.01 · 10 –4 1.06 · 10 –7 5.21 · 10 –6 1.06 · 10 –4 1.07 · 10 –4Radon (all isotopes) kBq 1.11 · 10 –1 1.09 · 10 –4 5.39 · 10 –3 1.16 · 10 –1 1.17 · 10 –1Waterborne emissions – impact assessment resultsEutrophying substances g PO3- 4 - 8.87 · 10 –4 9.56 · 10 –5 3.59 · 10 –3 4.58 · 10 –3 4.74 · 10 –3equivalentsWaterborne emissions contributing to given impact assessment resultsPhosphate g 4.77 · 10 –4 3.40 · 10 –6 2.58 · 10 –3 3.06 · 10 –3 3.17 · 10 –3COD, Chemical OxygenDemandg 8.12 · 10 –4 8.60 · 10 –4 1.97 · 10 –3 3.65 · 10 –3 3.81 · 10 –3
3 Environmental impact declarationEcoprofile –Pollutant emissionsUnitUpstreamprocessesCore processesoperationCore processesinfrastructurePer kWh atpower plantPer kWh atcustomerOther relevant non-radioactive waterborne emissionsAmmonium, ion g 1.73 · 10 –5 4.13 · 10 –7 6.37 · 10 –6 2.41 · 10 –5 2.47 · 10 –5Nitrate g 6.48 · 10 –5 8.46 · 10 –7 8.02 · 10 –5 1.46 · 10 –4 1.51 · 10 –4Sulphate g 8.78 · 10 –3 5.53 · 10 –5 2.79 · 10 –2 3.68 · 10 –2 3.80 · 10 –2Oil g 2.52 · 10 –4 2.69 · 10 –4 5.57 · 10 –4 1.08 · 10 –3 1.13 · 10 –3Radioactive waterborne emissionsTritium H3 kBq 8.24 · 10 –2 9.83 · 10 –5 4.85 · 10 –3 8.74 · 10 –2 8.84 · 10 –2Other relevant non-radioactive emissions soilOil g 2.63 · 10 –4 2.74 · 10 -4 5.45 · 10 –4 1.08 · 10 –3 1.13 · 10 –3Ecoprofile –Waste and material subjectto recyclingUnitUpstreamprocessesCore processesoperationCore processesinfrastructurePer kWh atpower plantPer kWh atcustomerHazardous waste – radioactiveSF/HLW/ILW in final repository m 3 6.47 · 10 –11 6.93 · 10 –14 3.46 · 10 –12 6.82 · 10 –11 6.90 · 10 –11LLW in final repository m 3 3.01 · 10 –10 2.90 · 10 –13 1.46 · 10 –11 3.16 · 10 –10 3.19 · 10 –10Hazardous waste – non-radioactiveHazardous waste toincinerationg 5.03 · 10 –4 2.32 · 10 –3 1.21 · 10 –2 1.49 · 10 –2 1.53 · 10 –2Other wasteNon-hazardous waste tolandfillNon-hazardous waste forrecyclingNon-hazardous waste forincinerationg 1.66 · 10 –1 1.65 · 10 –3 5.16 · 10 –1 6.84 · 10 –1 7.21 · 10 –1g 2.02 · 10 –14 4.39 · 10 –15 1.41 · 10 1 1.41 · 10 1 1.42 · 10 1g 5.03 · 10 –4 2.32 · 10 –3 1.21 · 10 –2 1.49 · 10 –2 1.53 · 10 –2Environmental Product Declaration14 I 15
3.4 Uncertainty analysisThe purpose of the uncertainty analysis is to quantifythe variability of the calculated life-cycle assessmentresults. The variability results from the factthat the input and output parameters for the entireprocess chain (e.g. annual electricity production,methane emissions) are not precise values, but canfluctuate instead. To this end, probability distributionsare assigned to the values of input and outputparameters. Probability distributions were takenfrom the ETH ecoinvent database for all backgroundprocesses 6 . Additional probability distributions weredefined for the most important processes modeledin the present study. For example, the annual electricityproduction of the Löntsch power plant andmethane emissions from lake Klöntal are dominantwith regard to most of the life cycle impact assessmentcategories. To define the variability of theseparameters, data of annual electricity productionover the past ten years were used as a basis. Regardingmethane emissions, emission factors of thedifferent measuring methods were used as well asassumptions regarding the influence of the anthropogenicuse of lake Klöntal are considered. Thetable below summarizes the main assumptions usedfor the scenarios in the uncertainty analysis.Reference scenario for theoperating year 09/10Scenario minimal environmentalimpactScenario maximumenvironmental impactMethane emission factor 3 mg m -2 d -1 0.2 mg m -2 d -1 3 mg m -2 d -1Surface of lake Klöntalwhich is affected by theelectricity productionChanges in surface area due topower plant operation (1.9 km 2 )Changes in surface area due topower plant operation (1.9 km 2 )Total surface area of lake Klöntal(3.3 km 2 )Annual methaneemissions0.69 Tons 0.14 Tons 3.61 TonsElectricity production 104.9 GWh (10a average) 122.1 GWh (2010/11) 85.8 GWh (2009/10)All results are rounded.In order to calculate the variability of the life cycleimpact assessment results, repeated random samplingusing a Monte Carlo algorithm was performed.The uncertainty range is defined in this study as the95 % interval of the sampled distribution. Hence, theminimum value is determined as the 2.5 th percentileand the maximum value as the 97.5 th percentile.Results of the Monte Carlo analysis are given in thetables below.1 kWh net electricity at Löntsch power plantEnvironmental impact Unit Value calculatedwithout uncertaintyAll results are rounded.Median(50 th percentile)Minimum value(2.5 th percentile)Greenhouse gases (100 years) g CO 2 -equivalents 4.68 5.14 4.13 6.28Maximumvalue (97.5 thpercentile)Ozone-depleting gases g CFC-11-equivalents 2.66 · 10 –7 2.69 · 10 –7 1.78 · 10 –7 4.63 · 10 –7Formation of ground-levelozoneg ethylene-equivalents 2.97 · 10 –3 3.10 · 10 –3 2.42 · 10 –3 4.24 · 10 –3Acidifying substances g SO 2 -equivalents 1.80 · 10 –2 1.87 · 10 –2 1.53 · 10 –2 2.28 · 10 –2Eutrophying substances g PO 43--equivalents 4.58 · 10 –3 3.31 · 10 –3 1.85 · 10 –3 1.75 · 10 –2Depletion of fossil resources MJ-equivalents 5.61 · 10 –2 5.81 · 10 –2 4.79 · 10 –2 7.07 · 10 –26 Ecoinvent report No 1, Overview and Methodology, published by the Swiss Centre for Life Cycle Inventories 2007
3 Environmental impact declaration1 kWh net electricity at <strong>Axpo</strong> AG customerEnvironmental impact Unit Value calculatedwithoutuncertaintyAll results are rounded.Median(50 th percentile)Minimum value(2.5 th percentile)Greenhouse gases (100 years) g CO 2 -equivalents 4.90 5.34 4.39 6.53Maximumvalue (97.5 thpercentile)Ozone-depleting gases g CFC-11-equivalents 2.75 · 10 –7 2.79 · 10 –7 1.83 · 10 –7 4.55 · 10 –7Formation of ground-levelozoneg ethylene-equivalents 3.09 · 10 –3 3.24 · 10 –3 2.54 · 10 –3 4.54 · 10 –3Acidifying substances g SO 2 -equivalents 1.88 · 10 –2 1.95 · 10 –2 1.61 · 10 –2 2.34 · 10 –2Eutrophying substances g PO 43--equivalents 4.74 · 10 –3 3.41 · 10 –3 1.99 · 10 –3 1.84 · 10 –2Depletion of fossil resources MJ-equivalents 5.85 · 10 –2 6.08 · 10 –2 5.07 · 10 –2 7.32 · 10 –23.5 Dominance analysis and conclusionsThe contribution of the different life-cycle stages tothe overall results are shown in the figure below forall life-cycle impact categories. The life-cycle stagescomprise:• Upstream processes: Production of electricityfrom grid and lubricants.• Core processes operation: Use of heating oiland diesel as well as methane emissions from lakeKlöntal and from turbined water.• Core processes infrastructure: Materials andenergy used for construction and dismantling ofthe power station (dam, power house etc.) and theinstallation of components in the power station(turbines, generators etc.).• Downstream processes: Distribution of electricitywithin the <strong>Axpo</strong> grid.Dominance analysisGreenhouse gases (100 years)Ozone-depleting gasesFormation of ground-level ozoneAcidifying substancesEutrophying substancesDepletion of fossil resources0% 10% 20% 30% 40% 50% 60% 70% 80% 90% 100%Upstream processesCore processes operationCore processes infrastructureDownstream processesEnvironmental Product Declaration16 I 17
The overall comparison of the life-cycle stagesshows that upstream processes as well as infrastructureand installations of the power plant contributemost to the total environmental impact.Regarding the upstream process, the production ofelectricity from grid used for operational purposes isdominant. The storage power plant Löntsch operatesat full power for roughly 2000 hours per year.During this time the internal operational power requirementsare covered. At other times the plant’sown needs are drawn from the grid.For the infrastructure, the most important process isthe production of cement. For the installations, thedecisive factors are the production of copper for thegenerators and steel for the turbines and the penstock.The life-cycle stages operation as well as distributionare of minor importance. The operation alsoincludes methane emission from lake Klöntal andfrom turbining. In the impact category greenhousegases fossil carbon dioxide dominates with a 90 %-share. Biogenic methane contributes with 4 % to theoverall result only.
4 Additional environmental information4.1 Land useThe operation activities related to the Löntsch PowerPlant changed the original land use. So, in accordancewith the PCR instructions, the difference in land usebefore and after exploitation is systematically classifiedand quantified using the land classes (CLC) ofthe EU CORINE programme 7 . Part of the CORINEprogramme, launched by the European Commissionin 1985, is the recording of land cover across Europeusing a common nomenclature. The system has 44classes and three hierarchical levels (e.g. use forindustry, mining or forestry). Land transformation forthe Löntsch Power Plant is presented in the Tablebelow.In this study, the time of occupation is assumed tobe 80 years, which refers to technical lifetime of thepower plant. The main activity on the occupied areais the use of the artificially enlarged lake as reservoirfor the production of electricity. Occupied industrialarea consists of the dam surface as well as the surfaceof the power house and other buildings used for theoperation of the power plant.CORINE land cover class Situation before exploitation Situation after exploitationPasture and meadow 1.92 km 2 0 km 2Natural water bodies 1.4 km 2 1.4 km 2Artificial water bodies 0 km 2 1.9 km 2Industrial area 0 km 2 0.02 km 2All results are rounded.4.2 Hydrology, river morphology andhydrogeology4.2.1 HydrologyLake Klöntal is a seasonal reservoir which is filledafresh three to four times during the year. The lakelevel varies between 829 m above sea level (asl) and847 m asl. However, the lake surface is only loweredto the minimum level during maintenance work. Aminimum level of 844.50 m asl is always maintainedbetween the 1 July and 31 October. The picturesbelow allow a comparison of the natural Lake Klöntalprior to 1905 and the lake today at maximum reservoircapacity. The pre-1905 picture also shows theentrance to the corporation tunnels of the StreamAssociates (an association of the water-poweredfactories in Netstal) who used the water of Lake Klöntalprior to 1900 to power their spinning mills andother factories in Netstal.Comparison of the natural Lake Klöntal around 1900 (left) with the modern lake at highest water levels in July 2010 (right). In the picture on theleft, you can see the entrance to the corporation tunnels at the bottom right.7 Coordination of Information on the Environment: http://terrestrial.eionet.europa.eu/CLC2000/classesEnvironmental Product Declaration18 I 19
The higher reservoir level that was created by theconstruction of the dam wall, submerged some land –mainly on the south-eastern and the north-easternbanks. In total 1.9 km 2 of terrestrial habitat was lost.There were also areas around the confluences of theRichisauer- and Rossmaterklön, and the Sulzbach onthe south-western end of the lake that were alsoflooded.Originally, the Löntsch only flowed out of the lake(over the natural dam that was created by a hugeprehistoric rock slide) when there was enough waterinflowing via the river Klön (the confluence of theRichisauer- and Rossmatterklön) and the Sulzbachstream. Winter freezing means that Lake Klöntal oftenhas no inflows at all – both in its original and presentcondition. Therefore there was no year-round waterflow in the Löntsch in the natural state either. Today,only the extra storage capacity created by raising thereservoir height is used for electricity production.Consequently, the topographical relationships (i. e.the natural dam created by a rock slide) and the waterlevel in the residual channel in winter months has notchanged.From the bottom outlet tunnels, 10 l/s are permanentlyreleased to irrigate the amphibian biotope,which is directly below the dam. The Löntsch itself isfed by the Schletterbach which lies 180 m below thedam and from other springs. The Schletterbach flowsmainly after heavy precipitation and when snow ismelting. Along the flowing section of the Löntsch inthe Löntschtobel ravine, there are some 20 springswhich flow into the Löntsch increasing its flow rate. Itis highly likely that these springs are fed by undergroundseepage from Lake Klöntal. Further smallstreams and rivulets flow into the Löntsch as far asthe Löntschtobel ravine: most of them only flow afterheavy precipitation.The water is returned to the river after use at thepower station in Netstal. The water users downstreamof the Löntsch power station take their water directlyfrom the outlet channel (tailrace) so that not all thewater that passes through the turbines is returned tothe Löntsch. Between the water outlet and the confluencewith the river Linth, over a distance of about1 km, the water flow rates vary with the operation ofthe power plant. With the implementation of currentdraft laws such sudden changes in waterflows willbe reduced in future based on requirements and possibilities.The short section between the water outletand the confluence with the Linth runs through thevillage of Netstal. In this section, the river bed andbanks are extensively reinforced for flood protection.From the confluence onwards the variations in theLöntsch are absorbed by the much larger flows of theLinth.4.2.2 River morphologyIn the river bed of the Klön (above the lake) as faras Lake Klöntal various hydraulic engineering workswere carried out in harmony with nature. The rivermorphology of the Löntsch has been slightly modifiedfor a roughly 800 m section starting at the dam. Inthis river section, bank protection measures andbridge foundations affect the river morphology. Thefollowing section, as far as the exit of the gorge atRiedern is in a more or less natural state. There arepronounced changes in the river width and the bed isin a natural condition, with the exception of one fisherybarrage. Bed load enters the stream via the manygullies and scree slopes that transport large quantitiesof gravel into the Löntsch during heavy precipitation.In the gorge, the river banks are almost completelyfree of vegetation. Otherwise there is typicalnative riverside vegetation with softwoods and mixeddeciduous forests. From Riedern to the confluencewith the Linth, there are mainly man-made river banksto protect against flooding.4.2.3 Ground water and springsAlong the residual channel of the Löntsch, groundwaterprotection measures were decreed 8 . The watermanagement of the Löntsch does not affect thesprings, as most of them are fed by undergroundseepage from Lake Klöntal. After the reservoir levelwas increased, the flow rates in the springs probablyincreased. The quality of the water in the tappedsprings is good.8 Ecogis, www.ecogis.admin.ch of 6 October 2010
4 Additional environmental information4.3 Biodiversity4.3.1 Federal inventory of nationalsignificance in KlöntalThe Klöntal valley provides a habitat for many differentanimal and plant species. Rear Klöntal consistsof a riparian forest of about 18 hectares, which is ofnational significance 9 . The formation of a riparian forestwas enhanced by the increased reservoir heightwhich raised the ground water levels. This riparianarea includes the streams that flow into Lake Klöntal,namely the Richisauerklön and the Rossmatterklön(core zone) and the Sulzbach (buffer zone) as wellas the group of springs called the Blue springs (corezone). The vegetation is characterized by the greyalders and ash trees amongst pioneer herb fields.There are also some swampy areas. The embankmentsof the streams have not been trained – theyhave been left in their natural condition and so providethe riparian plains with the periodic flooding thatis necessary for the preservation of the riparian character.The size of the riparian forest prior to the raisingof the dam height is unknown. It is likely that theRichisauerklön and Rossmatterklön, and the Sulzbachinundated the entire valley floor during floods. Onecan assume the levels of the mouths of both theRichisauerklön and the Rossmatterklön were significantlylower than they are today and that the tworivers only began to create a shared delta after thelevel of the lake was raised. The newly created deltaareas were rapidly colonized by riparian vegetation.As the area around the riparian forest is used anthropogenically(camp site and sewage treatment), thestreams cannot meander or expand at will. Periodicallyit has been necessary to remove gravel from thestream beds to protect the camp site from the risk offlooding. The bed load that enters the lake (of between4000 to 5000 m 3 per year), is negligible incomparison to the total reservoir capacity of almost40 million m 3 .Several dry meadow and pasture areas in the Klöntalvalley have been included in the Federal Inventory ofNationally Significant Biotopes. These dry meadowsand pastures are not affected by the operation of thepower plant.Lake KlöntalRear KlöntalSteppelwaldDry meadow Riparian area Spawning areaFederal inventories of national significance.9 ”Aueninventar Kanton Glarus” (Flood plain inventory canton Glarus) status July 2007Environmental Product Declaration20 I 21
4.3.2 Impact of the power plant on itsenvironmentFloraIn the area around the power plant around 900 speciesof plants can be found 10 . Based on a red list 11 ,several of them are classified as ”vulnerable”, ”atcritical risk” or ”endangered”. They are listed below.Three of these species were only found in Klöntalprior to 1982. This loss of biodiversity is due to thegeneral increase in anthropogenic activity in the area.• Near Threatened (NT): Canary Grass, Broomrape,Ivy Broomrape, Ghost Orchid (found before 1982),Pyramidal Orchid (found before 1982), French WildOnions, Marsh Cudweed• Vulnerable (VU): Yellow Coris (found before 1982),Lady’s Slipper Orchids, Fire/Tiger Lily, White Adder’sMouth, Dyer’s Rocket, Birdeye Pearlwort,Summer Lady’s Tresses• Endangered (EN): Milk thistle• Critical Risk (CR): Caley peaFaunaPrior to 1994, there were numerous spottings ofPapilionoidea butterflies in the Klöntal 12 . At that time,18 species were positively identified in the riparianarea or in its immediate surroundings. The presenceof 14 further species was highly likely. A further eightspecies are present today in the immediate surroundingsof the riparian areas. Two of these are criticallyendangered in Northern Switzerland and one of themis even critically endangered across Europe. Bothspecies are found in several areas around Lake Klöntal,making the area nationally and internationally significantfor their protection. The habitat of these speciesis not affected by the operation of the power plant.Amphibians such as frogs, newts and salamanders areamong the oldest vertebrates. Globally, their numbershave declined massively in recent decades. Inthe canton of Glarus, only nine species of amphibiansremain. Every year in spring, amphibians migrate fromtheir wintering grounds to their breeding waters. Inthe canton of Glarus the European Common Frog, theCommon Toad and the slightly rarer Alpine Newt arepresent 13 . These amphibians usually spend the winterin sheltered areas of the forest floor or hedgerows. Toreproduce they require a standing water body such asLake Klöntal where they spawn. In late spring, theadult amphibians leave the waters again and spendthe summer in pastures, hedgerows, gardens orforests.There are nationally significant amphibian breedinggrounds on the north-eastern shores of Lake Klöntal,as well as in the riparian forest areas. Extensive shorestretches of Lake Klöntal are inhabited by amphibians,these probably having the highest amphibiandensity in the canton. To get from their spawninggrounds on Lake Klöntal back to the forests, amphibiansneed to cross the Rhodannenberg-Vorauen road.In the past many frogs were run over and killed, dueto the relatively high traffic flow to the two campsites. To prevent this, the Löntsch power plant providedby order of the cantonal environmental agencysix amphibian underpasses between 2007 and 2010.Fish and aquatic ecologyLake Klöntal is a popular destination for anglers. Inthe past, the lake was heavily stocked with native andexotic fish species. Today, only Brown Trout and EuropeanLake Trout are released into the lake. Frequentcatchings of Pike, European Perch and White Fishsuggest successful colonization of the waters by theexotic fish previously released. Further fish speciesfound in Lake Klöntal are Bullheads, Roaches, Minnows,Chubs and Bleaks (all reproducing naturally)and the Canadian Lake Trout (natural reproductionnot proven). The fish fauna of the Löntsch consistsmainly of Brown Trout and some Rainbow Trout (escapeesfrom fish farms). Fishing is practiced in theLöntsch. Most of the fish are present due to stockingmeasures, but it is possible that some natural reproductionis taking place. Originally, fish could onlymigrate as far as the entrance to the Löntschtobelravine. Here a number of natural water falls, withheights of several metres, prevent natural fish migration.Today upstream fish migration is stopped shortbefore the ravine by concrete weirs constructed forbed stability reasons. Before the construction of theartificial dam wall, the Löntsch flowed minimal or nodischarge during the winter months. This fact is documentedin the reports of the Stream Cooperativeand is evident by the construction of the corporationtunnels by the Stream Cooperative (in 1856–1859 and1895–1898) which were required to ensure watersupply to power the Netstal factories in winter.Consequently, the flow characteristics of the Löntsch10 Swiss Web Flora, www.wsl.ch, retrieved 6 October 201011 Source: Rote Liste der gefährdeten Farn- und Blütenpflanzen der Schweiz, BUWAL, Bern 200212 Source: Schutzplanung Auenprojekt Hinter Klöntal, Forstdirektion des Kanton Glarus, 199513 Source: Press release No 37101 of Canton Glarus, 16 March 2007
4 Additional environmental informationand its aquatic habitat were hardly affected in winterby the increase in the dam height and the current useof water for hydro power. In summer, the discharge inthe Löntsch is reduced by use of water for powerproduction. However, just 500 m below the dam wall,there is sufficient water flow for an intact aquaticecosystem, due to the inflow from lateral tributaries.4.4 Environmental risksPotential environmental risks are posed by unexpectedincidents or accidents which could lead to damagingemissions from the power plant that would negativelyimpact the environment. Emissions from mostforeseeable accidents would be minimal to insignificantbecause harmful substances (e.g. oil) would becontained within the power plant by safety precautionsin place. One imaginable risk would be thesudden breach of the dam wall. To prevent such anevent the dam is continually monitored by <strong>Axpo</strong> AGas well as external specialists. Increased seepagethrough the dam would be noticed and appropriatemeasures immediately undertaken.4.5 Electromagnetic fieldsThe term ”electromagnetic field” (EMF) refers to thelower frequency range of the electromagnetic spectrum(0 to 300 GHz). EMFs are omnipresent in ourenvironment – whether from natural or man-madesources; intended as in the case of radio signals orunintended as a by-product of electrical power transmissionor electrical appliances. Technically, magneticfields are induced by the motion of electric charges.The strength of the magnetic field is measured inamperes per meter (A/m). In electromagnetic fieldresearch, scientists usually specify a related quantity,the flux density (in microtesla, µT). The higher thecurrent, the greater the strength of the magneticfield. One of the main characteristics of an EMF is itsfrequency or corresponding wavelength. Fields ofdifferent frequencies interact with the human body indifferent ways.For the protection of people working in power plants,Suva 14 has issued emission limits in accordance withICNIRP 15 -directive 1998 stipulating a maximum of500 µT. This limit is not exceeded anywhere in theLöntsch power plant except in the cable tunnel thatruns from the switchyard to the powerhouse. However,the field strength falls to below the thresholdvalue within 20 cm from the cables, which means thatthere is no EMF risk to workers or visitors. Outsidethe power plant, there are no electromagnetic fieldscaused by the Löntsch power plant 16 .4.6 Noise and vibrationsThe Swiss Federal Noise Protection Act (LSV) limitsenvironmental noise emissions in industrial and commercialareas to 70 dB(A) during the day-time and60 dB(A) during the night. For residential and tradeareas, the limits are 65 dB(A) and 55 dB(A), respectively.The machine house of the Löntsch power plantis in an industrial and trade zone 17 , while the wateroutlet is in a residential and trade zone. The plantdoes not exceed the Swiss LSV (environmental) orSuva (interior rooms, work safety) limits during anyphase of operation including start-up and shut-downand operation at maximum capacity 18 . Vibrationcaused by the operation of the turbines is not perceptibleoutside the power plant.14 Suva: The Swiss Accident Insurance Institution15 ICNIRP: International Commission on Non-Ionizing Radiation Protection16 NOK technical report EU 1876 25 April 200317 Source: Zone map Canton Glarus18 Suva measurement report 519-647/01.04, 13 January 2004Environmental Product Declaration22 I 23
5 Certification body and mandatory statements5.1 Information from the certification bodyThe certification of the environmental product declaration,<strong>EPD</strong> ® , of electricity from the Löntsch highpressure reservoir power plant has been carried outby Bureau Veritas Certification, Sweden, whichconfirms that the product fulfils relevant processandproduct-related laws and regulations. The <strong>EPD</strong> ®has been made in accordance with General ProgrammeInstructions for an envi ronmental productdeclaration, <strong>EPD</strong>, published by International <strong>EPD</strong>Consortium (IEC) and PCR-CPC 17, Product CategoryRules (PCR) for preparing an Environmental ProductDeclaration (<strong>EPD</strong> ® ) for Electricity, Steam, and Hotand Cold Water Gene ra tion and Distribution. BureauVeritas Certification Sweden has been accreditedby SWEDAC, the Swedish Board for Accredi tationand Conformity Assessment, to certify EnvironmentalProduct Declarations, <strong>EPD</strong> ® . This certification isvalid until 4 March 2015. The registration number isS-P-00332.5.2 Mandatory statements5.2.4 Information on verification<strong>EPD</strong> programmeThe international <strong>EPD</strong> ® system, managed by theInternational <strong>EPD</strong> Consortium (IEC).http://www.environdec.comProduct Category RulesPCR-CPC 17, Product Category Rules (PCR) for preparingan Environmental Product Declaration (<strong>EPD</strong> ® )for Electricity, Steam, and Hot and Cold WaterGeneration and Distribution, Version 2.01. Electricitybelongs to the product category UNCPC Code 17,Group 171 – Electrical energy.PCR reviewSven-Olof Ryding, International <strong>EPD</strong> Consortium (IEC),info@environdec.comIndependent verificationIndependent verification of the declaration and data,according to ISO 14025: External, Bureau VeritasCertification, Sweden5.2.1 General statementsNote that <strong>EPD</strong>s from different <strong>EPD</strong> programmes maynot be directly comparable.5.2.2 Omissions of life-cycle stagesIn accordance with the PCR, the use stage of producedelectricity has been omitted since the useof electricity fulfils various functions in differentcontexts.5.2.3 Means of obtaining explanatory materialsISO 14025 prescribes that explanatory material mustbe available if the <strong>EPD</strong> is communicated to finalconsumers. This <strong>EPD</strong> is aimed at industrial customersand not meant for B2C (business-to-consumer)communication.
6 Links and referencesFurther information on the companyhttp://www.axpo.chInternational <strong>EPD</strong> ® programme informationhttp://www.environdec.comInformation on the International <strong>EPD</strong> Consortium(IEC), <strong>EPD</strong> ® s and PCRs (PCR-CPC 17), and GeneralProgramme Instructions GPI, 2007Background LCA datahttp://www.ecoinvent.orgThe ecoinvent database v2.2,Swiss Centre for Life Cycle InventoriesEnvironmental Product Declaration24 I 25
7 Frequently used abbreviationsCLC-Classes<strong>EPD</strong>ISOLCALCILCIANMVOCPCRCORINE Land Cover ClassesEnvironmental Product DeclarationInternational Organization for StandardizationLife-Cycle AssessmentLife-Cycle InventoryLife-Cycle Impact AssessmentNon-Methane Volatile Organic CompoundsProduct Category Rule
<strong>Axpo</strong> AGParkstrasse 23 | CH-5401 BadenT +41 56 200 31 11 | F +41 56 200 37 55www.axpo.ch