Introductory And Intermediate Growth Models - Mplus
Introductory And Intermediate Growth Models - Mplus
Introductory And Intermediate Growth Models - Mplus

You also want an ePaper? Increase the reach of your titles
YUMPU automatically turns print PDFs into web optimized ePapers that Google loves.
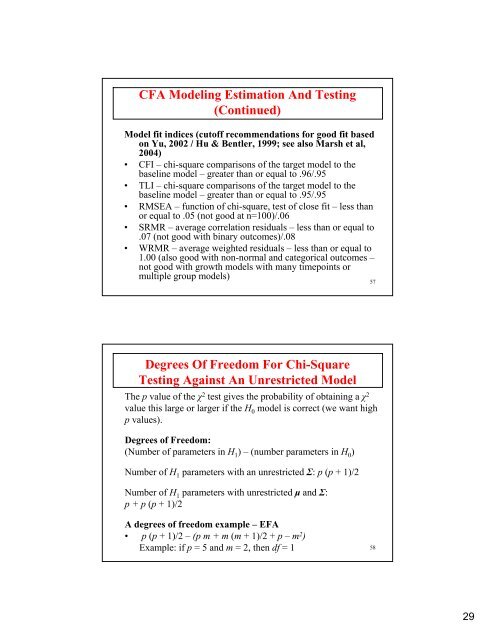
CFA Modeling Estimation <strong>And</strong> Testing(Continued)Model fit indices (cutoff recommendations for good fit basedon Yu, 2002 / Hu & Bentler, 1999; see also Marsh et al,2004)• CFI – chi-square comparisons of the target model to thebaseline model – greater than or equal to .96/.95• TLI – chi-square comparisons of the target model to thebaseline model – greater than or equal to .95/.95• RMSEA – function of chi-square, test of close fit – less thanor equal to .05 (not good at n=100)/.06• SRMR – average correlation residuals – less than or equal to.07 (not good with binary outcomes)/.08• WRMR – average weighted residuals – less than or equal to1.00 (also good with non-normal and categorical outcomes –not good with growth models with many timepoints ormultiple group models)57Degrees Of Freedom For Chi-SquareTesting Against An Unrestricted ModelThe p value of the χ 2 test gives the probability of obtaining a χ 2value this large or larger if the H 0 model is correct (we want highp values).Degrees of Freedom:(Number of parameters in H 1 ) – (number parameters in H 0 )Number of H 1 parameters with an unrestricted Σ: p (p + 1)/2Number of H 1 parameters with unrestricted μ and Σ:p + p (p + 1)/2A degrees of freedom example – EFA• p (p + 1)/2 – (p m + m (m + 1)/2 + p – m 2 )Example: if p = 5 and m = 2, then df = 15829