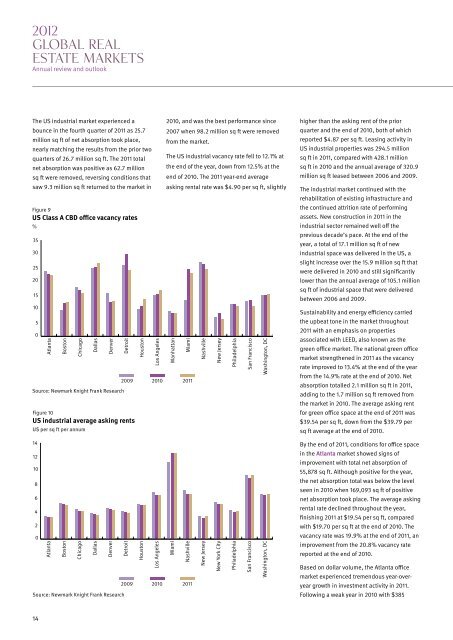
2012GLOBAL REALESTATE MARKETSAnnual review and outlookThe US industrial market experienced abounce in <strong>the</strong> fourth quarter of 2011 as 25.7million sq ft of net absorption took place,nearly matching <strong>the</strong> results from <strong>the</strong> prior twoquarters of 26.7 million sq ft. The 2011 totalnet absorption was positive as 62.7 millionsq ft were removed, reversing conditions thatsaw 9.3 million sq ft returned to <strong>the</strong> market inFigure 9US Class A CBD office vacancy rates%35302520151050AtlantaBostonChicagoDallasDenverSource: Newmark <strong>Knight</strong> Frank ResearchDetroitFigure 10US industrial average asking rentsU$ per sq ft per annumHoustonLos Angeles2010, and was <strong>the</strong> best per<strong>for</strong>mance since2007 when 98.2 million sq ft were removedfrom <strong>the</strong> market.The US industrial vacancy rate fell to 12.1% at<strong>the</strong> end of <strong>the</strong> year, down from 12.5% at <strong>the</strong>end of 2010. The 2011 year-end averageasking rental rate was $4.90 per sq ft, slightlyManhattanMiami2009 2010 2011NashvilleNew JerseyPhiladelphiaSan FranciscoWashington, DChigher than <strong>the</strong> asking rent of <strong>the</strong> priorquarter and <strong>the</strong> end of 2010, both of whichreported $4.87 per sq ft. Leasing activity inUS industrial properties was 294.5 millionsq ft in 2011, compared with 428.1 millionsq ft in 2010 and <strong>the</strong> annual average of 320.9million sq ft leased between 2006 and 2009.The industrial market continued with <strong>the</strong>rehabilitation of existing infrastructure and<strong>the</strong> continued attrition rate of per<strong>for</strong>mingassets. New construction in 2011 in <strong>the</strong>industrial sector remained well off <strong>the</strong>previous decade’s pace. At <strong>the</strong> end of <strong>the</strong>year, a total of 17.1 million sq ft of newindustrial space was delivered in <strong>the</strong> US, aslight increase over <strong>the</strong> 15.9 million sq ft thatwere delivered in 2010 and still significantlylower than <strong>the</strong> annual average of 105.1 millionsq ft of industrial space that were deliveredbetween 2006 and 2009.Sustainability and energy efficiency carried<strong>the</strong> upbeat tone in <strong>the</strong> market throughout2011 with an emphasis on propertiesassociated with LEED, also known as <strong>the</strong>green office market. The national green officemarket streng<strong>the</strong>ned in 2011 as <strong>the</strong> vacancyrate improved to 13.4% at <strong>the</strong> end of <strong>the</strong> yearfrom <strong>the</strong> 14.9% rate at <strong>the</strong> end of 2010. Netabsorption totalled 2.1 million sq ft in 2011,adding to <strong>the</strong> 1.7 million sq ft removed from<strong>the</strong> market in 2010. The average asking rent<strong>for</strong> green office space at <strong>the</strong> end of 2011 was$39.54 per sq ft, down from <strong>the</strong> $39.79 persq ft average at <strong>the</strong> end of 2010.14121086420AtlantaBostonChicagoDallasDenverDetroitHoustonLos AngelesMiamiNashville2009 2010 2011Source: Newmark <strong>Knight</strong> Frank ResearchNew JerseyNew York CityPhiladelphiaSan FranciscoWashington, DCBy <strong>the</strong> end of 2011, conditions <strong>for</strong> office spacein <strong>the</strong> Atlanta market showed signs ofimprovement with total net absorption of55,878 sq ft. Although positive <strong>for</strong> <strong>the</strong> year,<strong>the</strong> net absorption total was below <strong>the</strong> levelseen in 2010 when 169,093 sq ft of positivenet absorption took place. The average askingrental rate declined throughout <strong>the</strong> year,finishing 2011 at $19.54 per sq ft, comparedwith $19.70 per sq ft at <strong>the</strong> end of 2010. Thevacancy rate was 19.9% at <strong>the</strong> end of 2011, animprovement from <strong>the</strong> 20.8% vacancy ratereported at <strong>the</strong> end of 2010.Based on dollar volume, <strong>the</strong> Atlanta officemarket experienced tremendous year-overyeargrowth in investment activity in 2011.Following a weak year in 2010 with $38514
million in sales transactions closed, 2011ended with $1.4 billion in closed deals, a270% increase in dollar volume. The averageprice per sq ft paid grew to $120 per sq ft in2011 from $98 per sq ft in 2010. The averagecap rate <strong>for</strong> office properties sold in 2011 was7.7%, compared with 8.4% in 2010.CMBS debt totalling $4.6 billion was securedby office properties in <strong>the</strong> Atlanta market by<strong>the</strong> end of 2011. Of <strong>the</strong> $4.6 billionoutstanding, nearly $1.6 billion, or 34%, wasconsidered delinquent by <strong>the</strong> end of <strong>the</strong> year.The vacancy rate <strong>for</strong> office properties in Bostonsettled at <strong>the</strong> end of 2011 at 11.8%, followingrates as high as 13.0% earlier in <strong>the</strong> year, andremained above <strong>the</strong> 11.2% rate reported at <strong>the</strong>end of 2010. The average asking rent grew to$43.51 per sq ft by <strong>the</strong> end of 2011, improving2.6% from <strong>the</strong> $42.39 per sq ft rate reported at<strong>the</strong> end of 2010. The year-end net absorptiontotal <strong>for</strong> office space in Boston was positive at472,342 sq ft in 2011, a considerableimprovement from <strong>the</strong> combined 1.8 millionsq ft of negative absorption which took placein 2009 and 2010.In 2011, 700,000 sq ft of new office spacewere delivered to <strong>the</strong> market, while ano<strong>the</strong>r580,000 sq ft remained under construction.Little development has taken place over <strong>the</strong>past few years, with 920,000 sq ft of spacedelivered to <strong>the</strong> market in <strong>the</strong> past five years.By comparison, from 2001 to 2006, a total of3.4 million sq ft of new space was delivered to<strong>the</strong> market.The average asking rent <strong>for</strong> green office spacein Boston finished 2011 at $47.48 per sq ft,which stands at 9.1% over standard Class Aoffice spaces in <strong>the</strong> Boston market. Thevacancy rate <strong>for</strong> green office space ended <strong>the</strong>year at 11.1%, almost 200 bps above <strong>the</strong> 9.3%rate reported in 2010. A total of 662,000 sq ftof transactions were signed <strong>for</strong> green officespace in 2011.The 2011 year-end total <strong>for</strong> net absorption in<strong>the</strong> Chicago office market was positive at787,033 sq ft, adding to <strong>the</strong> 605,296 sq ft ofpositive net absorption in 2010. The vacancyrate in <strong>the</strong> market finished 2011 at 14.6%, aslight improvement over <strong>the</strong> 14.8% ratereported at <strong>the</strong> end of 2010, and <strong>the</strong> lowestBostonlevel seen since mid-2009. Average askingrents in <strong>the</strong> Chicago market fell to $31.34 persq ft at <strong>the</strong> end of 2011 from $31.79 per sq ftreported at <strong>the</strong> end of 2010.In 2011, office investment activity in Chicagogrew by more than 20.0% from <strong>the</strong> previousyear as $3.3 billion worth of transactions wereclosed, <strong>the</strong> highest level seen in this marketsince 2007. The average sale price <strong>for</strong> officeproperties in Chicago in 2011 was $164 persq ft, a drop from <strong>the</strong> $182 per sq ft rate seenin 2010. The average cap rate <strong>for</strong> <strong>the</strong> year was7.4%, down from 7.9% in 2010.The Chicago industrial market, one of <strong>the</strong>largest in <strong>the</strong> US, finished 2011 with a vacancyrate of 14.4%, an improvement over <strong>the</strong> 15.5%rate reported in 2010 and its lowest levelsince 2009. The average asking rent <strong>for</strong>industrial space reached $4.17 per sq ft at <strong>the</strong>end of <strong>the</strong> year, up slightly from $4.13 persq ft reached in 2010. Ozburn HesseyLogistics signed one of <strong>the</strong> largest industrialleases in <strong>the</strong> Chicago market in 2011, inking adeal <strong>for</strong> 477,000 sq ft at 2780 McDonoughStreet.The average asking rent in <strong>the</strong> Dallas officemarket remained nearly flat throughout 2011,finishing <strong>the</strong> year at $20.83 per sq ft, a 1.4%decline from <strong>the</strong> average reported at <strong>the</strong> endof 2010. The Dallas vacancy rate ended 2011 at25.6%, its highest level since 1997 and one of<strong>the</strong> highest office vacancy rates within <strong>the</strong> USCBD marketplace. The third quarter of 2011was <strong>the</strong> only quarter in <strong>the</strong> year to postpositive absorption, bringing <strong>the</strong> year-endtotal <strong>for</strong> net absorption to negative258,815 sq ft, retreating fur<strong>the</strong>r from <strong>the</strong>133,012 sq ft of negative net absorptionin 2010.Although development of new office towersslowed in 2011, investment activity grew in<strong>the</strong> year as more than $120 million in salesactivity took place, from a nearly inactive2010. One of <strong>the</strong> largest leasing transactionsin 2011 was <strong>for</strong> <strong>the</strong> advertising firmTracyLocke. The firm signed a renewal lease<strong>for</strong> 112,000 sq ft at 1999 Bryan Street in <strong>the</strong>Dallas CBD.Delinquencies of CMBS debt on Dallas officeproperties stood at 12.5% or $516 million by<strong>the</strong> end of 2011. $4.2 billion of securitiseddebt remained outstanding by <strong>the</strong> end of2011, 88% of which was originated priorto 2009.15