Comparing a Measure of Historical Timberland Returns with ... - sofew
Comparing a Measure of Historical Timberland Returns with ... - sofew
Comparing a Measure of Historical Timberland Returns with ... - sofew

You also want an ePaper? Increase the reach of your titles
YUMPU automatically turns print PDFs into web optimized ePapers that Google loves.
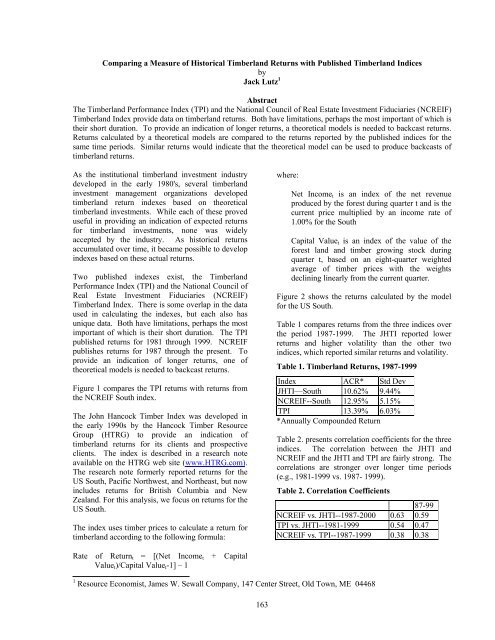
<strong>Comparing</strong> a <strong>Measure</strong> <strong>of</strong> <strong>Historical</strong> <strong>Timberland</strong> <strong>Returns</strong> <strong>with</strong> Published <strong>Timberland</strong> IndicesbyJack Lutz 1AbstractThe <strong>Timberland</strong> Performance Index (TPI) and the National Council <strong>of</strong> Real Estate Investment Fiduciaries (NCREIF)<strong>Timberland</strong> Index provide data on timberland returns. Both have limitations, perhaps the most important <strong>of</strong> which istheir short duration. To provide an indication <strong>of</strong> longer returns, a theoretical models is needed to backcast returns.<strong>Returns</strong> calculated by a theoretical models are compared to the returns reported by the published indices for thesame time periods. Similar returns would indicate that the theoretical model can be used to produce backcasts <strong>of</strong>timberland returns.As the institutional timberland investment industrydeveloped in the early 1980's, several timberlandinvestment management organizations developedtimberland return indexes based on theoreticaltimberland investments. While each <strong>of</strong> these proveduseful in providing an indication <strong>of</strong> expected returnsfor timberland investments, none was widelyaccepted by the industry. As historical returnsaccumulated over time, it became possible to developindexes based on these actual returns.Two published indexes exist, the <strong>Timberland</strong>Performance Index (TPI) and the National Council <strong>of</strong>Real Estate Investment Fiduciaries (NCREIF)<strong>Timberland</strong> Index. There is some overlap in the dataused in calculating the indexes, but each also hasunique data. Both have limitations, perhaps the mostimportant <strong>of</strong> which is their short duration. The TPIpublished returns for 1981 through 1999. NCREIFpublishes returns for 1987 through the present. Toprovide an indication <strong>of</strong> longer returns, one <strong>of</strong>theoretical models is needed to backcast returns.Figure 1 compares the TPI returns <strong>with</strong> returns fromthe NCREIF South index.The John Hancock Timber Index was developed inthe early 1990s by the Hancock Timber ResourceGroup (HTRG) to provide an indication <strong>of</strong>timberland returns for its clients and prospectiveclients. The index is described in a research noteavailable on the HTRG web site (www.HTRG.com).The research note formerly reported returns for theUS South, Pacific Northwest, and Northeast, but nowincludes returns for British Columbia and NewZealand. For this analysis, we focus on returns for theUS South.The index uses timber prices to calculate a return fortimberland according to the following formula:where:Net Income t is an index <strong>of</strong> the net revenueproduced by the forest during quarter t and is thecurrent price multiplied by an income rate <strong>of</strong>1.00% for the SouthCapital Value t is an index <strong>of</strong> the value <strong>of</strong> theforest land and timber growing stock duringquarter t, based on an eight-quarter weightedaverage <strong>of</strong> timber prices <strong>with</strong> the weightsdeclining linearly from the current quarter.Figure 2 shows the returns calculated by the modelfor the US South.Table 1 compares returns from the three indices overthe period 1987-1999. The JHTI reported lowerreturns and higher volatility than the other twoindices, which reported similar returns and volatility.Table 1. <strong>Timberland</strong> <strong>Returns</strong>, 1987-1999Index ACR* Std DevJHTI—South 10.62% 9.44%NCREIF--South 12.95% 5.15%TPI 13.39% 6.03%*Annually Compounded ReturnTable 2. presents correlation coefficients for the threeindices. The correlation between the JHTI andNCREIF and the JHTI and TPI are fairly strong. Thecorrelations are stronger over longer time periods(e.g., 1981-1999 vs. 1987- 1999).Table 2. Correlation Coefficients87-99NCREIF vs. JHTI--1987-2000 0.63 0.59TPI vs. JHTI--1981-1999 0.54 0.47NCREIF vs. TPI--1987-1999 0.38 0.38Rate <strong>of</strong> Return t = [(Net Income t + CapitalValue t )/Capital Value t -1] – 11 Resource Economist, James W. Sewall Company, 147 Center Street, Old Town, ME 04468163
JHTI is more closely correlated <strong>with</strong> both indicesthan the indices are correlated <strong>with</strong> each other.The comparison shows that the JHTI provides areasonably accurate picture <strong>of</strong> timberland returnswhen compared to the published timberland indices.This means that the JHTI can be used to makebackcasts <strong>of</strong> timberland returns. The model can alsobe used to forecast timberland returns if a goodtimber price forecast is available.Figure 1. Published <strong>Timberland</strong> <strong>Returns</strong>--US South30%25%20%% Annual Return15%10%5%0%1980 1985 1990 1995 2000-5%NCREIF <strong>Returns</strong>--SouthTPI R eturnsFigure 2. John Hancock <strong>Timberland</strong> Index--US South30%25%20%15%% Annual Return10%5%0%1980 1985 1990 1995 2000-5%-10%JH T I R eturns--South164