A Comparison of Four Forest Inventory Tools in Southeast ... - sofew
A Comparison of Four Forest Inventory Tools in Southeast ... - sofew
A Comparison of Four Forest Inventory Tools in Southeast ... - sofew
Create successful ePaper yourself
Turn your PDF publications into a flip-book with our unique Google optimized e-Paper software.
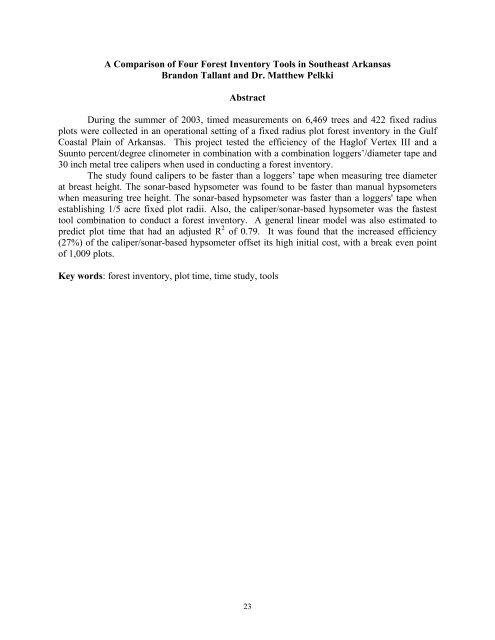
A <strong>Comparison</strong> <strong>of</strong> <strong>Four</strong> <strong>Forest</strong> <strong>Inventory</strong> <strong>Tools</strong> <strong>in</strong> <strong>Southeast</strong> ArkansasBrandon Tallant and Dr. Matthew PelkkiAbstractDur<strong>in</strong>g the summer <strong>of</strong> 2003, timed measurements on 6,469 trees and 422 fixed radiusplots were collected <strong>in</strong> an operational sett<strong>in</strong>g <strong>of</strong> a fixed radius plot forest <strong>in</strong>ventory <strong>in</strong> the GulfCoastal Pla<strong>in</strong> <strong>of</strong> Arkansas. This project tested the efficiency <strong>of</strong> the Hagl<strong>of</strong> Vertex III and aSuunto percent/degree cl<strong>in</strong>ometer <strong>in</strong> comb<strong>in</strong>ation with a comb<strong>in</strong>ation loggers’/diameter tape and30 <strong>in</strong>ch metal tree calipers when used <strong>in</strong> conduct<strong>in</strong>g a forest <strong>in</strong>ventory.The study found calipers to be faster than a loggers’ tape when measur<strong>in</strong>g tree diameterat breast height. The sonar-based hypsometer was found to be faster than manual hypsometerswhen measur<strong>in</strong>g tree height. The sonar-based hypsometer was faster than a loggers' tape whenestablish<strong>in</strong>g 1/5 acre fixed plot radii. Also, the caliper/sonar-based hypsometer was the fastesttool comb<strong>in</strong>ation to conduct a forest <strong>in</strong>ventory. A general l<strong>in</strong>ear model was also estimated topredict plot time that had an adjusted R 2 <strong>of</strong> 0.79. It was found that the <strong>in</strong>creased efficiency(27%) <strong>of</strong> the caliper/sonar-based hypsometer <strong>of</strong>fset its high <strong>in</strong>itial cost, with a break even po<strong>in</strong>t<strong>of</strong> 1,009 plots.Key words: forest <strong>in</strong>ventory, plot time, time study, tools23
2. Associate Pr<strong>of</strong>essor, University <strong>of</strong> Arkansas-Monticello, School <strong>of</strong> <strong>Forest</strong> Resources, P.O.Box 3468,110 University Court, Monticello, AR 71656, Pelkki@uamont.edu, (870)460-1949 (v);(870)460-1092(fax)Time StudiesB<strong>in</strong>ot and others (1995) found the d-tape to be faster than the calipers. Based on anaverage <strong>of</strong> 34 trees, average person-seconds required to use the <strong>in</strong>struments were reported as 755for diameter tape and data collector, 826 for diameter tape and tally sheet, 876 for caliper anddata collector, and 917 for caliper and tally sheet. In other words, the time required for the d-tape and data collector required 755 seconds per 34 trees or 22 seconds per tree <strong>of</strong> two personscomb<strong>in</strong>ed. The d-tape was faster than the calipers, because it only required one measurementversus two with calipers.Hunt (1959) timed each height measurement with a stop watch to one-tenth second. Thetime required to measure a tree was determ<strong>in</strong>ed as follows:1) The operator assumed his position over the stake correspond<strong>in</strong>g to the tree measured.2) As he raised the <strong>in</strong>strument to his eye, the recorder started the watch.3) The operator called out the <strong>in</strong>strument read<strong>in</strong>g to the tree base and then to the first livelimb.4) The watch stopped when the recorder received the latter read<strong>in</strong>g.5) The two read<strong>in</strong>gs and the consumed time were recorded.When us<strong>in</strong>g a tape, Rennie (1979) found the use <strong>of</strong> the Suunto cl<strong>in</strong>ometer with tape to bea faster <strong>in</strong>strument to determ<strong>in</strong>e tree height than the Abney level or Blume-Leiss. The averagetimes required to measure 94 trees us<strong>in</strong>g different pieces <strong>of</strong> equipment were 200 m<strong>in</strong>utes for theAbney level with tape, 146 m<strong>in</strong>utes for the Blume-Leiss with tape, 125.5 m<strong>in</strong>utes for the Suuntomanual hypsometer with tape, 173.5 m<strong>in</strong>utes for the Suunto manual hypsometer with pole, 79m<strong>in</strong>utes for the hand-held Christen hypsometer, and 107 m<strong>in</strong>utes for the Christen hypsometer ona staff.None <strong>of</strong> the research conducted thus far has comb<strong>in</strong>ed the <strong>in</strong>ventory <strong>in</strong>struments andstudied how they work when used together, how much time they require <strong>in</strong> an operational sett<strong>in</strong>gwhen used together, or how stand conditions affect the time requirements <strong>in</strong> operational sett<strong>in</strong>gs.This study will comb<strong>in</strong>e both height and diameter measurement <strong>in</strong>ventory <strong>in</strong>struments, use them<strong>in</strong> an actual forest <strong>in</strong>ventory, time the entire process, and make conclusions on their efficiencythrough time studies to <strong>in</strong>clude the <strong>in</strong>itial cost <strong>of</strong> the equipment. This <strong>in</strong>formation will then beused to create a regression equation that will <strong>in</strong>clude the diameter and height measurement<strong>in</strong>struments used, as well as stand conditions to compute the time required to complete a forest<strong>in</strong>ventory.METHODSStudy AreaThe study <strong>in</strong>cluded four stand <strong>of</strong> timber <strong>in</strong> Ashley, Bradley, and Drew Counties,Arkansas. The first stand, located <strong>in</strong> Drew County, was a mature p<strong>in</strong>e stand that had recentlybeen th<strong>in</strong>ned <strong>of</strong> most hardwoods and conta<strong>in</strong>ed mostly mature p<strong>in</strong>e trees; <strong>in</strong>itially it was an oldfield plantation. The second stand, located <strong>in</strong> Bradley County, was an uneven-agedp<strong>in</strong>e/hardwood stand that had not been actively managed. The next stand, also located <strong>in</strong> Bradley25
County, was a middle aged p<strong>in</strong>e plantation. The f<strong>in</strong>al stand was located <strong>in</strong> Ashley County. It wasan uneven-aged p<strong>in</strong>e stand that had recently been th<strong>in</strong>ned <strong>of</strong> all hardwoods. This stand was anold forest that was put <strong>in</strong>to production <strong>in</strong> 1994 as an uneven-aged p<strong>in</strong>e forest. As the stands wereall located <strong>in</strong> the Coastal Pla<strong>in</strong> <strong>of</strong> Arkansas, there was little to no elevation changes <strong>in</strong> thetopography.<strong>Inventory</strong> MethodsAll stands were <strong>in</strong>ventoried at 7.5% <strong>in</strong>tensity us<strong>in</strong>g 1/5 th acre circular plots <strong>in</strong> the summer<strong>of</strong> 2003. Each stand was <strong>in</strong>ventoried four consecutive times us<strong>in</strong>g different comb<strong>in</strong>ations <strong>of</strong><strong>in</strong>ventory tools. All <strong>in</strong>ventories <strong>of</strong> each stand were completed us<strong>in</strong>g the same distance betweencruise l<strong>in</strong>es and plots on a l<strong>in</strong>e. At the beg<strong>in</strong>n<strong>in</strong>g <strong>of</strong> each cruise method, the distance to thestart<strong>in</strong>g l<strong>in</strong>e and distance to the first plot <strong>of</strong> each l<strong>in</strong>e were randomly selected. Every tree with adiameter at breast height (DBH) greater than 4.6 <strong>in</strong>ches was measured. Trees were measured tothe nearest 1/10 th <strong>in</strong>ch; those with a diameter between 4.6 and 8.5 <strong>in</strong>ches were consideredpulpwood. P<strong>in</strong>e trees with a DBH greater than 8.6 <strong>in</strong>ches were considered sawtimber sized trees,and hardwood trees with diameters greater than 11.6 <strong>in</strong>ches were considered sawtimber sizedtrees. Three attributes <strong>of</strong> each tree that fell with<strong>in</strong> the 1/5 th acre circular plot were recorded, they<strong>in</strong>cluded diameter at breast height to the nearest 1/10 th <strong>in</strong>ch, total height to the nearest foot, andan ocular estimation <strong>of</strong> the number <strong>of</strong> merchantable height (10-ft pulpwood sticks or 16-ftsawlogs). Merchantable pulpwood above sawtimber was not estimated.Trees per acre and stand volumes were determ<strong>in</strong>ed us<strong>in</strong>g these measurements. Each <strong>of</strong>the four <strong>in</strong>ventories was completed us<strong>in</strong>g a different comb<strong>in</strong>ation <strong>of</strong> the follow<strong>in</strong>g diameter andheight measurement tools:Diameter -Loggers’ Tape (comb<strong>in</strong>ation loggers/diameter tape)Height-Calipers (30 <strong>in</strong>ch metal tree calipers)-Sonar-based hypsometer (Hagl<strong>of</strong> Vertex III)-Manual hypsometer (Suunto percent and degree cl<strong>in</strong>ometer).A particular equipment comb<strong>in</strong>ation was used until the entire <strong>in</strong>ventory was completed. Also,research personnel (4 persons) rotated positions daily accord<strong>in</strong>g to a randomized schedule.Equations developed by Clark and others (1986) were used to determ<strong>in</strong>e the topdiameters <strong>of</strong> trees. The cubic foot volume <strong>of</strong> p<strong>in</strong>e trees <strong>in</strong> the mature p<strong>in</strong>e stand were determ<strong>in</strong>edus<strong>in</strong>g equations from Van Deusen an others (1981) because the stand was old-field plantationgrown loblolly p<strong>in</strong>e. All other stand p<strong>in</strong>e volumes were determ<strong>in</strong>ed us<strong>in</strong>g equations fromAmateis and Burkhart (1987). This equation was used because it was developed for loblolly p<strong>in</strong>etrees <strong>in</strong> cutover site-prepared plantations. Hardwood tree volumes were determ<strong>in</strong>ed us<strong>in</strong>gequations from Clark and others (1991).<strong>Inventory</strong> crewAn <strong>in</strong>ventory crew consisted <strong>of</strong> two <strong>in</strong>dividuals. The first role was that <strong>of</strong> the cruiser, thisperson measured tree attributes and determ<strong>in</strong>ed plot boundaries for all plots. Tree attributes<strong>in</strong>cluded diameter at breast height, total tree height, and merchantable height. The next personon the <strong>in</strong>ventory crew was the tallyperson. This person was responsible for pac<strong>in</strong>g from plot toplot, determ<strong>in</strong><strong>in</strong>g cruise l<strong>in</strong>es, determ<strong>in</strong><strong>in</strong>g plot center, record<strong>in</strong>g temperature, brush<strong>in</strong>ess,weather, record<strong>in</strong>g <strong>in</strong>formation called out by the cruiser, and record<strong>in</strong>g the total time required tocomplete <strong>in</strong>dividual plots. Brush<strong>in</strong>ess was a subjective ocular estimation <strong>of</strong> the brush <strong>in</strong> the plot;it was used to help determ<strong>in</strong>e if brush was a contribut<strong>in</strong>g factor to the time required to complete26
steps <strong>in</strong> the <strong>in</strong>ventory process. Weather was recorded as hot, w<strong>in</strong>dy, ra<strong>in</strong>y, or normal. Thedifference between hot and normal weather was determ<strong>in</strong>ed by the tallyperson.Two additional persons followed the <strong>in</strong>ventory crew and recorded times for all activitiescompleted by the cruiser. Timer A and Timer B recorded the time required to complete theactivities <strong>of</strong> the cruiser and the tallyperson. Timer A measured the time to f<strong>in</strong>d the start<strong>in</strong>g l<strong>in</strong>e,plot radius determ<strong>in</strong>ation, DBH, total height, and recovery time. Timer B measured travel time,acquisition time, separation, and merchantable height.Tim<strong>in</strong>g ProcessIn addition to tree attributes, times (<strong>in</strong> seconds) to complete each task <strong>in</strong> the <strong>in</strong>ventoryprocess were recorded. The <strong>in</strong>ventory process was divided <strong>in</strong>to three levels <strong>of</strong> work thatconsisted <strong>of</strong> a total <strong>of</strong> 13 tasks. The order <strong>of</strong> tasks <strong>in</strong> an actual field sett<strong>in</strong>g may vary from theorder <strong>of</strong> tasks used <strong>in</strong> this study. This set order was necessary <strong>in</strong> order for the timers to gatherthe <strong>in</strong>formation required for this project. Figure 1, presents a timber <strong>in</strong>ventory operation processchart that depicts processes and measurements made <strong>in</strong> a forest <strong>in</strong>ventory regardless <strong>of</strong> the<strong>in</strong>strument used.Each day the total work time was recorded. It was started when the group left thedesignated corner <strong>of</strong> the property and ended when the group walked back to that same po<strong>in</strong>t.This designated corner did not change from day to day or from tool comb<strong>in</strong>ation to toolcomb<strong>in</strong>ation. All breaks taken dur<strong>in</strong>g the process were also recorded, so they could beaccounted for <strong>in</strong> the plot total time and total daily time. With the exception <strong>of</strong> equipmentfailures, the times to complete <strong>in</strong>ventory plots are delay-free times.RegressionsThe data were then randomly split <strong>in</strong>to a regression dataset and a validation data set todevelop and validate the regression equations. Residuals that were three standard deviationsaway from the mean were considered outliers and elim<strong>in</strong>ated before regression models were fit.SAS® was used to fit a regression model that estimated the time required to <strong>in</strong>ventory a plot.Mallows Cp and PRESS statistics were used to narrow regression models.RESULTS/DISCUSSIONA total <strong>of</strong> 422 1/5 th acre plots collectively conta<strong>in</strong><strong>in</strong>g 6,469 trees were used <strong>in</strong> meanstest<strong>in</strong>g and model fitt<strong>in</strong>g. Out <strong>of</strong> this sample, 105 plots and 1,608 trees were randomly selectedand <strong>in</strong>cluded <strong>in</strong> the validation dataset. The rema<strong>in</strong><strong>in</strong>g 317 plots and 4,861 trees were used <strong>in</strong>fitt<strong>in</strong>g and test<strong>in</strong>g all regression equations. Table 1 shows the time to measure <strong>in</strong>ventory plotswith different equipment comb<strong>in</strong>ations summary statistics.Table 1. Time to measure 1/5 th acre fixed radius <strong>in</strong>ventory plots with different equipmentcomb<strong>in</strong>ations summary statistics.MeanComb<strong>in</strong>ation N (m<strong>in</strong>.) Std. Dev. Std. Err.27
Caliper/sonar-based hypsometer 104 20.54 11.989 1.176Caliper/manual hypsometer 106 24.02 13.038 1.266Loggers’ tape/sonar-based hypsometer 107 24.00 14.252 1.378Loggers’ tape/manual hypsometer 104 24.23 13.341 1.308Time StudyA t-test showed a significant difference <strong>in</strong> the hypothesis that time to measure the DBH<strong>of</strong> a tree us<strong>in</strong>g the loggers’ tape was less than or equal to the time with calipers for all speciescomb<strong>in</strong>ed (p-value
Summary: 0-15 Last CruiseL<strong>in</strong>eEvent Number TimeYes NoOperations 16 average time shownInspections 0 0 0-16 CruiseCompleteFigure 1. Timber <strong>Inventory</strong> Operation Process ChartCharted by: Brandon Tallant 2-15-2003that it is faster to measure a tree once with tree calipers than with a loggers’ tape. Table 2 showsthe summary statistics and two-sample t-test on the means <strong>of</strong> DBH measurement times us<strong>in</strong>gdifferent equipment. The mean times to measure a tree with calipers and logger’s tape are 2.0and 6.5 seconds respectively.Table 2. DBH times summary statistics and means tests.Group N Mean (sec.) Std. Dev. Std. ErrorAll species comb<strong>in</strong>edCaliper 3167 2.0 2.22 0.04Loggers’ Tape 3303 6.5 5.47 0.10t-statistic p-value36.18
Table 3. Tree height measurement process times (all species comb<strong>in</strong>ed) summary statistics andmeans test us<strong>in</strong>g the manual and sonar-based hypsometers.Group N Mean (sec.) Std. Dev. Std. ErrorSum <strong>of</strong> tree height timesManual hypsometer 3213 53.2 16.50 0.29Sonar-based hypsometer 3256 41.1 13.28 0.23t-statistic p-value32.417
t-statistic p-value-2.205 0.0297trees were outside the plot, which on average required 5.06 m<strong>in</strong>utes (Table 4). Plot boundaryestablishment expla<strong>in</strong>s a portion <strong>of</strong> the <strong>in</strong>tercept term.Simply be<strong>in</strong>g <strong>in</strong> a p<strong>in</strong>e/hardwood stand would <strong>in</strong>crease the time to complete a plot by4.09 m<strong>in</strong>utes. The presence <strong>of</strong> hardwood trees also had a positive <strong>in</strong>fluence on time <strong>in</strong> the treelevelregression. The significance <strong>of</strong> this stand may be due to its very large trees, both p<strong>in</strong>e andhardwood. Due to the large size <strong>of</strong> both p<strong>in</strong>e and hardwood trees <strong>in</strong> this stand, an operator wouldbe required to walk around the large trees diameter <strong>in</strong> order to determ<strong>in</strong>e DBH.Next, if the operator employed the use <strong>of</strong> the caliper/sonar-based hypsometercomb<strong>in</strong>ation <strong>of</strong> equipment, the plot would be measured 3.79 m<strong>in</strong>utes faster than if any othercomb<strong>in</strong>ation <strong>of</strong> tools were used. This is due to the faster tree measurement time as discussed <strong>in</strong>the tree level equation. All other tool comb<strong>in</strong>ations were found to be <strong>in</strong>significant predictors <strong>of</strong>plot time.Brush contributed 2.47 m<strong>in</strong>utes to the time required to <strong>in</strong>ventory a plot. Brush <strong>in</strong>terfereswith the equipment and makes the technician work harder to move through and takemeasurements through it. It was expected that brush would have a positive impact on total plottime.Every tree <strong>in</strong> any given plot adds time to the total plot time. P<strong>in</strong>e sawtimber treesrequired more time to measure than any other tree. Consequently, every p<strong>in</strong>e sawtimber tree peracre adds 0.21 m<strong>in</strong>utes to the total plot time. Each additional non-p<strong>in</strong>e sawtimber tree per acreadded 0.19 m<strong>in</strong>utes to the total plot time. A model with trees per acre <strong>of</strong> all species comb<strong>in</strong>edwas attempted but it only expla<strong>in</strong>ed 17% <strong>of</strong> the variation <strong>in</strong> the total plot time.The plot level regressions predicted total plot time was significantly different than theactual observed time. Even though the predicted time is not the same as an actual observed time,forest managers can still use the equal <strong>in</strong> a forest <strong>in</strong>ventory plann<strong>in</strong>g sett<strong>in</strong>g if the time isadjusted appropriately. When averaged over the 107 plots <strong>in</strong> the validation dataset, the plot levelregression overestimated the actual time by 1.05 m<strong>in</strong>utes per plot. The average time <strong>of</strong> thevalidation dataset was 21.05 m<strong>in</strong>utes while the test dataset average was 23.04 m<strong>in</strong>utes. Thedifference <strong>in</strong> these averages could expla<strong>in</strong> why the regression overestimates the validationdataset. S<strong>in</strong>ce the dataset was randomly chosen, the different average times were unavoidable.To calculate the economic efficiency <strong>of</strong> <strong>in</strong>clud<strong>in</strong>g the sonar-based hypsometer and treecalipers <strong>in</strong> a forest <strong>in</strong>ventory, the plot level regression results <strong>of</strong> two <strong>in</strong>ventories, one with thesonar-based hypsometer/caliper comb<strong>in</strong>ation and one with manual hypsometer/loggers' tape,where simulated <strong>in</strong> a p<strong>in</strong>e stand us<strong>in</strong>g normal weather conditions, heavy brush, 37 p<strong>in</strong>esawtimber trees per acre, and 5 non-p<strong>in</strong>e sawtimber trees per acre. The estimated time requiredwith the manual hypsometer/loggers' tape was 15.6 m<strong>in</strong>utes, while the estimated time requiredwith the sonar-based hypsometer/tree calipers was 11.7 m<strong>in</strong>utes.If two forest technicians worked 8 hours, they could complete 27 plots <strong>in</strong> a day's timeus<strong>in</strong>g the manual hypsometer/loggers' tape if they averaged 3 m<strong>in</strong>utes travel time between plots.Under the same conditions, the same forest technicians could complete 34 plots <strong>in</strong> a day's time ifthey employed the use <strong>of</strong> the sonar-based hypsometer and tree calipers. The annual costs <strong>of</strong> the<strong>in</strong>ventory methods are shown <strong>in</strong> Table 7. Us<strong>in</strong>g the sonar-based hypsometer/caliper comb<strong>in</strong>ationa forest manager could decrease the cost per plot by $1.28 over the course <strong>of</strong> a year’s time andexpect a 27% <strong>in</strong>crease <strong>in</strong> worker production. The additional <strong>in</strong>vestment <strong>in</strong> the sonar-based32
hypsometer would be returned <strong>in</strong> the first 1,094 plots after the orig<strong>in</strong>al 6,000 plots expectedunder the use <strong>of</strong> loggers’ tape/manual hypsometer comb<strong>in</strong>ation <strong>in</strong> the forest <strong>in</strong>ventory.Table 7. Annual costs <strong>of</strong> different <strong>in</strong>ventories us<strong>in</strong>g the plot level regression.AnnualPlots/ Work Hrs/ Technicians’ Cost/<strong>Inventory</strong> Method yr yr Salary plotManual hypsometer/loggers’ tape 6,500 2,000 $40,000 $5.95Sonar-based hypsometer/caliper 8,000 2,000 $40,000 $4.67ConclusionsThe sonar-based hypsometer is a viable alternative to manual hypsometers that does<strong>in</strong>crease the efficiency <strong>of</strong> those employ<strong>in</strong>g its use. Results presented <strong>in</strong> this study were based ondata collected <strong>in</strong> the grow<strong>in</strong>g season when foliage was at its maximum. It seems likely thatmeasurements taken <strong>in</strong> the w<strong>in</strong>ter, when foliage is at its m<strong>in</strong>imum, would further <strong>in</strong>crease timesav<strong>in</strong>gs <strong>of</strong> the sonar-based <strong>in</strong>strument. <strong>Forest</strong> managers employ<strong>in</strong>g technicians to <strong>in</strong>ventorystands on a cont<strong>in</strong>ual basis should consider the use <strong>of</strong> sonar-based <strong>in</strong>struments.From a plann<strong>in</strong>g perspective, the equation to estimate plot time should prove useful t<strong>of</strong>orest managers. Predict<strong>in</strong>g time to perform <strong>in</strong>ventories should allow managers to moreaccurately plan how much <strong>in</strong>ventory<strong>in</strong>g can be completed by technicians. Equations can also actas quality control measures, ensur<strong>in</strong>g that the <strong>in</strong>ventory personnel are work<strong>in</strong>g efficiently.The biggest strength <strong>of</strong> this study was that it focused on the times required to <strong>in</strong>ventoryforests <strong>in</strong> an operational sett<strong>in</strong>g, <strong>in</strong>clud<strong>in</strong>g all aspects <strong>of</strong> the <strong>in</strong>ventory. It was designed aroundthe <strong>in</strong>ventory without modify<strong>in</strong>g the motions or movements <strong>of</strong> forest workers. For this reason,the results <strong>of</strong> the study can be used by forest managers with confidence. No portion <strong>of</strong> the<strong>in</strong>ventory was modified for ease <strong>in</strong> collect<strong>in</strong>g data. Future research should concentrate on theuse <strong>of</strong> more technologically advanced dendrometers and hypsometers <strong>in</strong> an operational sett<strong>in</strong>g.Many new pieces <strong>of</strong> equipment are tested for accuracy and precision, but not for improvedefficiency <strong>of</strong> forest workers.LITERATURE CITEDAmateis, RL., and Burkhart, HE. 1987. Cubic-Foot Volume Equations for Loblolly P<strong>in</strong>e Trees <strong>in</strong>Cutover, Site-Prepared Plantations. Southern Journal <strong>of</strong> Applied <strong>Forest</strong>ry. 11:190-192.B<strong>in</strong>ot, JM., Pothier, D., Lebel, J. 1995. <strong>Comparison</strong> <strong>of</strong> relative accuracy and time requirementbetween the caliper, the diameter tape and an electronic tree measur<strong>in</strong>g fork. The <strong>Forest</strong>ryChronicle 71(2): 197-200.Brickell, JE. 1970. More on Diameter Tapes and Calipers. Journal <strong>of</strong> <strong>Forest</strong>ry 68:169-170.Clark, A, III. Phillips, DR; Frederick, DJ. 1986. Weight, volume, and physical properties <strong>of</strong>major hardwood species <strong>in</strong> the Upland-South. Res. Pap. SE-257. Ashville, NC: U.S.Department <strong>of</strong> Agriculture, <strong>Forest</strong> Service, <strong>Southeast</strong>ern <strong>Forest</strong> Experiment Station. 55pp.33
Clark, A, III. Souter, RA. Schlaegel, BE. 1991. Stem Pr<strong>of</strong>ile Equations for Southern TreeSpecies. Res. Pap. SE-282. Ashville, NC: U.S. Department <strong>of</strong> Agriculture, <strong>Forest</strong> Service,<strong>Southeast</strong>ern <strong>Forest</strong> Experiment Station. 124pp.Clark, NA., Wynne, RH. Schmoldt, DL. 2000. A Review <strong>of</strong> Past Research on Dendrometers.<strong>Forest</strong> Science 46(4): 570-576.Hunt, EV., Jr. 1959. A Time and Accuracy Test <strong>of</strong> some Hypsometers. Journal <strong>of</strong> <strong>Forest</strong>ry57:641-643.McArdle, RE. 1928. Relative accuracy <strong>of</strong> calipers and diameter tape <strong>in</strong> measur<strong>in</strong>g Douglas-firtrees. Journal <strong>of</strong> <strong>Forest</strong>ry 26:338-342.Moran, LA., Williams, RA. 2002. <strong>Comparison</strong> <strong>of</strong> Three Dendrometers <strong>in</strong> Measur<strong>in</strong>g Diameter atBreast Height. New Zealand Journal <strong>of</strong> Applied <strong>Forest</strong>ry 19(1):28-33.Rennie, JC. 1979. <strong>Comparison</strong> <strong>of</strong> Height-Measurement Techniques <strong>in</strong> a Dense Loblolly P<strong>in</strong>ePlantation. Southern Journal <strong>of</strong> Applied <strong>Forest</strong>ry 3(4):146-148.Williams, MS., WA. Bechtold, and VJ. LaBau. 1994. Five Instruments for measur<strong>in</strong>g treeheight: An evaluation. Southern Journal <strong>of</strong> Applied <strong>Forest</strong>ry 18(2):76-82.W<strong>in</strong>g, MG., M. Solmie, and L. Kellogg. 2004. Compar<strong>in</strong>g Digital Range F<strong>in</strong>ders for <strong>Forest</strong>ryApplications. Journal <strong>of</strong> <strong>Forest</strong>ry 102(4): 16-20.Van Deusen, PC. Sullivan, AD., and Matney, TG. 1981 A Prediction System for CubicFoot Volume <strong>of</strong> Loblolly P<strong>in</strong>e Applicable Through Much <strong>of</strong> Its Range. SouthernJournal <strong>of</strong> Applied <strong>Forest</strong>ry. 5(4):186-189.34


