Understanding Rheology of Thermoplastic Polymers - TA Instruments
Understanding Rheology of Thermoplastic Polymers - TA Instruments
Understanding Rheology of Thermoplastic Polymers - TA Instruments

You also want an ePaper? Increase the reach of your titles
YUMPU automatically turns print PDFs into web optimized ePapers that Google loves.
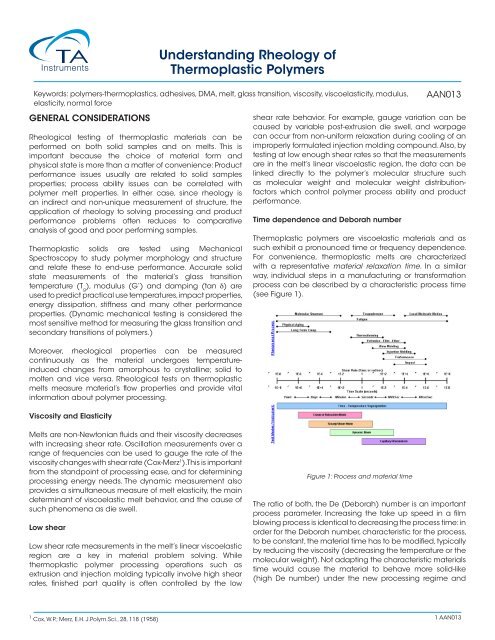
<strong>Understanding</strong> <strong>Rheology</strong> <strong>of</strong><strong>Thermoplastic</strong> <strong>Polymers</strong>Keywords: polymers-thermoplastics, adhesives, DMA, melt, glass transition, viscosity, viscoelasticity, modulus,elasticity, normal forceGENERAL CONSIDERATIONSRheological testing <strong>of</strong> thermoplastic materials can beperformed on both solid samples and on melts. This isimportant because the choice <strong>of</strong> material form andphysical state is more than a matter <strong>of</strong> convenience: Productperformance issues usually are related to solid samplesproperties; process ability issues can be correlated withpolymer melt properties. In either case, since rheology isan indirect and non-unique measurement <strong>of</strong> structure, theapplication <strong>of</strong> rheology to solving processing and productperformance problems <strong>of</strong>ten reduces to comparativeanalysis <strong>of</strong> good and poor performing samples.<strong>Thermoplastic</strong> solids are tested using MechanicalSpectroscopy to study polymer morphology and structureand relate these to end-use performance. Accurate solidstate measurements <strong>of</strong> the material’s glass transitiontemperature (T g), modulus (G’) and damping (tan δ) areused to predict practical use temperatures, impact properties,energy dissipation, stiffness and many other performanceproperties. (Dynamic mechanical testing is considered themost sensitive method for measuring the glass transition andsecondary transitions <strong>of</strong> polymers.)Moreover, rheological properties can be measuredcontinuously as the material undergoes temperatureinducedchanges from amorphous to crystalline; solid tomolten and vice versa. Rheological tests on thermoplasticmelts measure material’s flow properties and provide vitalinformation about polymer processing.Viscosity and ElasticityAAN013shear rate behavior. For example, gauge variation can becaused by variable post-extrusion die swell, and warpagecan occur from non-uniform relaxation during cooling <strong>of</strong> animproperly formulated injection molding compound. Also, bytesting at low enough shear rates so that the measurementsare in the melt’s linear viscoelastic region, the data can belinked directly to the polymer’s molecular structure suchas molecular weight and molecular weight distributionfactorswhich control polymer process ability and productperformance.Time dependence and Deborah number<strong>Thermoplastic</strong> polymers are viscoelastic materials and assuch exhibit a pronounced time or frequency dependence.For convenience, thermoplastic melts are characterizedwith a representative material relaxation time. In a similarway, individual steps in a manufacturing or transformationprocess can be described by a characteristic process time(see Figure 1).Melts are non-Newtonian fluids and their viscosity decreaseswith increasing shear rate. Oscillation measurements over arange <strong>of</strong> frequencies can be used to gauge the rate <strong>of</strong> theviscosity changes with shear rate (Cox-Merz 1 ). This is importantfrom the standpoint <strong>of</strong> processing ease, and for determiningprocessing energy needs. The dynamic measurement alsoprovides a simultaneous measure <strong>of</strong> melt elasticity, the maindeterminant <strong>of</strong> viscoelastic melt behavior, and the cause <strong>of</strong>such phenomena as die swell.Low shearLow shear rate measurements in the melt’s linear viscoelasticregion are a key in material problem solving. Whilethermoplastic polymer processing operations such asextrusion and injection molding typically involve high shearrates, finished part quality is <strong>of</strong>ten controlled by the lowFigure 1: Process and material timeThe ratio <strong>of</strong> both, the De (Deborah) number is an importantprocess parameter. Increasing the take up speed in a filmblowing process is identical to decreasing the process time: inorder for the Deborah number, characteristic for the process,to be constant, the material time has to be modified, typicallyby reducing the viscosity (decreasing the temperature or themolecular weight). Not adapting the characteristic materialstime would cause the material to behave more solid-like(high De number) under the new processing regime and1 Cox, W.P.; Merz, E.H. J.Polym.Sci., 28, 118 (1958)1 AAN013
lead to reduce performance and eventual breaking <strong>of</strong> thefilm. A low De number stands for a predominately viscousbehavior, a high De number for an elastic material response.Shear and ElongationAlso most rheological tests are done in shear using rotationalor capillary rheometers, process flows are usually mixedflows with elongation deformations being important anddominant in processes like film blowing, blow molding, fiberspinning, etc. The elongation viscosity <strong>of</strong> elastic materials atlarge deformations can deviate significantly from the shearviscosity and therefore is an important parameter to predictprocessing performance or to design process equipment.Elongation properties at large deformations correlate withmolecular structure. The elongation viscosity as such is a verysensitive indicator <strong>of</strong> long chain branchingEFFECT OF MOLECULAR STRUCTURE ANDMORPHOLOGY~M wawith a = 3.08 ± 0.39 in this exampleMolecular Weight DistributionBeyond the Newtonian region, melt viscosity drops withincreasing shear rate, a phenomenon called shearthinning. This behavior is considered the most importantnon-Newtonian property in polymer processing because itspeeds up material flow and reduces heat generation andenergy consumption during processing.At constant molecular weight, the amount <strong>of</strong> energy requiredto process the polymer is directly related to the viscosity’sshear rate dependence. The onset and degree <strong>of</strong> shearthinning vary among materials and qualitatively correlatewith the molecular weight distribution: <strong>Polymers</strong> with a broaddistribution tend to thin more at lower shear rates than thosewith a narrow distribution at the same average M w. (Figure 3).Molecular WeightMolecular weight is the main structural parameter <strong>of</strong>polymers’ flow behavior at temperatures above the glasstransition temperature (for an amorphous material) or themelting point (for a semi-crystalline polymer).Melt viscosity is a constant at low shear rates or frequencies.The viscosity in this region is known as the zero shear, orNewtonian, viscosity ho. For low molecular weight polymersin which chain entanglement is not a factor, the zero shearviscosity is proportional to the polymer’s molecular weight.However, above a critical molecular weight, chains beginto entangle and the zero shear viscosity depends muchstronger on molecular weight, proportional now to about the3.4 power <strong>of</strong> the molecular weight. This is shown in Figure 2.Rheological measurements are therefore ideal for studyingthe effects <strong>of</strong> molecular weight differences in resins as smalldifferences in molecular weight are manifested in largechanges in viscosity.Figure 3: Molecular weight distribution differences in polymer melts areeasily detected by measuring the complex viscosity η* as a function<strong>of</strong> frequency.Some important consequences <strong>of</strong> this: molding andextrusion can for example be made easier by broadeninga polymer’s molecular weight distribution; finished productcharacteristics, such as sag and haze in blown LDPE films,or surface smoothness in a variety <strong>of</strong> thermoplastic moldedgoods can be altered by changing molecular weightdistribution.The slope <strong>of</strong> the modulus versus the frequency curve for a meltalso mirrors changes due to molecular weight distribution.Isothermal measurements <strong>of</strong> the modulus at frequenciesbelow one reciprocal second show marked increases inthe storage modulus as distribution is broadened. Suchchanges have been used to distinguish between good andpoor performing products and guide subsequent productimprovements through adjustments in molecular weightdistribution (Figure 4).Figure 2: The zero shear viscosity is a sensitive measure <strong>of</strong> polymermolecular weight. The relationship for flexible linear polymers is ηo2 AAN013
Figure 4: Molecular weight distribution differences in polymer meltsshow best in the terminal region <strong>of</strong> the storage modulus G’.A good indicator <strong>of</strong> MWD changes is the cross over modulus G c.BranchingPolymer chain branches can vary in number, length anddistribution along the main chain. Increasing the number,the size, or the flexibility <strong>of</strong> the branches changes the meltviscosity. But if the branches are few and long enough toentangle, melt viscosity will be higher at low frequencythan that <strong>of</strong> a corresponding linear polymer <strong>of</strong> the samemolecular weight (Figure 5). The viscosity <strong>of</strong> long-branchedpolymers is more shear rate dependent than is the viscosity<strong>of</strong> linear polymers and long chain branching affects theelasticity <strong>of</strong> the polymer melts which shows in the normalstress difference and the storage modulus.Figure 6: Elongation viscosity <strong>of</strong> LDPE (branched) and LLDPE (linear)show pronounced differences at high total strains. This strainhardening effect is a characteristic feature <strong>of</strong> long chain branchingFillersAdding fillers to a neat polymer melt changes its rheology,influencing both the way the melt processes and theproperties <strong>of</strong> the ultimate product. Key factors are fillersize and shape, filler concentration, and the extent <strong>of</strong> anyinteractions among the particles.The consequences <strong>of</strong> adding fillers are an increase in meltviscosity and a decrease in die swell. Moreover do particleinteractions increase the non-Newtonian range and causeit to occur at a lower shear rate than for the unfilled polymermelt. Filled polymers have a higher viscosity at low shear rates,and yielding may occur with increased filler concentration(Figure 7). At higher shear rates the effect <strong>of</strong> the fillerdecreases and the matrix contributions dominate. Anothereffect <strong>of</strong> the filler is the reduction <strong>of</strong> the linear viscoelasticrange, characterized by the onset <strong>of</strong> the strain dependentbehavior.Figure 5: Effect <strong>of</strong> branching on the complex viscosity η* and thedynamic moduli G’, G””The extensional viscosity at high strains increases stronglywith long chain branches. Figure 6 compares the rheologicalresponses <strong>of</strong> a long chain branched LDPE and a linear LLDPEin elongation. The pronounced viscosity increase at largeelongation strains (strain hardening) is characteristic for longchain branching.Figure 7: The viscosity <strong>of</strong> a highly filled LDPE exhibits yielding at lowshear ratesBlendsPolymer blends are compositions <strong>of</strong> chemically differentpolymers. Polymer blends are homogeneous if thecomponents are compatible and mix at molecular level.3 AAN013
Blends are heterogeneous or incompatible if the componentsare present in separate phases. Usually the minor componentis dispersed in a matrix <strong>of</strong> the dominant component. Whethera blend is compatible or not, also depends on temperature;in this case the blend is considered partially miscible. Ifblends are incompatible, mechanical energy is needed todisperse the minor phase (mixing) and coalescence occursif the blend morphology is not stabilized. Interfacial forcessuch as the interfacial tension become important and canchange the rheological signature <strong>of</strong> the blend significantly.Moreover, the elastic properties <strong>of</strong> non-compatible blendsdepend on energy storage mechanisms at the interphase. Therelaxation <strong>of</strong> the dispersed phase itself is <strong>of</strong>ten much longerthan the relaxation <strong>of</strong> the polymer chains <strong>of</strong> the individualcomponents. Figure 8 shows the dynamic spectrum <strong>of</strong> aPMMA/PS blend with different volume fractions <strong>of</strong> the minorphase 2 . The additional low frequency contributions in G’ aredue to the form relaxations <strong>of</strong> the large dispersed domains<strong>of</strong> the minor phase. If the average droplet size is known (fromTEM for example), the interfacial tension can be calculatedfrom the average relaxation time <strong>of</strong> the droplet relaxation.Figure 9: PPO/HIPS blend modified with MBS. The additional transitionat -45°C independent <strong>of</strong> concentration proves poor compatibility 3Blending also provides a means to modify the elasticmodulus. Pressure sensitive adhesives PSA have the bestadhesion properties when the modulus is between 5x10⁵and 105 Pa at use temperature. By varying the content <strong>of</strong>tackifying resins in a natural or synthetic rubber matrix, themodulus can be adjusted as required (Figure 10).Figure 8: The increase contributions <strong>of</strong> G’ at low frequency can beused to calculate the interfacial tension <strong>of</strong> non-compatible blends 2Incompatible blends show distinct glass transitions for eachcomponent. However, the value may change in relation tothe pure components. Homogeneous blends exhibit only oneglass transition. Thus the evaluation <strong>of</strong> the glass transitionsprovides information about compatibility and interphaseeffects. Figure 9 shows the tan δ trace <strong>of</strong> an PPO/HIPS 50:50blend, modified with MBS a (methyl-metacrylatebutadienestyrene)copolymer 3 . The modifier shows as an additionaltransition at -45°C, independent <strong>of</strong> the concentration. Thepoor compatibility is a result <strong>of</strong> the specific structure <strong>of</strong> theMBS, which consists <strong>of</strong> a PMMA shell imbedding a core <strong>of</strong> SBrubber.Figure 10: Comparison <strong>of</strong> PSA adhesive based on natural rubber andSIS copolymers. The SIS-based adhesive exhibits a wider applicationwindow (constant G’= 10 5 Pa)Process flows induce orientation <strong>of</strong> the dispersed phase in noncompatibleblends. As a result <strong>of</strong> this fact, the morphology canbe modified to change the final product specific properties;a good example is the improved gas barrier in blow moldedbeverage bottles. Since non-compatible blends undergocoalescence in the melt state, compatibalizers such ascopolymers are added to stabilize the morphology. Anothertechnique to stabilize the morphology is reactive blending,which involves in situ chemical reactions at the interphase.APPLICATION EXAMPLESProcessingMolecular structure and ability to processRheological measurements are extensively used to study4 AAN013
polymer melts. The parameters obtained describe thefundamental behavior <strong>of</strong> materials such as ABS, PVC,polyolefin, etc. In processes such as bottle blow molding,injection molding, sheet forming, cable jacket extrusion,fiber spinning, etc., rheological measurements correlatemolecular structure, MW, MWD and LCB to such processingbehavior as flow rate, die swell, melt stability, recoverableshear and frozen-in stresses.<strong>TA</strong>BLE 1 M-1 M-2MF1 (190; 2.16) 0.6 0.5GPC (Mw) 131 500 133 600(Mz) 907 000 1 035 000η (@ 1s 1 ) 84 000 83 000η (@ 100s 1 ) 10 200 9 500Swell (%) 28 42Figure 12: Shear and elongation viscosity for LDPE, HDPE and LLDPE 5<strong>Rheology</strong> during injection molding - effect on residual strainsFor high viscosity melts such as filled thermoplastics orunvulcanized elastomers, cone plate measurements sufferfrom difficulties forming the sample prior testing as well asedge effects at higher shear rates during testing. Oscillationmeasurements, probing the material with a sinusoidal sheardeformation using parallel plates instead <strong>of</strong> cone plate, aremuch easier to perform.Figure 13 shows the dynamic mechanical characterization<strong>of</strong> an injection molding grade ABS. Capillary viscosity datacompare well with the absolute values <strong>of</strong> the complexviscosity, as suggested by Cox and Merz 1 and found by manyothers in unfilled systems.performance 4Figure 11 shows melt viscosity and the first normal stressdifference data, measured in cone plate. The two HDPE’s M-1and M-2, which were found to be very similar by capillaryviscometry and even GPC, yet they perform quite differentlyin a standard bottle blowing line4. M-2 produced significantlyheavier bottles. Although the viscosity and the molecularweight distribution (see Table 1 below the Figure 11) <strong>of</strong>these two materials are almost identical, the normal stressesreported differ significantly. The measured normal stressdifference correlates well with the parison swell - a differencein long chain branching or a small amount <strong>of</strong> high molecularweight component may be the origin. Due to the increaseddie swell, the parison is thicker, therefore the increased weight<strong>of</strong> the bottle. In order to evaluate the effect <strong>of</strong> long chainbranching, uniaxial elongation viscosity measurements inthe melt can be performed. Data are shown in Figure 12 forthree polyethylenes, an LDPE, a HDPE and an LLDPE 5 . The LDPEshows an pronounced strain hardening, i.e. a significantincrease <strong>of</strong> the viscosity with increasing Hencky deformation.This strain hardening stabilizes the parison - the wall thickness<strong>of</strong> the bottle during blow molding or the free film in a filmblowing process becomes more uniform. Strain hardeningwith a minimum <strong>of</strong> die swell and enough viscosity to preventsagging <strong>of</strong> the parison are the design criteria for a goodblow molding compound. The HDPE does show much lessstrain hardening and the LLDPE follows closely the trace <strong>of</strong> 3times the zero shear viscosity. The LLDPE also reaches steadystate much faster than the HDPE and the LDPE.Figure 11: Shear viscosity and first normal stress difference <strong>of</strong> two blowmolding polyethylenes M- 1 and M- 2 exhibiting significant processFigure 13: Oscillation and capillary data for an injection molding ABScompound. Cox-Merz η*(w)= η (γ) holds 1In addition to the viscosity, an oscillation measurement2 Friedrich, C. et all., J.Rheol. 39, (6), 1411 (1995).3 Ma, C.C.M., et all. Advances in Polymer Blends and Alloys, Vol. 22, A Technomic publication ISBN 87762-670-75 AAN013
provides also a measurement <strong>of</strong> the materials elasticity,represented by the storage modulus G’. G’ correlates withthe flow behavior in the mold and strongly influences therelaxation behavior and consequently orientation andfrozen-in strains. Relative warpage effects and melt strengthdepend also on the elastic nature <strong>of</strong> the polymer melt andthe resultant flow behavior in the mold.Sporadic surface crazing and cracking problems on themolded ABS parts are a result <strong>of</strong> too much orientation andresidual strains. Torsion tests on the solid sample in the glasstransition region can be used to quantify the amount <strong>of</strong>residual strains in an injection molded part. The pro<strong>of</strong> is givenin Figure 14, showing a DMA trace on freshly molded samplesand on companion pieces annealed under vacuum foreight hours at 180°C. The storage modulus G’ and tan δ weremeasured at a frequency <strong>of</strong> 1 Hz and a strain <strong>of</strong> 0,07% attemperatures from 120°C to 130°C. Clear differences werefound between the annealed and unannealed samplesnear the main glass transition: the sample with residualstrains had a higher tan δ over a wide range <strong>of</strong> temperaturesbelow the glass transition temperature T g. This relates to therelaxation <strong>of</strong> the backbone conformations <strong>of</strong> the orientedstyreneacrylnitrile component in the continuous phase. Theintensification <strong>of</strong> the loss dispersion just below the glasstransition is a sensitive monitor <strong>of</strong> molecular orientations inpolymers.Figure 14: Effect <strong>of</strong> annealing on loss tangent <strong>of</strong> an injection moldedABS partMelt degradation <strong>of</strong> PVCFigure 15: PVC melt stability followed in oscillation for sample A and Bat different temperaturesExtrusion problems <strong>of</strong> thermoplastic meltsThe extrusion <strong>of</strong> thermoplastics is a high shear process.However, this does not mean, that extrudate problems areassociated with high shear rate phenomena. As soon asthe extrudate emerges from the die, the shear rate declinesconsiderably - the extrudate swell is a comparable low ratephenomenon. Figure 16 shows the storage modulus as afunction <strong>of</strong> frequency, obtained from dynamic mechanicaltests on two grades <strong>of</strong> polyurethanes, used for medicaltubing. The specifications call for tight tolerances in diameterand wall thickness.The material with the higher G’’ provides too thick, the onewith the lower G’ too thin tubing. Under identical processingconditions, the small difference in elasticity represented by G’is enough to cause the tubing to be <strong>of</strong>f spec as a result <strong>of</strong>variations in die swell. During extrusion through the die, thepolymer orients and builds up internal strains. As the polymerleaves the die, these strains recover and the polymer swells.The degree <strong>of</strong> swelling depends on the ability <strong>of</strong> the materialto store deformation energy, the shear rate and the residencetime in the die. In the material, the distribution <strong>of</strong> molecularweight and the degree <strong>of</strong> branching affects the degree towhich internal strains form and recover. Because G’ is relatedto the amount <strong>of</strong> stored energy during the deformation, itprovides an estimate <strong>of</strong> to the degree <strong>of</strong> recovery <strong>of</strong> the PUresin. The greater G’, the higher the die swell, the thicker thetubing.Important in nearly all melt processing operations, meltdegradation can readily be followed by recording thedynamic moduli at constant frequency continuously as afunction <strong>of</strong> time at process temperature. PVC is particularlysensitive to process temperature, as shown in Figure 15for the two injection molding compounds A and B. Thetwo compounds differed in flame retardant additives andcolor concentrate. The effect on the thermal stability isdramatic. Sample A shows in comparison to sample B rapiddegradation after 20 minutes at 215°C, represented by asteep increase in viscosity.Figure 16: Two grades <strong>of</strong> extrusion polyurethane. The grade with thehigher elasticity (G’) produces the thicker tubing4 Macosko, C.W.; Lorntson, J.M. private communication (1973)5 Meissner, J. presented at Tezukayama College, Nara, Japan, October 19946 AAN013
Pipe surface quality defects can also be traced back to smallvariations <strong>of</strong> the melt elasticity. Too high elasticity, measurableby the storage modulus at low frequency, (Figure 17) causesrough surfaces during extrusion <strong>of</strong> HDPE pipes. Reducingthe elasticity by using an HDPE with a narrower molecularweight distribution eliminated the problem. Note that smallvariations <strong>of</strong> the molecular structure, caused by, for example,tiny amounts <strong>of</strong> a high molecular polymer may causesignificant processing problems. These variations are usuallynot detectable in MI values or standard SEC analysis.Figure 18: Modulus and damping <strong>of</strong> PP fibers, drawn in a one and atwo stage process down to the same extent. A smaller damping peakstands for higher crystallinity and fiber strength 8Figure 17: The elasticity, characterized by G’, correlates with the surfacequality <strong>of</strong> HDPE during extrusion. A rough surface corresponds to ahigh G’.PerformanceEffect <strong>of</strong> multi-stage drawing and moisture on the morphology<strong>of</strong> fibersThe morphology and final performance <strong>of</strong> synthetic fibersdepend to a large extent on their processing conditions.The extent and rate <strong>of</strong> draw is an important variable, withsignificant effects on the final properties. The drawingprocess results in molecular orientation and may enhancecrystallization as well as orient the crystals themselves 6 .Both phenomena impart high strength and can affect enduseperformance. The glass transition is a good indicator<strong>of</strong> morphological changes and the change in size <strong>of</strong> thetransition can be related to changes in crystallinity 7 . Figure18 shows the elastic modulus and the damping <strong>of</strong> two fibersfrom the same PP grade drawn down to the same extent;one fiber was drawn down by a one stage process while thesecond was produced in a two stage process. The two stagedrawn fiber has a higher elastic modulus at temperaturesabove the glass transition (-11.5°C). This can be related toincreased crystallinity due to a higher degree <strong>of</strong> orientation8.Although the glass transition at -11.5°C is the same for thetwo fibers, does the two-stage drawn fiber show a smallerdamping peak which also indicates a higher crystallinity. Ifcrystalline and amorhous phases coexist in a material, then areduced damping peak corresponds to an increased degree<strong>of</strong> crystallinity. These crystalline regions act as crosslinkingpoints that inhibit the sliding motion <strong>of</strong> the molecular chains,thus providing a fiber which exhibits greater strength.In condensation products such as nylon, the moisturecontent <strong>of</strong> the resin is a critical variable. In Figure 19, the DMAtraces <strong>of</strong> nylon fibers made from moist and pre-dried pelletsin an extrusion process are shown. The elastic modulus <strong>of</strong> themoist pellets has a higher value above the glass transition,which is evidently due to crosslinking reactions during theextrusion process. On the tan δ curve, both Tg and the ßtransition occur at the same temperature. Clearly the predriedsample has a higher damping peak than did the moistsample. Since the moisture content can affect the degree <strong>of</strong>crystallinity, the pre-dried sample would produce a fiber witha lower degree <strong>of</strong> crystallinity. In this situation, the moistureplasticizes the nylon and greatly increases the crystallizationkinetics.Figure 19: DMA trace <strong>of</strong> Nylon fibers. Moisture enhances thecrosslinking reactions during extrusion and increases the modulusabove T g. The higher damping at the transition for the dry sample isdue to lower crystallinityImproving the Impact Behavior <strong>of</strong> Polystyrene Juice CansOrange juice can molded from rubber-modified highimpact polystyrene (HIPS) resins exhibited variations inimpact resistance. High impact phenomena are related tomechanical deformations in the order <strong>of</strong> milliseconds. Due tothe equivalence <strong>of</strong> time and temperature, fast mechanical7 AAN013
processes at ambient temperature correlate with low speedtesting at low temperature. As such energy absorption,represented by the magnitude <strong>of</strong> tan δ at the ß peak,measured at frequencies <strong>of</strong> 1Hz correlate to toughness andimpact resistance (Figure 20). The shift in the glass transitiontemperature T gand the ß peak is due to compounding effectseither to compatibilization <strong>of</strong> the rubber and polymer phase.In this instance, the differences in tan δ result from variationsin the quantity and type <strong>of</strong> rubber impact modifier.Hot melts need to be tough and flexible at use temperaturefor most applications. Book binding compounds must notbecome brittle over the expected use temperature range.Figure 22 shows the dynamic modulus and the loss behaviorfor a typical hot melt (block copolymer). The differencesin storage modulus indicate a significant performancedifference at use temperature. The level <strong>of</strong> the loss moduluscan be related to the flexibility <strong>of</strong> the adhesive. Toughnesscan be correlated quantitatively to the transition representedby tan δ.Figure 20: DMA trace <strong>of</strong> HIPS. The good impact performance resultsfrom the compatibility <strong>of</strong> the rubber and styrene phase, showing asone ß transition instead <strong>of</strong> two in the compound with poor impactproperties.Figure 22: Flexibility correlates with the loss modulus, toughness relatesto the tan δ peaks 9Bond strength, Tack and peel, Toughness and flexibility <strong>of</strong>adhesivesAdhesive application characteristics and performancebehavior are governed by rheological properties. Makinga bond involves a low rate deformation typically around 11/s. Bond strength, a major performance criterion is testedby performing a peel or tack test. Tack and peel resistanceneed to be balanced correctly to make an ideal adhesive.All bonding and debonding processes can be related tothe viscoelastic behavior <strong>of</strong> an adhesive. Poor adhesives arefound as shown in Figure 21 for the modulus as a function<strong>of</strong> rate, to have either too much elasticity at high rates (forpeel) or too little at low rates (for tack). This causes a pooradhesive to either rip the substrate when peeling or to stickinadequately.Viscosity stability at processing temperatures is anotherimportant parameter for hot melt adhesives. Resins arefrequently kept for hours in open tanks in dispersingequipment. The viscosity versus time, as shown in Figure 23 fora polyamide-based resin, characterizes open time. The badsample after initial drop due to absorption <strong>of</strong> water builds upviscosity due to oxidative crosslinking and thus is not suitablewhen long open times are required.Figure 23: Pot Life <strong>of</strong> two hot melts. The bad batch shows a viscositybuild up as a result <strong>of</strong> oxidative crosslinking after 15 minutesRevised By A. FranckFigure 21: Tack and peel performance represented by the storagemodulus as a function <strong>of</strong> frequencyFor more information or to place an order, go tohttp://www.tainstruments.com/ to locate your local sales<strong>of</strong>fice information.6 Rong, S.D.; William, H.L. “Dynamic Mechanical Measurements <strong>of</strong> Mon<strong>of</strong>ilaments”, University Toronto Press (1985)7 Knox, J.R. “Dynamic Mechnical Analysis” chap 4 <strong>of</strong> Thermal Analysis <strong>of</strong> <strong>Polymers</strong>, University <strong>of</strong> Illinois Press (1987)8 Nielsen, L.E. “Mechanical Properties <strong>of</strong> <strong>Polymers</strong> and Composites”, Vol.1, Maecel Dekker, New York 19749 Bamborough, D.; Dunckley, P. Adhesives Age, November 19908 AAN013