Developing School Age Childcare - Department of Children and ...
Developing School Age Childcare - Department of Children and ...
Developing School Age Childcare - Department of Children and ...

Create successful ePaper yourself
Turn your PDF publications into a flip-book with our unique Google optimized e-Paper software.
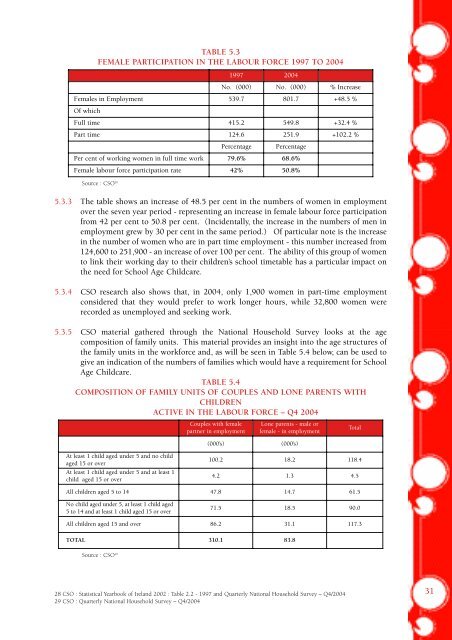
TABLE 5.3FEMALE PARTICIPATION IN THE LABOUR FORCE 1997 TO 20041997 2004No. (000) No. (000) % IncreaseFemales in Employment 539.7 801.7 +48.5 %Of whichFull time 415.2 549.8 +32.4 %Part time 124.6 251.9 +102.2 %PercentagePercentagePer cent <strong>of</strong> working women in full time work 79.6% 68.6%Female labour force participation rate 42% 50.8%Source : CSO 285.3.3 The table shows an increase <strong>of</strong> 48.5 per cent in the numbers <strong>of</strong> women in employmentover the seven year period - representing an increase in female labour force participationfrom 42 per cent to 50.8 per cent. (Incidentally, the increase in the numbers <strong>of</strong> men inemployment grew by 30 per cent in the same period.) Of particular note is the increasein the number <strong>of</strong> women who are in part time employment - this number increased from124,600 to 251,900 - an increase <strong>of</strong> over 100 per cent. The ability <strong>of</strong> this group <strong>of</strong> womento link their working day to their children’s school timetable has a particular impact onthe need for <strong>School</strong> <strong>Age</strong> <strong>Childcare</strong>.5.3.4 CSO research also shows that, in 2004, only 1,900 women in part-time employmentconsidered that they would prefer to work longer hours, while 32,800 women wererecorded as unemployed <strong>and</strong> seeking work.5.3.5 CSO material gathered through the National Household Survey looks at the agecomposition <strong>of</strong> family units. This material provides an insight into the age structures <strong>of</strong>the family units in the workforce <strong>and</strong>, as will be seen in Table 5.4 below, can be used togive an indication <strong>of</strong> the numbers <strong>of</strong> families which would have a requirement for <strong>School</strong><strong>Age</strong> <strong>Childcare</strong>.TABLE 5.4COMPOSITION OF FAMILY UNITS OF COUPLES AND LONE PARENTS WITHCHILDRENACTIVE IN THE LABOUR FORCE – Q4 2004Couples with femalepartner in employment(000’s)Lone parents - male orfemale - in employment(000’s)TotalAt least 1 child aged under 5 <strong>and</strong> no childaged 15 or overAt least 1 child aged under 5 <strong>and</strong> at least 1child aged 15 or over100.2 18.2 118.44.2 1.3 4.5All children aged 5 to 14 47.8 14.7 61.5No child aged under 5, at least 1 child aged5 to 14 <strong>and</strong> at least 1 child aged 15 or over71.5 18.5 90.0All children aged 15 <strong>and</strong> over 86.2 31.1 117.3TOTAL 310.1 83.8Source : CSO 2928 CSO : Statistical Yearbook <strong>of</strong> Irel<strong>and</strong> 2002 : Table 2.2 - 1997 <strong>and</strong> Quarterly National Household Survey – Q4/200429 CSO : Quarterly National Household Survey – Q4/200431