7 Twenty-Four Hours - Bureau of Labor Statistics
7 Twenty-Four Hours - Bureau of Labor Statistics
7 Twenty-Four Hours - Bureau of Labor Statistics

You also want an ePaper? Increase the reach of your titles
YUMPU automatically turns print PDFs into web optimized ePapers that Google loves.
Chapter 7, "<strong>Twenty</strong>-<strong>Four</strong> <strong>Hours</strong>: An Overview <strong>of</strong> the Recall Diary Method and Data<br />
Quality in the American Time Use Survey,"<br />
by Polly A. Phipps and Margaret K. Vernon<br />
from Calendar and Time Diary: Methods in Life Course Research,<br />
edited by Robert F. Belli, Frank P. Stafford, and Duane F. Alwin<br />
(SAGE Publications, Inc., 2009)<br />
Chapter 7, "<strong>Twenty</strong>-<strong>Four</strong> <strong>Hours</strong>: An Overview <strong>of</strong> the Recall Diary Method and Data Quality in<br />
the American Time Use Survey," by Polly A. Phipps and Margaret K. Vernon, appears in the<br />
book, Calendar and Time Diary: Methods in Life Course Research, which was published by<br />
SAGE Publications, Inc. Chapter 7 is in the public domain. You are free to use public domain<br />
material without specific permission. All other sections <strong>of</strong> this book are protected by copyright.
Introduction<br />
7<br />
<strong>Twenty</strong>-<strong>Four</strong> <strong>Hours</strong><br />
An Overview <strong>of</strong> the Recall Diary<br />
Method and Data Quality in<br />
the American Time Use Survey<br />
Polly A. Phipps and Margaret K. Vernon<br />
This chapter focuses on issues regarding the methodology and data quality<br />
inherent to the American Time Use Survey (ATUS). The ATUS is the first federally<br />
funded, ongoing, and nationally representative time use survey ever<br />
undertaken in the United States. The survey is sponsored by the U.S. <strong>Bureau</strong> <strong>of</strong><br />
<strong>Labor</strong> <strong>Statistics</strong> (BLS), and data are collected by the U.S. Census <strong>Bureau</strong>. Since<br />
2003, annual estimates <strong>of</strong> the amounts <strong>of</strong> time people spend in activities such<br />
as paid work, child care, volunteering, and socializing have been available and<br />
are posted for public consumption on the BLS Web site, along with public use<br />
microdata files. 1<br />
We first describe the development process that led to the ATUS, outline<br />
analytical uses <strong>of</strong> the data, and provide an overview <strong>of</strong> the ATUS methodology.<br />
Second, we focus on current methodological issues that affect data quality,<br />
including measurement error associated with the diary instrument, computerassisted<br />
telephone interviewing, and lack <strong>of</strong> secondary activities (activities<br />
AUTHORS’ NOTE: The views expressed here are those <strong>of</strong> the authors and do not<br />
necessarily represent the policies <strong>of</strong> the <strong>Bureau</strong> <strong>of</strong> <strong>Labor</strong> <strong>Statistics</strong>.<br />
109
110—VARIATIONS IN COLLECTION AND APPLICATION OF DATA<br />
done while doing something else); and nonresponse error associated with the<br />
sampling design and response burden. While time diaries are considered a<br />
tried-and-true method, there is ample literature documenting survey error and<br />
trade-<strong>of</strong>fs in different designs (National Academy <strong>of</strong> Sciences, 2000; Robinson,<br />
1985, 1999). Also, there are methodological issues that are relatively unexplored,<br />
such as understanding respondents’ cognitive processes when completing<br />
time diaries. We focus on both measurement and nonresponse error,<br />
describe current research that has assessed ATUS data quality, and suggest<br />
future research that could benefit and perhaps improve the ATUS.<br />
ATUS Development Process<br />
The United States has a long history <strong>of</strong> collecting data on time use, ranging<br />
from time-budget clocks collected by the Department <strong>of</strong> Agriculture in the<br />
1920s and 1930s to measure the time use <strong>of</strong> homemakers (Stinson, 1999), to a<br />
rich history <strong>of</strong> time use diary surveys carried out at the University <strong>of</strong> Michigan<br />
beginning in the 1960s and at the University <strong>of</strong> Maryland beginning in the<br />
1980s (Juster & Stafford, 1985; Robinson, 1999). In many countries, however,<br />
central statistical agencies conduct recurring time diary studies <strong>of</strong> their population:<br />
examples are Australia, Canada, Finland, Germany, Japan, Korea, New<br />
Zealand, the Netherlands, Norway, and Sweden, among others (Harvey &<br />
Pentland, 1999).<br />
The BLS first began to consider the idea <strong>of</strong> carrying out a time use survey<br />
in 1991 when Congress introduced a bill that called for the <strong>Bureau</strong> to conduct<br />
surveys to measure the amount <strong>of</strong> time spent on “unremunerated” or unpaid<br />
work in the United States and to place a monetary value on such work. 2 While<br />
exploring the idea <strong>of</strong> conducting a time use survey, the BLS began to realize the<br />
extent <strong>of</strong> federally sponsored time use surveys in other countries, and that the<br />
international statistics community considered a U.S. time use survey an important<br />
statistical effort.<br />
Launching a new federal survey is a major undertaking, requiring extensive<br />
design, testing, and funding approval (see Horrigan & Herz, 2004, for a<br />
detailed review <strong>of</strong> the ATUS development process). After initial design and<br />
development research, BLS undertook a time use feasibility test in 1997, presenting<br />
the results at a conference cosponsored by BLS and the MacArthur<br />
Network on Family and the Economy. In 1998, BLS put together a detailed plan<br />
for collecting time use data, forming the foundation for the ATUS methodology<br />
and funding proposal. The BLS simultaneously attended the 1999 National<br />
Academies workshop on the feasibility <strong>of</strong> collecting time use data, which<br />
helped to narrow and refine both methodological issues and analytical goals<br />
(National Academy <strong>of</strong> Sciences, 2000). In December <strong>of</strong> 2000 the survey received
approval and funding, and a BLS–Census <strong>Bureau</strong> team was formed to address<br />
management oversight, sampling and weighting, computerized instrument<br />
development, activity coding, and operations. Between December 2000 and<br />
January 2003, when data collection began, BLS undertook further pretesting,<br />
a field test, a dress rehearsal, and a prefielding period to resolve remaining<br />
problems.<br />
Analytical Uses<br />
<strong>Twenty</strong>-<strong>Four</strong> <strong>Hours</strong>—111<br />
While the ATUS was first considered as a way to measure and place a value on<br />
unremunerated work, many other analytical uses have since been brought to<br />
BLS’s attention (Frazis & Stewart, 2004, 2007; Hamermesh, Frazis, & Stewart,<br />
2005; Horrigan & Herz, 2004; Joyce & Stewart, 1999). Time diary data can be<br />
used across a wide range <strong>of</strong> disciplines to look at hours spent in paid work and<br />
productive nonmarket work, such as housework and child care. Work<br />
is just one <strong>of</strong> a number <strong>of</strong> major activities captured by time diaries; others<br />
include education, consumer purchases and services, eating and drinking,<br />
socializing and leisure, sports and exercise, personal care, religious participation,<br />
civic obligations, volunteering, and travel.<br />
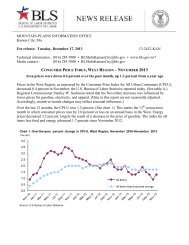
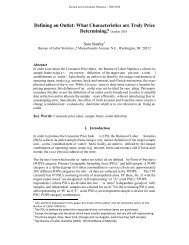
Time use data can be used to analyze the distribution and timing <strong>of</strong> activities<br />
over the course <strong>of</strong> a day, such as sleep, work, household, consumption, and<br />
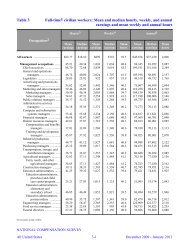
leisure activities. Figure 7.1 shows that work activities claim most <strong>of</strong> the morning<br />
and afternoon hours <strong>of</strong> employed persons during the workweek, with<br />
household and consumer activities peaking in the early evening, and leisure<br />
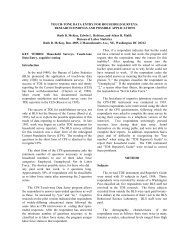
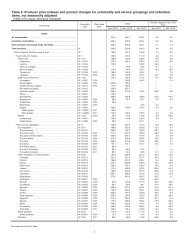
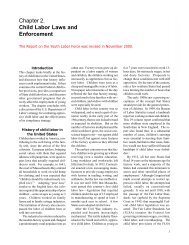
and sports activities continuing into the late evening. Further detail on leisure<br />
time is displayed in Figure 7.2, showing that on average, a little over 5 hours a<br />
day is spent in leisure time, with television watching making up the greatest<br />
share <strong>of</strong> leisure hours.<br />
Many researchers are interested in comparing time use between different<br />
groups, such as time spent in child care between men and women. Time use<br />
information that is collected on an ongoing basis, as the ATUS data are, allows<br />
for across-time comparisons. For example, the data might be used to assess<br />
changes in commuting time over several years. Researchers are interested in<br />
using time use data as a measure <strong>of</strong> quality <strong>of</strong> life, for example, looking at free<br />
time or leisure time, as well as time spent with friends and family, as indicators<br />
<strong>of</strong> well-being. In addition, sleep researchers use the data to assess amount <strong>of</strong><br />
time spent sleeping and when sleeping takes place. Time use data can be used<br />
to estimate the amount <strong>of</strong> time allocated to learning, such as time spent in class<br />
or in educational pursuits. There are also diverse users <strong>of</strong> time use data ranging<br />
from academia and government to business and legal communities. For<br />
example, both health and market researchers are interested in finding out how
112—VARIATIONS IN COLLECTION AND APPLICATION OF DATA<br />
Percent<br />
100<br />
90<br />
80<br />
70<br />
60<br />
50<br />
40<br />
30<br />
20<br />
10<br />
0<br />
4–5 am 7–8 am 10–11 am 1–2 pm 4–5 pm 7–8 pm 10–11 pm 1–2 am<br />
Sleeping Household activities<br />
Leisure and sports Purchasing goods and services<br />
Working and work-related activities<br />
Figure 7.1 Percentage <strong>of</strong> Employed Persons Doing Selected Activities on<br />
Workdays by Hour <strong>of</strong> the Day<br />
Playing games, using<br />
computer for leisure<br />
(20 minutes)<br />
Relaxing and thinking<br />
(17 minutes)<br />
Participating in sports,<br />
exercise, recreation<br />
(18 minutes)<br />
Reading<br />
(23 minutes)<br />
Socializing and<br />
communicating<br />
(45 minutes)<br />
Other leisure activities<br />
(29 minutes)<br />
Watching TV<br />
(2 hours, 38<br />
minutes)<br />
Figure 7.2 Average <strong>Hours</strong> per Day, Leisure and Sports Activities<br />
Total leisure and sports<br />
time on an average<br />
day = 5.2 hours<br />
Universe: All persons<br />
15 and over, all days <strong>of</strong><br />
the week combined<br />
Annual averages, 2004
much time people spend eating, and where eating takes place. The opportunity<br />
to analyze where activities take place in the latter example illustrates one <strong>of</strong> the<br />
unique features <strong>of</strong> time diary data, the collection <strong>of</strong> the activity location.<br />
Finally, lawyers are interested in using time use data to estimate the economic<br />
damages in personal injury and wrongful death cases. These are a few examples<br />
<strong>of</strong> how the ATUS data are being used, and there are almost certainly many<br />
more uses. 3<br />
Overview <strong>of</strong> ATUS Methodology<br />
<strong>Twenty</strong>-<strong>Four</strong> <strong>Hours</strong>—113<br />
Data collection for the ATUS occurs continuously on nearly every day <strong>of</strong> the<br />
calendar year. The sample size per year is approximately 24,000. The sample is<br />
nationally representative, and includes an oversample <strong>of</strong> Hispanic and black<br />
households, as well as households with children, in order to improve the reliability<br />
<strong>of</strong> the estimates for those groups. One person is randomly selected from<br />
each sample household to participate in the ATUS; selected persons are also<br />
assigned a specific day <strong>of</strong> the week about which to report. Response rates averaged<br />
57% in 2005, 4 resulting in approximately 13,000 completed interviews.<br />
The ATUS interview is a computer-assisted telephone interview (CATI) that<br />
takes, on average, about 20 minutes to complete. 5 During the interview, the<br />
preselected household member reports about his or her time use during the<br />
24-hour period <strong>of</strong> the day before the interview. Interviewers use a set <strong>of</strong><br />
scripted open-ended questions in tandem with conversational interviewing<br />
techniques 6 to walk respondents chronologically through the 24-hour day, collecting<br />
information about time spent in activities beginning at 4:00 a.m. on the<br />
previous day up until 4:00 a.m. <strong>of</strong> the interview day. The interviewer uses<br />
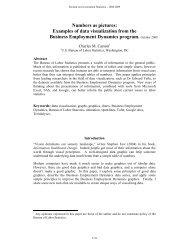
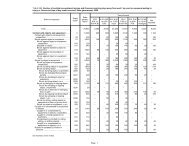
precoded categories to record commonly reported activities, and for other<br />
activities, he or she types the verbatim responses in the activity lines <strong>of</strong> the<br />
diary grid, as seen in Figure 7.3. For each activity reported, the interviewer asks<br />
how long the activity took, recorded either as a duration or with start and stop<br />
times. Respondents are also asked questions about who was in the room with<br />
them (if at their own or another’s home) or who accompanied them (if traveling<br />
or away from home) and where each activity took place, which are recorded<br />
using precoded categories. 7 There are some exceptions to the “who” and<br />
“where” rules: “who” and “where” information is not collected for certain<br />
personal activities (such as sleeping or grooming), nor is “who” information<br />
collected when respondents report working or attending high school. After<br />
completing this sequence <strong>of</strong> questions on an activity, interviewers prompt<br />
respondents for the next activity by asking them what they did next.<br />
Although the 24-hour recall diary is a fairly standard way to collect time<br />
use data, there are methodological challenges, including some that are unique
114—VARIATIONS IN COLLECTION AND APPLICATION OF DATA<br />
Figure 7.3 ATUS Computer-Assisted Telephone Interview, First Diary Screen<br />
to the ATUS. We highlight some <strong>of</strong> these challenging issues, such as instrument<br />
design, computer-assisted telephone interviewing technology, and sample<br />
design, that impact the data quality <strong>of</strong> time use estimates.<br />
Instrument Design<br />
Survey cost and data quality considerations led BLS to decide upon a 24-hour<br />
recall diary to be used in tandem with computer-assisted telephone interviewing.<br />
In North America, time use information has been collected extensively<br />
through the use <strong>of</strong> the 24-hour recall diary method. The 24-hour recall instrument<br />
was used in 1975–1976 and 1981–1982 at the University <strong>of</strong> Michigan; in<br />
1985, 1992–1994, 1995, and 1997–1998 at the University <strong>of</strong> Maryland; and in<br />
1992 and 1998 at <strong>Statistics</strong> Canada. While there is some consensus that a personal<br />
interview combined with a leave-behind paper diary covering more than<br />
one day is the “Mercedes” <strong>of</strong> time diary survey administration (National<br />
Academy <strong>of</strong> Sciences, 2000), the 24-hour recall diary has been shown to
<strong>Twenty</strong>-<strong>Four</strong> <strong>Hours</strong>—115<br />
produce good data with much lower costs (approximately 3 to 1; Juster, 1986).<br />
Robinson’s (1985) studies <strong>of</strong> reliability and validity <strong>of</strong> the 24-hour recall diary,<br />
conducted in the 1970s, found no systematic bias associated with the method<br />
when comparing it to paper diaries or activities respondents reported during a<br />
random hour <strong>of</strong> their diary day or when a pager was activated; nor did Juster<br />
(1986) in a comparison <strong>of</strong> husband and wife diaries. However, Robinson identified<br />
several problems, such as under- and overreporting, including the underreporting<br />
<strong>of</strong> activities with short time frames.<br />
In the 1990s, the use <strong>of</strong> cognitive interviews became commonplace to<br />
assess respondents’ comprehension <strong>of</strong> questions and ability to recall, judge,<br />
and communicate answers (Willis, 2004). While the 24-hour recall diary allows<br />
the respondent to describe his or her activities chronologically in an openended<br />
manner, little research had been conducted on the cognitive processes<br />
that respondents use to reconstruct their prior day. BLS and Westat researchers<br />
planning tests <strong>of</strong> the diary instrument were concerned about possible variation<br />
in data quality associated with differences in how respondents interpret “activities,”<br />
the effects <strong>of</strong> highly salient activities, routine activities, and schemata (or<br />
everyday activities) on recall; and heuristic or rule-<strong>of</strong>-thumb strategies for<br />
estimating activity duration (Forsythe, 1997b).<br />
Cognitive interviewing was carried out as part <strong>of</strong> the 1997 feasibility test<br />
to see how respondents interpreted “activities,” and what strategies were used<br />
to recall events. Findings from the 33 cognitive interviews indicated that participants<br />
recalled activities and time durations more easily when their activities<br />
and times were atypical and/or when they had an appointment or time<br />
commitment. Some participants used a visualization technique as part <strong>of</strong> the<br />
recall process, while others used a decomposition strategy—recalling a larger<br />
block <strong>of</strong> time or major activity to set time boundaries, then recalling what<br />
happened during the time period. While participants who lived by the clock<br />
reported by the clock, others had difficulty identifying starting and stopping<br />
times, and reported time durations instead. To assist comprehension and<br />
recall, a checklist <strong>of</strong> common activities was tested, but was found less successful<br />
than general probes such as simply asking if participants did anything else<br />
during the time period. In the actual feasibility field test, a standard 24-hour<br />
recall instrument with no probes for additional activities was tested against an<br />
“enhanced” recall instrument. The enhanced instrument included probes asking<br />
respondents whether they did something else during the time period, and<br />
if so, whether they stopped their initial activity to do the additional activity.<br />
The average number <strong>of</strong> activities and time accounted for were higher under<br />
the enhanced version, particularly for nonmarket work (Forsythe, 1997a), as the<br />
enhanced recall instrument elicited secondary activities (activities done while<br />
doing something else). However, concern about respondent burden, and the<br />
complexity involved in programming the computer s<strong>of</strong>tware to collect
116—VARIATIONS IN COLLECTION AND APPLICATION OF DATA<br />
additional activity time durations ultimately led to a decision not to attempt<br />
to collect secondary activities (Horrigan & Herz, 2004). Since the feasibility<br />
test, BLS has not conducted further research on respondent comprehension,<br />
recall, judgment, and communication associated with the questions used in<br />
the 24-hour recall diary. The computerized instrument, however, as well as<br />
interviewer instructions, has undergone numerous revisions since the ATUS<br />
has been in the field, based on the interviewer feedback about respondents’<br />
reactions and concerns that BLS obtains during regularly scheduled focus<br />
groups, debriefings, and refresher training sessions. Nonetheless, further<br />
research on understanding respondents’ cognitive processes as they complete<br />
the 24-hour recall diary questions could aid in developing additional instrument<br />
and interviewer interventions to assist respondents in their task and further<br />
reduce measurement error.<br />
Computer-Assisted Telephone Interviews<br />
Compared to a paper diary, using a computer-assisted telephone instrument<br />
(CATI) as the mode <strong>of</strong> data collection and having interviewers verbally walk the<br />
respondent through his or her 24-hour time diary presents both data quality<br />
advantages and disadvantages. A major advantage <strong>of</strong> 24-hour telephone recall<br />
using a CATI system is consistency and control in how data are collected. CATI<br />
allows for interviewer monitoring to make certain that interviews are being<br />
conducted in a uniform manner. The survey task is the same, presenting the<br />
same challenges, for every respondent. When a paper diary is issued and respondents<br />
are asked to fill it out, there is more uncertainty about how and when<br />
respondents might choose to fill out the diary. Some respondents might fill out<br />
the diary as they go through their day while others might choose to fill it out at<br />
the end <strong>of</strong> the day, or even several days later, depending on the survey design.<br />
While the 24-hour recall method utilizing CATI allows for more control,<br />
recalling activities that one did the previous day could be a more challenging<br />
task than filling out a diary as one goes through the day. Robinson’s (1985)<br />
finding that leave-behind paper diaries elicited about 5% to 10% more activities<br />
than recall interviews could suggest that recalling activities that one did the<br />
day before and cataloging the activities orally is a more cognitively difficult task<br />
than recording activities in writing. Alternatively, it has been documented that<br />
within a survey, telephone interviews <strong>of</strong>ten take less time than other modes <strong>of</strong><br />
administration, such as face-to-face interviews (McGrath, 2005). This could be<br />
because there is less chitchat on the phone compared with an in-person interview<br />
or because people simply don’t want to stay on the phone as long as they would<br />
talk with an in-person interviewer or take to fill out a paper diary. Based on<br />
these findings, it might be expected that there would be fewer activities
<strong>Twenty</strong>-<strong>Four</strong> <strong>Hours</strong>—117<br />
reported in a telephone diary task compared with an alternative mode. To<br />
examine this assumption, the ATUS conducted an experiment to assess<br />
whether having respondents fill out a paper diary in advance <strong>of</strong> the telephone<br />
interview would improve data quality, such as the number <strong>of</strong> activities collected,<br />
variety <strong>of</strong> activities 8 reported, and time estimates. The results <strong>of</strong> the test<br />
showed that there were no differences in the mean number <strong>of</strong> activities or<br />
types <strong>of</strong> activities reported or in the reporting <strong>of</strong> rounded time estimates<br />
between people who completed and did not complete an advance diary<br />
(National Opinion Research Center, 2002).<br />
Another major advantage <strong>of</strong> using a telephone interview is that interviewers<br />
can probe for and record the level <strong>of</strong> detail <strong>of</strong> activities needed to code the<br />
data properly. ATUS has a set <strong>of</strong> 15 precoded commonly reported activities that<br />
interviewers select from (shown in Figure 7.3), and they record actual activities<br />
verbatim when the activity does not clearly fit into a precoded category. The<br />
ATUS uses a three-tiered activity classification system that allows for very<br />
detailed coding <strong>of</strong> diary activities (Shelley, 2005). ATUS interviewers are trained<br />
in both interviewing and coding, so they know both how to record activities to<br />
make the coding task more reliable and when to probe for more detail, such as<br />
when a respondent reports an ambiguous or vague activity. This helps data<br />
quality in several ways. First, if interviewers were not present to probe for the<br />
appropriate level <strong>of</strong> detail, there would be higher levels <strong>of</strong> incorrectly coded or<br />
uncodable activity data in the diary. For example, in the ATUS coding scheme,<br />
grocery shopping is differentiated from other types <strong>of</strong> shopping. If interviewers<br />
were not present to find out what type <strong>of</strong> shopping took place, respondents<br />
might provide the diary entry “shopping,” which would be coded as “shopping,<br />
not otherwise classified,” providing less precise data for analysis purposes. In<br />
addition to obtaining more accurate and codable data, using trained interviewers<br />
allows for more consistency and reliability in how data are both collected<br />
and coded. For example, trained interviewers prompt and probe for level <strong>of</strong><br />
detail in a more consistent way than data would be gathered if each respondent<br />
personally wrote his or her own time diary. In addition to recording data, all<br />
interviewers code interviews. Interviewers do not code diary data they themselves<br />
collect, but code other interviewers’ diaries. In fact, each completed diary<br />
is coded separately by two different interviewers. If there is any inconsistency in<br />
how an activity is coded, the diary goes to an adjudicator who resolves the difference<br />
between the two codes. Thus, reliability checks are built in to make sure<br />
that the interviewers are collecting data consistently and with the appropriate<br />
level <strong>of</strong> detail. Having all interviewers trained and participating in both data<br />
collection and coding most probably leads to greater accuracy, consistency, and<br />
reliability in the data. Future research, such as an observational study <strong>of</strong> interviewer<br />
practices and coding reliability research, would help to verify the potential<br />
advantages <strong>of</strong> the ATUS operational methods.
118—VARIATIONS IN COLLECTION AND APPLICATION OF DATA<br />
In addition to interviewers being trained in recording and coding data,<br />
they are also trained in conversational interviewing techniques, which allows<br />
for checks to be built into the interview. Interviewers are trained to insert conversational<br />
data checks in several ways. First, though interviewers move forward<br />
in time through the instrument, they are trained to check back about<br />
timing <strong>of</strong> activities. For example, after a respondent says that he or she ate dinner<br />
for an hour, the interviewer might check back, “That brings us up to 7:00 p.m.,<br />
does that sound about right?” This type <strong>of</strong> time check helps respondents to<br />
stay “on track” when remembering their day’s activities and double checks<br />
with respondents on the sequence and timing <strong>of</strong> activities. The CATI instrument<br />
is flexible and accommodates changes, additions, and deletions <strong>of</strong> activities<br />
and times.<br />
In addition to time checks, interviewers are trained to confirm an activity<br />
or activity length at any time in the interview if a respondent says something<br />
that doesn’t make sense. There are also required checks built into the instrument<br />
asking about work breaks; activities other than work, school, or sleep<br />
lasting longer than 2 hours; and sleep lasting more than 10 hours. Often these<br />
checks reframe activities for respondents, helping them to catch mistakes in<br />
reporting and provide logical and coherent time data.<br />
Finally, interviewers are trained to use one <strong>of</strong> several techniques to facilitate<br />
recall when respondents have difficulty remembering what activity they<br />
did next. One such technique is called working backwards. If a respondent<br />
can’t remember what he or she did right after lunch, interviewers will ask,<br />
“Alright, what is the next thing you remember doing (and what time did that<br />
take place)?” Interviewers will then prompt respondents and try to jog their<br />
memories by saying, “You finished eating lunch at 1:00 and you can remember<br />
sitting down to watch Oprah at 4:00. Can you think <strong>of</strong> what you did in<br />
between?” This working backwards technique will <strong>of</strong>ten help respondents to<br />
fill in the gaps. Interviewers are also trained in visualization techniques. For<br />
example, they might ask respondents to picture where they were in order to<br />
facilitate recall. Following with the previous example, an interviewer might say,<br />
“You said that you went into the family room to watch Oprah at 4:00. Can you<br />
picture where you were right before you walked into the family room?”<br />
Although visualization is less commonly used by interviewers than working<br />
backwards, this technique does help respondents to remember forgotten activities.<br />
ATUS regularly conducts interviewer debriefings to determine how<br />
conversational interviewing and recall techniques are used and to develop<br />
refresher training and/or revise interviewer instructions accordingly. Further<br />
research to evaluate how conversational interviewing and specific recall techniques<br />
are used by interviewers and whether the techniques are successful in<br />
helping respondents reconstruct their day would provide important information<br />
on ATUS procedures and data quality.
Secondary Activities<br />
<strong>Twenty</strong>-<strong>Four</strong> <strong>Hours</strong>—119<br />
Closely related to the telephone collection method, the automated instrument<br />
used to collect and synthesize data over the phone also plays a role in data<br />
quality. A drawback to using the current CATI instrument is that it cannot be<br />
configured to collect the duration <strong>of</strong> secondary or simultaneous activities<br />
(Horrigan & Herz, 2004). While the activity itself can be collected, time durations<br />
are programmed to correspond to a 24-hour time period, with no overlapping<br />
times. In contrast, time use studies that use leave-behind paper diaries<br />
and allow people to record primary and secondary activities find that people<br />
are <strong>of</strong>ten engaged in two or more activities at any given time (Robinson,<br />
1985). If an ATUS respondent reports that he or she was working on the computer<br />
and listening to the radio, interviewers are trained to ask, “Which was<br />
your main activity?” Both activities are recorded (with the primary/main<br />
activity recorded first), but only the main activity is subsequently coded and<br />
output in the data, so the information about the secondary activity is lost. In<br />
other cases information on secondary activities is never captured at all, as the<br />
respondent is unlikely to <strong>of</strong>fer the information, and there is no interviewer<br />
probe for additional activities. This may affect data quality for several reasons.<br />
First, without the systematic collection and coding <strong>of</strong> secondary or even tertiary<br />
activities, it is impossible to capture the full complexity and diversity <strong>of</strong><br />
activities that humans engage in during a 24-hour day. When only primary<br />
activities are captured, 24-hours’ worth <strong>of</strong> time is accounted for, but the<br />
number <strong>of</strong> activities that a person engages in is underestimated. Thus ATUS<br />
data do not provide a complete picture <strong>of</strong> the total number and different types<br />
<strong>of</strong> activities people engage in throughout the day, or <strong>of</strong> how people combine<br />
different activities at any given time. One such area <strong>of</strong> research that could<br />
be very interesting, for example, would be to learn more about how people<br />
engage themselves on their commutes to work. Some people might use<br />
this time to catch up on phone calls, to read or listen to music, or even sleep<br />
or eat breakfast.<br />
The absence <strong>of</strong> secondary activities is less problematic for estimates produced<br />
for activities that are always done and coded as main or primary activities.<br />
For example, travel is always coded as a primary activity in the ATUS.<br />
Therefore, the travel that people engage in and the amounts <strong>of</strong> time in a<br />
24-hour day that people spend traveling are well captured by the ATUS. The<br />
ATUS estimate for time spent in travel has been shown to be a valid measure.<br />
Bose and Sharp (2005) found that estimates for time spent in travel produced<br />
by the ATUS and the <strong>Bureau</strong> <strong>of</strong> Transportation <strong>Statistics</strong> are very similar. Work<br />
is another activity usually coded as a main activity. Frazis and Stewart (2004)<br />
compared estimates <strong>of</strong> respondents’ hours worked from ATUS time diaries to<br />
Current Population Survey (CPS) estimates and found that they were quite
120—VARIATIONS IN COLLECTION AND APPLICATION OF DATA<br />
similar, when usual hours were controlled for, and the respondent’s diary day<br />
falls inside the CPS reference week.<br />
While certain types <strong>of</strong> activities, such as travel and work, that are done as<br />
primary activities are well captured by the ATUS, activities that are done frequently<br />
as secondary activities are not. One such activity we highlight that is <strong>of</strong><br />
importance to the <strong>Bureau</strong> <strong>of</strong> <strong>Labor</strong> <strong>Statistics</strong> is child care. As was mentioned in<br />
the introduction, the ATUS was originally conceived as a way to place a value<br />
on nonmarket work. Accurately capturing time spent in child care is essential<br />
to this task. Yet much <strong>of</strong> the child care activity that caregivers engage in is <strong>of</strong>ten<br />
done as a secondary activity. Parents, guardians, and caregivers are likely to<br />
“keep an eye” on children and be responsible for them while engaging in primary<br />
activities such as traveling for errands, cleaning around the house, and<br />
even while doing personal care activities such as showering or dressing.<br />
In order to improve estimates <strong>of</strong> the total amount <strong>of</strong> time spent in secondary<br />
child care, the ATUS cognitively tested questions measuring supervision<br />
<strong>of</strong> children and added a summary question that follows the main time<br />
diary section <strong>of</strong> the interview (Schwartz, 2001). The summary question asks,<br />
“During any part <strong>of</strong> the day yesterday was a child who is 12 years old or<br />
younger in your care?” 9 If the response is yes, the interviewer checks a box next<br />
to the relevant primary activity to indicate that a child was being cared for, capturing<br />
passive secondary child care that occurred while the respondent was<br />
doing something else as a main activity. In 2003, this secondary child care<br />
question increased estimates <strong>of</strong> total time spent in child care by approximately<br />
1.75 hours per day for the population. 10<br />
The secondary child care summary question was not designed to capture active<br />
secondary child care. Because the ATUS does not collect information on active secondary<br />
child care, the survey cannot provide information on specific active child<br />
care that takes place as a secondary activity. For example, reading and talking<br />
with children is <strong>of</strong> critical importance to children’s academic and social development.<br />
If talking with one’s child took place as a secondary activity (which<br />
one might assume would happen quite <strong>of</strong>ten), and was captured as secondary<br />
care, analysts would not be able to break apart how much time parents are<br />
spending doing this activity with children. Furthermore, Fisher (2005) suggested<br />
that time spent reading with children <strong>of</strong>ten occurs during travel; for<br />
example, reading in the car, on the train, or on the bus. Since travel is always<br />
coded as a primary activity in the ATUS, this reading activity would be captured<br />
as “care” and would not be separated from other types <strong>of</strong> more passive<br />
care such as “keeping an eye on” a child. These examples make the point that<br />
while the summary question method does increase time estimates <strong>of</strong> child care,<br />
the rough level <strong>of</strong> care captured does not allow for more refined analyses <strong>of</strong> the<br />
type <strong>of</strong> care being provided. Given the complexity <strong>of</strong> collecting child and<br />
parental activities and time, other studies have taken an alternative measurement
<strong>Twenty</strong>-<strong>Four</strong> <strong>Hours</strong>—121<br />
approach. For example, the Child Development Supplement <strong>of</strong> the Panel Study<br />
<strong>of</strong> Income Dynamics at the University <strong>of</strong> Michigan collected time diary data<br />
from children and/or their caregivers to produce estimates <strong>of</strong> time children<br />
spend interacting with caregivers (Stafford & Yeung, 2005).<br />
Bianchi, Wight, and Raley (2005) compared secondary child care estimates<br />
from the ATUS (which uses the summary question measure) to the 2000<br />
National Survey <strong>of</strong> Parents (NSP), which uses a probe asking, “What else were<br />
you doing?” to collect secondary in addition to primary activities. They found<br />
that there are large differences in time estimates <strong>of</strong> secondary care using these<br />
two different methods. For example, they report that the 2000 NSP picked up<br />
about 0.4 hours per day <strong>of</strong> secondary child care for fathers, while the 2003<br />
ATUS picked up about 4.5 hours per day for fathers. As already noted, however,<br />
the ATUS question wording for child care is broader than typical definitions.<br />
The “in your care” language is designed to pick up on indirect or passive<br />
child care—or times when care or assistance could have been given—rather<br />
than more active types <strong>of</strong> care. It seems that when people report secondary<br />
activities using the “what else were you doing” probe they typically think <strong>of</strong><br />
more active types <strong>of</strong> care. Recent work by Allard, Bianchi, Stewart, and Wight<br />
(2006) confirms this distinction. They compare the ATUS and NSP on three<br />
measures <strong>of</strong> child care and find that the surveys produce similar estimates <strong>of</strong><br />
primary child care and time spent with children, the latter a broad measure calculated<br />
using the “who were you with” question asked <strong>of</strong> ATUS and NSP<br />
respondents for each primary activity. To measure secondary child care, the<br />
authors compare time estimates from the NSP secondary activity question<br />
“what else were you doing” to the ATUS “in your care” summary question,<br />
excluding primary child care, and times when the respondent and all children<br />
are asleep. Their results and conclusions indicate that the surveys are very<br />
different in regard to secondary child care. The ATUS is more consistent with<br />
a passive-care concept, capturing 5.8 hours per day <strong>of</strong> secondary child care<br />
compared to eight-tenths <strong>of</strong> one hour per day in the NSP, a measure more consistent<br />
with an activity-based concept.<br />
While the ATUS has made substantial efforts to capture time spent in secondary<br />
child care, there may be other activities <strong>of</strong> interest that are being underrepresented<br />
because they are <strong>of</strong>ten done as secondary activities. For example,<br />
the Economic Research Service sponsored new questions that were added to the<br />
ATUS in October <strong>of</strong> 2005 that capture secondary eating and drinking, or eating<br />
and drinking that takes place while the respondent is doing something else.<br />
Preliminary data suggest that the questions designed to capture secondary eating<br />
and drinking are increasing the number <strong>of</strong> episodes <strong>of</strong> eating and drinking<br />
reported, and increasing estimates for the amount <strong>of</strong> time spent eating and<br />
drinking. Other activities, such as watching TV, listening to the radio, talking on<br />
the telephone, talking with a spouse or other family members, and cuddling
122—VARIATIONS IN COLLECTION AND APPLICATION OF DATA<br />
family pets, also may be underrepresented. Thus, the operational limitation <strong>of</strong><br />
using a CATI instrument that does not capture secondary activities impacts<br />
data quality in two ways. First, people <strong>of</strong>ten engage in more than one activity at<br />
any given time, so the instrument fails to capture the full complexity <strong>of</strong> human<br />
behavior. Second, certain types <strong>of</strong> activities that <strong>of</strong>ten take place as secondary<br />
activities are undercounted and underrepresented more than other types <strong>of</strong><br />
activities, affecting the frequency counts and time estimates <strong>of</strong> such activities.<br />
Sample Design Methodology<br />
The ATUS uses a household population–based sample to provide estimates on<br />
how the U.S. population uses its time. Respondents are age 15 and older. The<br />
ATUS sample is selected from households that have completed their eighth and<br />
final Current Population Survey (CPS) interview. Households become eligible<br />
for selection into the ATUS sample 2 months after their final CPS interview. The<br />
CPS is a BLS-sponsored monthly panel survey that collects information about<br />
employment, unemployment, and household composition. Drawing the sample<br />
from CPS households is a very efficient way to select a scientific sample<br />
because the demographic, employment, and contact information <strong>of</strong> respondents<br />
is already known. It also decreases respondent burden because the ATUS<br />
can update household composition and selected demographic and employment<br />
information rather than collect it for the first time. In addition, the use <strong>of</strong> the<br />
CPS as a sampling frame reduces sampling costs. While drawing the ATUS<br />
sample from CPS households does decrease respondent burden and allows for<br />
an efficiently selected sample, this method is not without its liabilities.<br />
RESPONSE RATE AND BURDEN<br />
First, to be selected into the ATUS sample, the household must have completed<br />
the final CPS interview (wave 8). Wave 8 on average has the highest<br />
response rate <strong>of</strong> the eight CPS panels: 93.2% in 2004. However, the approximately<br />
6.8% <strong>of</strong> sample members who refuse the CPS interview or are not able<br />
to be contacted have no chance <strong>of</strong> being selected for the ATUS sample. This<br />
could be a source <strong>of</strong> error, including bias. For example, Dixon and Tucker<br />
(2000) found multiunit housing structures; some demographic groups,<br />
including males and persons <strong>of</strong> black race; people enrolled in school; and those<br />
with higher than usual hours worked were associated with higher CPS nonresponse.<br />
How this might affect the ATUS sample has not yet been examined.<br />
Second, the ATUS has a lower than desired response rate, ranging from an<br />
average <strong>of</strong> 56% to 58% per year over the first 3 years <strong>of</strong> production. 11 Of the<br />
44% nonresponse in 2003, 12 the types <strong>of</strong> nonresponse outcomes, from highest<br />
to lowest are: refusals (19.3%); unknown eligibility due to an incorrect or
<strong>Twenty</strong>-<strong>Four</strong> <strong>Hours</strong>—123<br />
unconfirmed telephone number (9.9%); inability to contact respondents on the<br />
designated day (7.3%); and other noninterviews, including language barriers<br />
and health issues (7.2%; O’Neill & Dixon, 2005). 13 In 2004, the ATUS recontacted<br />
a subset <strong>of</strong> respondents and nonrespondents to discuss why they did or did not<br />
choose to participate in the ATUS (O’Neill & Sincavage, 2004). Of this subset,<br />
approximately 32% <strong>of</strong> nonrespondents and 81% <strong>of</strong> respondents participated in<br />
the recontact survey. The main reason nonrespondents gave for not participating<br />
in the ATUS was their previous CPS participation. Both nonrespondents and<br />
respondents reported that they felt that they were doing more than their “fair<br />
share” and that they were tired <strong>of</strong> the Census <strong>Bureau</strong> calling them. ATUS nonrespondents<br />
also stated several other reasons for not participating, however; survey<br />
fatigue was by far the most <strong>of</strong>ten stated reason. Thus, drawing the sample<br />
from CPS households increases sample efficiency and decreases survey costs,<br />
including a reduced interview length, but has a tendency to overburden and<br />
fatigue some persons who are selected to participate in both the CPS and ATUS.<br />
Other features <strong>of</strong> the sampling design also contribute to nonresponse. In<br />
particular, the ATUS randomly selects one person from a household and preselects<br />
a designated day <strong>of</strong> the week for which that person is to report. 14 This<br />
design ensures the sample is representative and all days <strong>of</strong> the week are equally<br />
represented. 15 However, designating one person means that if the person is<br />
unavailable, an alternative person in the household cannot complete the survey<br />
as a proxy respondent, as is the practice in the CPS. In addition, when the<br />
designated person is busy on the assigned reporting day, he or she either might<br />
be more difficult to contact or may refuse to participate. For example, if the<br />
designated reporting day is a Thursday, and the respondent is out <strong>of</strong> the house<br />
working all day and then goes to a class in the evening, he or she would be very<br />
difficult to contact. The ATUS sample stays in rotation for 8 weeks, so a person<br />
assigned to report on a Thursday would be contacted every Thursday for<br />
8weeksinarow. 16 However, if this person is out <strong>of</strong> the house every Thursday,<br />
he or she would be difficult to contact on any Thursday. Selecting a designated<br />
person and assigning a day <strong>of</strong> the week helps to ensure a representative sample,<br />
but contributes to both noncontact and refusal to participate in the ATUS.<br />
Potential problems in contacting the selected respondent and obtaining a<br />
high response rate were identified as early as the 1997 feasibility test (Levin,<br />
1997). In response, BLS put a great deal <strong>of</strong> effort into field testing alternative<br />
advance contact methods, number <strong>of</strong> eligible interviewing days, advance interview<br />
scheduling, 4- versus 8-week data collection duration, telephone versus<br />
in-person interviews, and incentives. The procedures with the highest return on<br />
investment were adopted (within budget constraints), including use <strong>of</strong> priority<br />
mail for advance contact, an 8-week data collection period, and incentives for<br />
households without a telephone number (Piskurich, Nelson, & Herz, 2001).<br />
Based on informational gaps and reasons for participation identified in the 2004<br />
survey <strong>of</strong> respondents and nonrespondents, BLS added an “Information for
124—VARIATIONS IN COLLECTION AND APPLICATION OF DATA<br />
Respondents” link to its Web site and introduced revised advance materials.<br />
Further research on survey sample design—including the role that increasing cell<br />
phone use might be playing with regard to noncontact—and field procedures is<br />
now under way to identify interventions that could reduce nonresponse.<br />
EFFECTS OF NONRESPONSE<br />
Relatively low response rates <strong>of</strong> approximately 56%–58% have raised concern<br />
that there might be bias in the time use estimates. Two studies have been<br />
undertaken to assess nonresponse bias. O’Neill and Dixon (2005) found that<br />
several demographic characteristics including race, age, marital status, and<br />
presence <strong>of</strong> relatives in the household were related to the probability <strong>of</strong> being<br />
unable to contact a sample member, or for the sample member to directly<br />
refuse to participate. But their findings showed little evidence <strong>of</strong> bias across<br />
time use categories. Using CPS data and propensity scoring to model who<br />
among the actual respondents looked most like nonrespondents, they found<br />
that the modeled nonrespondents spent less time in household activities and<br />
more time in personal care and religious activities. The category <strong>of</strong> personal<br />
care (sleeping, showering, grooming, and personal/private activities) showed<br />
the biggest evidence <strong>of</strong> bias; however, the difference was still relatively small,<br />
approximately 12 minutes out <strong>of</strong> a total <strong>of</strong> 12 hours. The second study, by<br />
Abraham, Maitland, and Bianchi (2005), found a number <strong>of</strong> similar factors<br />
were related to the probability <strong>of</strong> participating in the survey, such as age, race,<br />
education, marital status, hours worked by the respondent and his or her<br />
spouse, ages <strong>of</strong> children in the household, presence <strong>of</strong> other adults in the<br />
household, home ownership, and urbanicity. However, when Abraham and<br />
colleagues constructed new weights based on response propensities and compared<br />
the time use estimates to those produced using BLS standard weights,<br />
there were only minimal differences. Both <strong>of</strong> these studies have congruent<br />
findings that suggest that despite nonrandom nonresponse, the estimates show<br />
little evidence <strong>of</strong> bias due to nonresponse. Abraham and colleagues are planning<br />
further research using ATUS telephone call history data to compare time<br />
use estimates <strong>of</strong> difficult and easy to contact respondents.<br />
Conclusion<br />
The BLS has accomplished much in bringing the ATUS to implementation,<br />
building on the hard work and successes <strong>of</strong> the time use research community,<br />
and filling a major void in U.S. national statistics. The ATUS is now in the<br />
7th year <strong>of</strong> data collection. Yearly time use estimates are published by BLS, and<br />
there is an active community <strong>of</strong> analysts using the data for both substantive<br />
and methodological research.
The current ATUS methodology impacts data quality in a variety <strong>of</strong> ways.<br />
The 24-hour diary is considered a tried-and-true method, allowing respondents<br />
to report their daily activities in a relatively open-ended way. Yet relatively<br />
little research has been conducted on how respondents understand and<br />
structure the 24-hour recall diary task, the strategies they use to recall activities<br />
and times, how they judge the adequacy <strong>of</strong> a response and communicate it<br />
to the interviewer, and how interviewers shape the interaction. Computerassisted<br />
telephone interviewing provides consistency in how activities are<br />
reported compared with a paper diary that individuals fill out at their leisure.<br />
It is also much less expensive than an in-person interview. However, the<br />
current CATI program doesn’t allow for collection <strong>of</strong> time durations for<br />
secondary activities, reducing the accuracy <strong>of</strong> time estimates for activity<br />
categories <strong>of</strong>ten done as secondary activities.<br />
Sample design methodology also impacts data quality in different ways.<br />
A sample drawn from the CPS helps keep costs down and lessens burden in<br />
the form <strong>of</strong> a shorter interview, but increases nonresponse due to respondent<br />
fatigue. Randomly selecting one person from a household and interviewing<br />
him or her on a designated day ensures representation <strong>of</strong> the sample and days<br />
<strong>of</strong> the week, but also contributes to survey nonresponse. Yet, even with lower<br />
than desired response rates, studies conducted so far have not found bias associated<br />
with nonresponse.<br />
As with most surveys, many methodological decisions and trade-<strong>of</strong>fs were<br />
made when designing the ATUS. Options were carefully considered: Studies and<br />
tests were conducted, experts and users were consulted, and quality and cost<br />
issues were weighed. With the survey solidly in place, evaluation <strong>of</strong> current<br />
methodology with an eye to quality improvement is under way at BLS. The<br />
ATUS presents numerous opportunities for further assessment <strong>of</strong> data quality,<br />
including additional research on respondent cognitive processes, respondent–<br />
interviewer interaction, coding reliability, measurement <strong>of</strong> secondary activities,<br />
sample design and nonresponse, respondent burden, and nonresponse bias.<br />
Notes<br />
<strong>Twenty</strong>-<strong>Four</strong> <strong>Hours</strong>—125<br />
1. Available at http://www.bls.gov/tus.<br />
2. The bill was not enacted. National economic accounts have not included nonmarket<br />
production (e.g., domestic activity, child care, shopping, and education), a component<br />
<strong>of</strong> total productive activity. A major conference was held in 1994 on the<br />
Measurement and Valuation <strong>of</strong> Unpaid Work (see <strong>Statistics</strong> Canada, 1994). In addition,<br />
the 1995 Beijing Women’s Conference called for the collection <strong>of</strong> time use data to measure<br />
nonmarket production (Harvey & Pentland, 1999).<br />
3. For many examples <strong>of</strong> how time use data are used, see presentations and<br />
posters from the ATUS Early Use Conference at the University <strong>of</strong> Maryland,<br />
http://www.atususers.umd.edu/papers/atusconference/index.shtml.
126—VARIATIONS IN COLLECTION AND APPLICATION OF DATA<br />
4. Based on American Association for Public Opinion Research Response Rate 2<br />
calculations (AAPOR, 2006).<br />
5. This includes the time to complete the ATUS as well as a temporary module<br />
on secondary eating and drinking added to the survey in 2005; the module adds an<br />
average <strong>of</strong> 5 minutes.<br />
6. Conversationally flexible interviewing techniques allow interviewers to engage<br />
in more ordinary conversation during the interview and deviate from the structured<br />
script to assure respondent understanding <strong>of</strong> questions (Schober & Conrad, 1997). See<br />
section on Computer Assisted Telephone Interviewing for detail on specific techniques.<br />
7. There are 22 “Who” categories (e.g., alone, spouse, household child, friends).<br />
There are 26 “Where” categories that are associated with either a place (e.g., home,<br />
workplace) or mode <strong>of</strong> transportation (e.g., bus). See the ATUS User’s Guide (<strong>Bureau</strong><br />
<strong>of</strong> <strong>Labor</strong> <strong>Statistics</strong>, 2006) for further detail.<br />
8. The types <strong>of</strong> activities were tested using the first tier or aggregate level coding<br />
scheme. In addition, there was no difference between the conditions in the rounding <strong>of</strong><br />
time periods.<br />
9. This wording slightly varies if there are children under 12 living in the household,<br />
but the “in your care” concept is the same.<br />
10. The population includes persons aged 15 and up. A small percentage <strong>of</strong> secondary<br />
child care time is imputed.<br />
11. The expected response rate for the ATUS was approximately 70% (Horrigan<br />
& Herz, 2004).<br />
12. O’Neill and Dixon calculate nonresponse outcomes using data that have<br />
undergone final editing and processing. During the processing, completed cases with<br />
poor quality data are moved into the nonresponse category, lowering final annual average<br />
response rates by 1% to 3%.<br />
13. BLS considers CPS households that have moved as ineligible for the ATUS,<br />
and thus, are not considered nonrespondents. Abraham, Maitland, and Bianchi (2005)<br />
suggest that these households should be considered as “non-contacts.”<br />
14. See Stewart (2002) for an assessment <strong>of</strong> contact strategies, including designated<br />
and convenient day contacts and field periods, potential activity bias, and recommendations<br />
for the ATUS procedures.<br />
15. The ATUS sample is split between weekdays and weekends. Approximately<br />
50% <strong>of</strong> the sample is selected to report for a specific weekday (10% for each day), and<br />
50% for a weekend day (25% each on Saturday and Sunday).<br />
16. A field experiment tested whether substitution <strong>of</strong> days increased response<br />
rates (Piskurich, Nelson, & Herz, 2001). The findings indicated that response rates are<br />
equivalent after eight attempts whether or not substitution was used. Since substitution<br />
tended to increase reporting for Wednesdays, and reduce reporting on Fridays, ATUS<br />
adopted the eight attempts rather than a substitution procedure.<br />
References<br />
Abraham, K., Maitland, A., & Bianchi, S. (2005). Nonresponse in the American Time Use<br />
Survey: Who is missing from the data and how much does it matter? University <strong>of</strong><br />
Maryland, ATUS Early Results Conference. Retrieved from http://www.atususers<br />
.umd.edu/papers/atusconference/index.shtml
<strong>Twenty</strong>-<strong>Four</strong> <strong>Hours</strong>—127<br />
Allard, M. D., Bianchi, S., Stewart, J., & Wight, V. (2006). Measuring time spent in childcare:<br />
Can the American Time Use Survey be compared to earlier U.S. time-use urveys?<br />
Washington, DC: <strong>Bureau</strong> <strong>of</strong> <strong>Labor</strong> <strong>Statistics</strong>.<br />
American Association for Public Opinion Research. (2006). Standard definitions—Final<br />
dispositions <strong>of</strong> case codes and outcome rates for surveys. Retrieved from http://www<br />
.aapor.org/pdfs/standarddefs_4.pdf<br />
Bianchi, S., Wight, V., & Raley, S. (2005). Maternal employment and family caregiving:<br />
Rethinking time with children in the ATUS. Retrieved May 21, 2008, from<br />
University <strong>of</strong> Maryland, ATUS Early Results Conference Web site: http://www<br />
.atususers.umd.edu/papers/atusconference/index.shtml<br />
Bose, J., & Sharp, J. (2005). Measurement <strong>of</strong> travel behavior in a trip-based survey versus<br />
a time use survey. Retrieved May 21, 2008, from University <strong>of</strong> Maryland, ATUS<br />
Early Results Conference Web site: http://www.atususers.umd.edu/papers/<br />
atusconference/index.shtml<br />
<strong>Bureau</strong> <strong>of</strong> <strong>Labor</strong> <strong>Statistics</strong>. (2006). American Time Use Survey user’s guide. Retrieved<br />
from http://www.bls.gov/tus/atususersguide.pdf<br />
Dixon, J., & Tucker, C. (2000, May). Modeling household and interviewer nonresponse<br />
rates from household and regional characteristics. Paper presented at the Annual<br />
Meeting <strong>of</strong> the American Association for Public Opinion Research, Portland, OR.<br />
Fisher, K. (2005, November). Examining the dynamics <strong>of</strong> childcare using the American<br />
Time-Use Survey and USA heritage time use data sets. Paper presented at the 2005<br />
International Association for Time Use Research Conference, Halifax, Canada.<br />
Forsythe, B. (1997a, November). Assessing data quality: How well did our approach work?<br />
Paper presented at the Conference on Time Use, Non-Market Work and Family<br />
Well-Being. Washington, DC: <strong>Bureau</strong> <strong>of</strong> <strong>Labor</strong> <strong>Statistics</strong> and MacArthur Network<br />
on the Family and the Economy.<br />
Forsythe, B. (1997b). Cognitive laboratory research plan for collecting time use data.<br />
Washington, DC: <strong>Bureau</strong> <strong>of</strong> <strong>Labor</strong> <strong>Statistics</strong>, Office <strong>of</strong> Survey Methods Research.<br />
Frazis, H., & Stewart, J. (2004). What can time-use data tell us about hours <strong>of</strong> work?<br />
Monthly <strong>Labor</strong> Review, 127, 3–9.<br />
Frazis, H., & Stewart, J. (2007). Where does time go? Concepts and measurement in the<br />
American Time Use Survey. In E. R. Berndt & C. R. Hulten (Eds.), Hard-to-measure<br />
goods and services: Essays in honor <strong>of</strong> Zvi Griliches (National <strong>Bureau</strong> <strong>of</strong> Economic<br />
Research Studies in Income and Wealth,Vol. 67). Chicago: University <strong>of</strong> Chicago Press.<br />
Hamermesh, D. S., Frazis, H., & Stewart, J. (2005). Data watch: The American Time Use<br />
Survey. Journal <strong>of</strong> Economic Perspectives, 19, 221–232.<br />
Harvey, A. S. (2003). Guidelines for Time Use Data Collection. Social Indicators Research,<br />
30, 197–228.<br />
Harvey, A. S., & Pentland, W. E. (1999). Time use research. In W. E. Pentland, A. S. Harvey,<br />
M. P. Lawton, & M. A. McColl (Eds.), Time use research in the social sciences<br />
(pp. 3–14). New York: Kluwer Academic/Plenum.<br />
Horrigan, M., & Herz, D. (2004). Planning, designing, and executing the BLS American<br />
Time-Use Survey. Monthly <strong>Labor</strong> Review, 127, 3–19.<br />
Joyce, M., & Stewart, J. (1999). What can we learn from time use data? Monthly <strong>Labor</strong><br />
Review, 122, 3–6.<br />
Juster, F. T. (1986). Response errors in the measurement <strong>of</strong> time use. Journal <strong>of</strong> the<br />
American Statistical Association, 81, 390–402.<br />
Juster, F. T., & Stafford, F. P. (Eds.). (1985). Time, goods, and well-being. Ann Arbor:<br />
University <strong>of</strong> Michigan, Institute for Social Research.
128—VARIATIONS IN COLLECTION AND APPLICATION OF DATA<br />
Levin, K. (1997, November). Administrative details and costs: An assessment <strong>of</strong> feasibility.<br />
Paper presented at the Conference on Time Use, Non-market Work and Family<br />
Well-Being. Washington, DC: <strong>Bureau</strong> <strong>of</strong> <strong>Labor</strong> <strong>Statistics</strong> and MacArthur Network<br />
on the Family and the Economy.<br />
McGrath, D. E. (2005). Comparison <strong>of</strong> data obtained by telephone versus personal visit<br />
response in the U.S. Consumer Expenditures Survey. 2005 Proceedings <strong>of</strong> the<br />
American Statistical Association, Survey Research Methods Section. Alexandria,<br />
VA: American Statistical Association.<br />
National Academy <strong>of</strong> Sciences. (2000). Time-use measurement and research: Report <strong>of</strong> a<br />
workshop. Washington, DC: National Academy Press.<br />
National Opinion Research Center. (2002). Pretesting <strong>of</strong> the Advance Diary for the<br />
American Time Use Survey. Washington, DC: <strong>Bureau</strong> <strong>of</strong> <strong>Labor</strong> <strong>Statistics</strong>, Office <strong>of</strong><br />
Employment and Unemployment <strong>Statistics</strong>.<br />
O’Neill, G., & Sincavage, J. (2004). Response Analysis Survey: A qualitative look at response<br />
and nonresponse in the American Time Use Survey. http://www.bls.gov/tus/home.htm<br />
O’Neill, G., & Dixon, J. (2005). Nonresponse bias in the American Time Use Survey.<br />
Proceedings <strong>of</strong> the American Statistical Association, Survey Research Methods<br />
Section. Alexandria, VA: American Statistical Association.<br />
Piskurich, K., Nelson, D. V., & Herz, D. E. (2001 May). Maximizing respondent contact in<br />
the American Time Use Survey. Paper presented at the Annual Meeting <strong>of</strong> the<br />
American Association for Public Opinion Research, Montreal, Canada.<br />
Robinson, J. P. (1985). The validity and reliability <strong>of</strong> diaries versus alternative time use<br />
measures. In F. T. Juster & F. P. Stafford (Eds.), Time, goods, and wellbeing (pp. 33–62).<br />
Ann Arbor: University <strong>of</strong> Michigan, Institute for Social Research.<br />
Robinson, J. P. (1999). The time-diary method: Structures and uses. In W. E. Pentland,<br />
A. S. Harvey, M. P. Lawton, & M. A. McColl (Eds.), Time use research in the social<br />
sciences (pp. 47–87). New York: Kluwer Academic/Plenum.<br />
Schober, M. F., & Conrad, F. G. (1997). Does conversational interviewing reduce survey<br />
measurement error? Public Opinion Quarterly, 61, 576–602.<br />
Schwartz, L. K. (2001). Minding the children: Understanding how recall and conceptual<br />
interpretations influence responses to a time-use summary question. Retrieved from<br />
http://www.bls.gov/tus/home.htm<br />
Schwartz, L. K. (2002). The American Time Use Survey: Cognitive pretesting. Monthly<br />
<strong>Labor</strong> Review, 125, 34–44.<br />
Shelley, K. (2005). Developing the American Time Use Survey activity classification<br />
system. Monthly <strong>Labor</strong> Review, 128, 3–15.<br />
Stafford, F., & Yeung, J. (2005). The distribution <strong>of</strong> children’s developmental resources.<br />
In D. S. Hamermesh & G. A. Pfann (Eds.), The economics <strong>of</strong> time use (pp. 289–313).<br />
Amsterdam: Elsevier.<br />
<strong>Statistics</strong> Canada. (1994). International Conference on the Measurement and Valuation <strong>of</strong><br />
Unpaid Work: Proceedings. Ottawa, Ontario, Canada: Author.<br />
Stewart, J. (2002). Assessing the bias associated with alternative contact strategies in<br />
telephone time-use surveys. Survey Methodology, 28, 157–168.<br />
Stinson, L. (1999). Measuring how people spend their time: A time-use survey design.<br />
Monthly <strong>Labor</strong> Review, 122, 12–19.<br />
Willis, G. (2004). Cognitive interviewing: A tool for improving questionnaire design.<br />
Thousand Oaks, CA: Sage.