The decline of employer stock as a 401(k) investment vehicle
The decline of employer stock as a 401(k) investment vehicle
The decline of employer stock as a 401(k) investment vehicle

Create successful ePaper yourself
Turn your PDF publications into a flip-book with our unique Google optimized e-Paper software.
U.S. Department <strong>of</strong> Labor U.S. Bureau <strong>of</strong> Labor Statistics<br />
<strong>The</strong> <strong>decline</strong><br />
<strong>of</strong> <strong>employer</strong><br />
<strong>stock</strong> <strong>as</strong> a <strong>401</strong>(k)<br />
<strong>investment</strong> <strong>vehicle</strong>
MONTHLY LABOR<br />
REVIEW<br />
Volume 131, Number 11<br />
November 2008<br />
<strong>401</strong>(k) plans move away from <strong>employer</strong> <strong>stock</strong> <strong>as</strong> <strong>investment</strong> <strong>vehicle</strong> 3<br />
Incre<strong>as</strong>ingly, employees are given the option to choose how their <strong>401</strong>(k) plan funds are invested;<br />
this greater choice is one factor in the decre<strong>as</strong>ed exposure to <strong>investment</strong> in <strong>employer</strong> <strong>stock</strong><br />
William J. Wiatrowski<br />
Occupational employment in the not-for-pr<strong>of</strong>it sector 11<br />
<strong>The</strong> for-pr<strong>of</strong>it and not-for-pr<strong>of</strong>it sectors differ in regards to the industries<br />
with the most employees and the types <strong>of</strong> jobs that employees most commonly hold<br />
Zack Warren<br />
<strong>The</strong> employment rate <strong>of</strong> people with disabilities 44<br />
Three critical issues <strong>as</strong>sess the success <strong>of</strong> employment policies for the disabled,but there is no clear<br />
consensus regarding the outcome <strong>of</strong> these issues; more comprehensive survey coverage is needed<br />
Burt S. Barnow<br />
How high school students use time: a visual essay 51<br />
Mary Dorinda Allard<br />
Departments<br />
Labor month in review 2<br />
Current labor statistics 63<br />
Editor-in-Chief: Michael D. Levi � Executive Editor: William Parks II � Managing Editor: Leslie Brown Joyner ��Editors: Brian<br />
I. Baker, C<strong>as</strong>ey P. Homan � Book Review Editor: James Titkemeyer � Design and Layout: Catherine D. Bowman, Edith W. Peters ��<br />
Contributing Editor: Lawrence H. Leith
Labor Month In Review<br />
<strong>The</strong> November Review<br />
Given ongoing events in the securities<br />
markets, workers and their families<br />
are perhaps more focused on<br />
their retirement plans and retirement<br />
<strong>investment</strong>s than ever before. Th e<br />
lead article in this month’s Review<br />
examines an important <strong>as</strong>pect in the<br />
history <strong>of</strong> <strong>401</strong>(k) plans, namely, the<br />
changing availability over time <strong>of</strong> the<br />
opportunity to invest in the <strong>stock</strong> <strong>of</strong><br />
one’s own <strong>employer</strong>. William J. Wiatrowski<br />
fi rst provides a brief overview<br />
<strong>of</strong> these defi ned contribution retirement<br />
plans, and then elucidates the<br />
shift over the 20 years from 1985 to<br />
2005 <strong>of</strong> the use <strong>of</strong> <strong>stock</strong> <strong>as</strong> an <strong>investment</strong><br />
<strong>vehicle</strong>. Given the prominence<br />
and ubiquity <strong>of</strong> <strong>401</strong>(k) plans in today’s<br />
world, the changes discussed in<br />
this article are particularly timely.<br />
Zack Warren compares occupational<br />
employment and wages in the<br />
not-for-pr<strong>of</strong>i t and for-pr<strong>of</strong>i t sectors<br />
using data from the Occupational<br />
Employment Statistics (OES) program.<br />
As he notes, the number <strong>of</strong><br />
not-for-pr<strong>of</strong>i t institutions h<strong>as</strong> incre<strong>as</strong>ed<br />
rapidly in recent years, and<br />
the employment generated by such<br />
places h<strong>as</strong> grown concurrently. Using<br />
the great volume <strong>of</strong> detailed industry<br />
and occupational employment information<br />
available from this program,<br />
he fi nds that occupational diff erences<br />
between for-pr<strong>of</strong>i t and not-for-pr<strong>of</strong>i t<br />
organizations can vary greatly from<br />
industry to industry.<br />
Th e employment status <strong>of</strong> people<br />
with disabilities h<strong>as</strong> been a topic <strong>of</strong><br />
considerable attention and research<br />
in recent years, in both the public<br />
and private sectors. Burt S. Barnow<br />
identifi es issues he feels are especially<br />
critical in regard to me<strong>as</strong>uring not<br />
2 Monthly Labor Review • November 2008<br />
only employment status, but also the<br />
very nature <strong>of</strong> disability status itself.<br />
He also examines the impact <strong>of</strong> the<br />
Americans with Disabilities Act on<br />
the employment trends <strong>of</strong> disabled<br />
persons. He makes it clear that from<br />
his perspective socioeconomic surveys<br />
have to cover these issues more<br />
comprehensively if a fuller understanding<br />
<strong>of</strong> this sensitive subject is to<br />
be attained.<br />
Finally for the November issue,<br />
Mary Dorinda Allard provides a look<br />
at how that most rambunctious <strong>of</strong><br />
groups—high school students—allocate<br />
their time engaging in homework,<br />
household activities, and other<br />
<strong>as</strong>pects <strong>of</strong> their lives.<br />
Labor force characteristics<br />
by race and ethnicity<br />
As data have indicated for a long time,<br />
there are diff erences in employment<br />
and unemployment patterns for labor<br />
market participants relating to race<br />
and ethnicity. Adult men <strong>of</strong> Hispanic<br />
ethnicity, for instance, have a higher<br />
share <strong>of</strong> their population employed<br />
than do their white, black, and Asian<br />
counterparts. Among adult women, a<br />
lower share <strong>of</strong> Hispanics is employed<br />
than their counterparts from the race<br />
groups.<br />
In terms <strong>of</strong> education attained—always<br />
a critical factor infl uencing labor<br />
market outcomes—about the same<br />
share (around 90 percent) <strong>of</strong> white,<br />
black, and Asian workers 25 years <strong>of</strong><br />
age and older h<strong>as</strong> received at le<strong>as</strong>t a<br />
high school diploma. By contr<strong>as</strong>t,<br />
a signifi cantly smaller share (about<br />
66 percent) <strong>of</strong> Hispanic workers h<strong>as</strong><br />
completed high school.<br />
A full range <strong>of</strong> comparative information<br />
like that noted here can be<br />
found in a new report from BLS called<br />
Labor Force Characteristics by Race and<br />
Ethnicity, 2007. Th e report contains<br />
analysis and detailed tables presenting<br />
an array <strong>of</strong> labor market me<strong>as</strong>ures<br />
tabulated from this particular demographic<br />
focus. Th e online edition <strong>of</strong><br />
this report can be found at http://<br />
www.bls.gov/cps/cpsrace2007.pdf<br />
Program Perspectives<br />
BLS recently launched a new publication<br />
called Program Perspectives. It<br />
is designed to be a showc<strong>as</strong>e for the<br />
Bureau’s various programs to highlight<br />
recent trends and developments<br />
in their data. Th e format is designed<br />
to be concise and visually fresh. Th is<br />
online publication likely will be posted<br />
a number <strong>of</strong> times per year.<br />
Th e inaugural issue focuses on<br />
health benefi ts data from the National<br />
Compensation Survey. Topics<br />
covered include trends in <strong>employer</strong><br />
costs for health benefi ts, access rates<br />
to health care benefi ts for employees,<br />
and participation rates for workers in<br />
their <strong>employer</strong>s’ health plans. Th e fi rst<br />
issue can be found online at http://<br />
www.bls.gov/opub/perspectives/<br />
Communications regarding<br />
the Monthly Labor Review<br />
may be sent to:<br />
Editor-in-Chief<br />
U.S. Bureau <strong>of</strong> Labor Statistics<br />
W<strong>as</strong>hington, DC 20212<br />
E-mail: mlr@bls.gov<br />
Telephone: (202) 691-5900
<strong>401</strong>(k) plans<br />
William J. Wiatrowski<br />
William J. Wiatrowski<br />
is an economist<br />
in the Office <strong>of</strong><br />
Compensation and<br />
Working Conditions,<br />
Bureau <strong>of</strong> Labor<br />
Statistics. E-mail:<br />
Wiatrowski.william@<br />
bls.gov.<br />
<strong>401</strong>(k) plans move away from <strong>employer</strong><br />
<strong>stock</strong> <strong>as</strong> <strong>investment</strong> <strong>vehicle</strong><br />
Incre<strong>as</strong>ingly, employees are given the option to choose how their <strong>401</strong>(k)<br />
plan funds are invested; this greater choice is one factor in the decre<strong>as</strong>ed<br />
exposure to <strong>investment</strong> in <strong>employer</strong> <strong>stock</strong><br />
<strong>The</strong> Pension Protection Act <strong>of</strong> 2006<br />
seeks to encourage expanded participation<br />
in <strong>401</strong>(k) plans by allowing<br />
new employees to be automatically<br />
enrolled in such plans, and, in the absence<br />
<strong>of</strong> an employee decision, clarifying the rules<br />
for <strong>investment</strong> <strong>of</strong> plan <strong>as</strong>sets. Regulations<br />
to implement this law, finalized by the U.S.<br />
Department <strong>of</strong> Labor in October 2007,<br />
specify that a “participant in a participant<br />
directed individual account pension plan<br />
will be deemed to have exercised control<br />
over <strong>as</strong>sets in his or her account if, in the<br />
absence <strong>of</strong> <strong>investment</strong> directions from the<br />
participant, the plan invests in a qualified<br />
default <strong>investment</strong> alternative,” which<br />
establishes a general prohibition against<br />
holding or permitting acquisition <strong>of</strong> <strong>employer</strong><br />
securities. 1 This effort to ensure that<br />
employee accounts are invested in a diversified<br />
portfolio is a change from the earlier<br />
history <strong>of</strong> <strong>401</strong>(k) plans, when <strong>investment</strong><br />
in <strong>employer</strong> <strong>stock</strong> w<strong>as</strong> prevalent. As plans<br />
begin to adapt to these new regulations, a<br />
look at the trend in <strong>401</strong>(k) <strong>investment</strong> options<br />
over the p<strong>as</strong>t two decades shows a<br />
steady move away from <strong>employer</strong> <strong>stock</strong> <strong>as</strong><br />
an <strong>investment</strong> <strong>vehicle</strong>. Should plans choose<br />
to expand the use <strong>of</strong> automatic enrollment<br />
features <strong>as</strong> a means <strong>of</strong> further encouraging<br />
participation, the regulations requiring the<br />
use <strong>of</strong> qualified <strong>investment</strong>s might result in<br />
further movement away from <strong>investment</strong> in<br />
<strong>employer</strong> <strong>stock</strong>.<br />
<strong>401</strong>(k) plans, in brief<br />
Internal Revenue Code section <strong>401</strong>(k)<br />
w<strong>as</strong> introduced <strong>as</strong> part <strong>of</strong> the Revenue Act<br />
<strong>of</strong> 1978. 2 Commonly known <strong>as</strong> “<strong>401</strong>(k)<br />
plans,” these kinds <strong>of</strong> plans first came into<br />
prominence in the early 1980s. Section <strong>401</strong>(k)<br />
defines a feature <strong>of</strong> a defined contribution<br />
plan that allows employees to choose to<br />
defer some income (and, consequently,<br />
defer current taxation <strong>of</strong> that income) into<br />
a retirement account. In general, defined<br />
contribution plans are individual accounts<br />
that accumulate <strong>employer</strong> and employee<br />
contributions, plus earnings, the result<br />
<strong>of</strong> which is available to the employee at<br />
retirement. <strong>The</strong> most prevalent <strong>401</strong>(k) plan is<br />
known <strong>as</strong> a savings and thrift plan (or some<br />
variant such <strong>as</strong> a thrift-savings plan), which<br />
gives the employee the option to invest some<br />
percent <strong>of</strong> earnings that is then matched by<br />
<strong>employer</strong> funds. For example, a plan might<br />
allow the employee to contribute from 1-<br />
10 percent <strong>of</strong> their earnings, tax deferred,<br />
with the <strong>employer</strong> matching 50 percent <strong>of</strong><br />
the first 6 percent <strong>of</strong> earnings contributed.<br />
If the employee chose to contribute 10<br />
percent, the <strong>employer</strong> would add 3 percent<br />
(50 percent <strong>of</strong> the first 6 percent). <strong>The</strong><br />
total <strong>of</strong> 13 percent <strong>of</strong> earnings would then<br />
be invested in the employee’s account. 3<br />
<strong>The</strong>re are other types <strong>of</strong> defined contribution<br />
plans and other ways that section<br />
<strong>401</strong>(k) is used to allow pretax contributions.<br />
Monthly Labor Review • November 2008 3
<strong>401</strong>(k) plans<br />
In all c<strong>as</strong>es, the total employee and <strong>employer</strong> contributions<br />
are invested, with the employee bearing the risk <strong>of</strong> <strong>investment</strong><br />
gains and losses. <strong>The</strong> <strong>investment</strong> choices for <strong>401</strong>(k)<br />
plans have changed considerably over the p<strong>as</strong>t 20 years,<br />
reflecting changes in law and regulation, the expanded use<br />
<strong>of</strong> <strong>401</strong>(k) plans <strong>as</strong> the primary <strong>vehicle</strong> for providing retirement<br />
income, and heightened concern that employees<br />
should be properly educated about <strong>investment</strong> choices. 4<br />
<strong>401</strong>(k) <strong>investment</strong> options<br />
<strong>The</strong> Bureau <strong>of</strong> Labor Statistics (BLS) tracks the percent <strong>of</strong><br />
workers who participate in various types <strong>of</strong> employee benefits,<br />
<strong>as</strong> well <strong>as</strong> the details <strong>of</strong> those benefits. Following the<br />
introduction <strong>of</strong> <strong>401</strong>(k) plans, BLS expanded its benefits<br />
survey in the mid-1980s to incorporate defined contribution<br />
plans. Since then, BLS data have tracked the incre<strong>as</strong>ed<br />
participation in defined contribution plans and the decre<strong>as</strong>ed<br />
participation in defined benefit plans. By capturing<br />
the provisions <strong>of</strong> <strong>401</strong>(k) plans, BLS h<strong>as</strong> also tracked<br />
the movement toward allowing employees to choose their<br />
own <strong>investment</strong>s and the <strong>decline</strong> in the use <strong>of</strong> <strong>employer</strong><br />
<strong>stock</strong> <strong>as</strong> an <strong>investment</strong> <strong>vehicle</strong>. 5<br />
<strong>The</strong> typical plan consists <strong>of</strong> employee contributions and<br />
<strong>employer</strong> matching contributions, each <strong>of</strong> which can be<br />
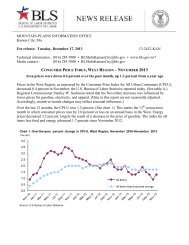
Chart 1. Percent <strong>of</strong> <strong>401</strong>(k) plans participants allowed to choose plan <strong>investment</strong>s, 1985–2005<br />
Percent <strong>of</strong> participants<br />
100<br />
80<br />
60<br />
40<br />
20<br />
0<br />
4 Monthly Labor Review • November 2008<br />
invested in a variety <strong>of</strong> <strong>vehicle</strong>s. A plan may give participants<br />
the choice <strong>of</strong> <strong>investment</strong> options for the employee<br />
contributions, the <strong>employer</strong> matching contributions, or<br />
both, or the plan may specify the <strong>investment</strong>s without<br />
providing a choice to the employee. Early <strong>401</strong>(k) plans<br />
<strong>of</strong>ten allowed participants to choose how to invest their<br />
own funds, but the plan designated how <strong>employer</strong> matching<br />
funds were invested. For example, among plan participants<br />
in 1985, 90 percent could elect how their own<br />
contributions were invested while only 48 percent could<br />
elect how <strong>employer</strong> funds were to be invested. Two decades<br />
later, while the same percent could elect how their<br />
own contributions were invested, those who could elect<br />
how <strong>employer</strong> funds were invested had risen gradually to<br />
76 percent <strong>of</strong> participants. Chart 1 shows the percentage<br />
<strong>of</strong> participants who could choose their own <strong>investment</strong>s<br />
over time. 6 (Note that the intervals between data in the<br />
chart vary b<strong>as</strong>ed on the availability <strong>of</strong> data.)<br />
New tabulations from the most recent BLS data indicate<br />
that most plans treat the <strong>investment</strong> <strong>of</strong> employee<br />
and <strong>employer</strong> funds the same way. <strong>The</strong>se 2005 data show<br />
that, in the minority <strong>of</strong> c<strong>as</strong>es where <strong>investment</strong> provisions<br />
differed, typically employees could choose how to<br />
invest their own funds, but they had no choice in the <strong>investment</strong><br />
<strong>of</strong> <strong>employer</strong> matching funds. 7 This could be due<br />
Employee contributions Employer contributions<br />
1985 1989 1993 1997 2000 2003 2005<br />
Percent <strong>of</strong> participants<br />
100<br />
80<br />
60<br />
40<br />
20<br />
0
in part to regulations restricting plan <strong>investment</strong>s when<br />
no employee choice is <strong>of</strong>fered. 8<br />
Using <strong>stock</strong> <strong>as</strong> an <strong>investment</strong> <strong>vehicle</strong><br />
Although plans are allowing participants to make their own<br />
<strong>investment</strong> choices more frequently than in the p<strong>as</strong>t, the<br />
use <strong>of</strong> <strong>employer</strong> <strong>stock</strong> <strong>as</strong> one <strong>of</strong> those choices h<strong>as</strong> become<br />
less prevalent. <strong>The</strong> widespread prevalence <strong>of</strong> <strong>investment</strong> in<br />
<strong>employer</strong> <strong>stock</strong> in the 1980s may be related to how <strong>401</strong>(k)<br />
plans were first introduced—<strong>as</strong> supplements to existing<br />
defined benefit plans. Because these plans were not considered<br />
the employee’s primary source <strong>of</strong> retirement income,<br />
<strong>employer</strong>s had the opportunity to use the plans to serve<br />
other purposes, such <strong>as</strong> building loyalty through employee<br />
ownership. At roughly the same time, labor-management<br />
agreements were introducing more cooperative provisions<br />
intent on building employee loyalty, ranging from statements<br />
<strong>of</strong> cooperation and joint efforts to address safety<br />
issues up to union-management participation in strategic<br />
decision making. 9<br />
<strong>The</strong>re are drawbacks to <strong>investment</strong>s in company <strong>stock</strong>,<br />
however, such <strong>as</strong> lack <strong>of</strong> <strong>investment</strong> diversity and the<br />
potential for financial improprieties, both <strong>of</strong> which can<br />
affect the value <strong>of</strong> an employee’s account. Consider the<br />
following examples:<br />
• In 1996, the Color Tile Company filed for bankruptcy.<br />
<strong>The</strong> company’s <strong>401</strong>(k) plan w<strong>as</strong> invested largely<br />
in <strong>employer</strong> <strong>stock</strong>, which lost much <strong>of</strong> its value.<br />
Because the risk <strong>of</strong> <strong>investment</strong> gains and losses is<br />
borne by the plan participant, individual employees<br />
lost much <strong>of</strong> their retirement savings.<br />
• <strong>The</strong> highly publicized c<strong>as</strong>e <strong>of</strong> financial mismanagement<br />
at Enron Corporation also had implications<br />
for the company’s <strong>401</strong>(k) plan. <strong>The</strong> plan, which w<strong>as</strong><br />
invested largely in <strong>employer</strong> <strong>stock</strong>, <strong>decline</strong>d significantly<br />
in value. <strong>The</strong> plan allowed participants to<br />
choose among several <strong>investment</strong> options for their<br />
own contributions, but required that all company<br />
matching contributions be invested in <strong>employer</strong><br />
<strong>stock</strong>. <strong>The</strong> company did have a provision that allowed<br />
employees to switch <strong>investment</strong> <strong>vehicle</strong>s,<br />
but company matching contributions could not be<br />
switched out <strong>of</strong> <strong>employer</strong> <strong>stock</strong> until an employee<br />
reached age 50.<br />
• More recently, employees at Countrywide Finance<br />
and Bears-Stern saw their plan balances drop with<br />
the price <strong>of</strong> their <strong>employer</strong>’s <strong>stock</strong>. In the c<strong>as</strong>e <strong>of</strong><br />
Countrywide, employees filed suit against their <strong>employer</strong><br />
because company financial problems related<br />
to the loan business led to a <strong>decline</strong> in the value <strong>of</strong><br />
their <strong>401</strong>(k) plan. 10<br />
Issues such <strong>as</strong> these, occurring at a time when <strong>401</strong>(k)<br />
plans were incre<strong>as</strong>ingly becoming the primary <strong>employer</strong>sponsored<br />
retirement <strong>vehicle</strong> for many employees, resulted<br />
in incre<strong>as</strong>ed scrutiny <strong>of</strong> <strong>401</strong>(k) <strong>investment</strong>s and a number<br />
<strong>of</strong> changes in the regulatory environment surrounding<br />
<strong>401</strong>(k) plans. One result w<strong>as</strong> the introduction <strong>of</strong> rules regarding<br />
<strong>investment</strong> education and diversity by the U.S.<br />
Department <strong>of</strong> Labor. 11<br />
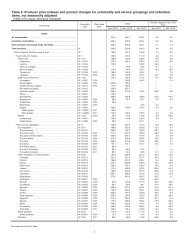
BLS data provide some indication <strong>of</strong> the use <strong>of</strong> <strong>employer</strong><br />
<strong>stock</strong> <strong>as</strong> a <strong>401</strong>(k) <strong>investment</strong> <strong>vehicle</strong>. <strong>The</strong>y indicate that<br />
workers’ exposure to own-<strong>employer</strong> <strong>stock</strong> h<strong>as</strong> <strong>decline</strong>d<br />
substantially since 1985. Among funds contributed by<br />
<strong>employer</strong>s, a significant fraction <strong>of</strong> this <strong>decline</strong> w<strong>as</strong> likely<br />
caused by the incre<strong>as</strong>ed control <strong>of</strong> the funds given to workers,<br />
<strong>as</strong> documented in chart 1. Since <strong>employer</strong> <strong>stock</strong> w<strong>as</strong><br />
more prevalent among <strong>employer</strong>-provided funds with no<br />
<strong>investment</strong> choice than among <strong>employer</strong>-provided funds<br />
in which employees chose <strong>investment</strong> allocation—NCS<br />
data from 1993 indicate that these fractions were 64 percent<br />
and 38 percent, respectively—the incre<strong>as</strong>ing fraction<br />
<strong>of</strong> funds having employee choice caused <strong>employer</strong> <strong>stock</strong><br />
exposure to <strong>decline</strong>. Less change is observed among employee-provided<br />
funds, where <strong>investment</strong> choice w<strong>as</strong> and<br />
continues to be widespread.<br />
Another source <strong>of</strong> <strong>decline</strong> in workers’ exposure to<br />
own-<strong>employer</strong> <strong>stock</strong> w<strong>as</strong> that, within those plans allowing<br />
choice, there w<strong>as</strong> a marked <strong>decline</strong> in the fraction<br />
allowing <strong>employer</strong> <strong>stock</strong> <strong>as</strong> a possibility. This trend applied<br />
to both <strong>employer</strong>- and employee-provided funds.<br />
Among employee-provided funds, the proportion <strong>of</strong><br />
workers that had the choice to invest in <strong>employer</strong> <strong>stock</strong><br />
w<strong>as</strong> 70 percent in 1985, but that figure had <strong>decline</strong>d to<br />
25 percent by 2005. Among <strong>employer</strong>-provided funds,<br />
the percent <strong>of</strong> those who could choose <strong>employer</strong> <strong>stock</strong><br />
<strong>as</strong> an <strong>investment</strong> <strong>decline</strong>d sharply from 1985 to 1997<br />
(61 percent to 25 percent), and then continued to drop<br />
after that, reaching 19 percent in 2005. 12 (See chart 2.)<br />
Tabulations from the 2005 BLS benefits survey give<br />
details on whether those able to choose their <strong>investment</strong>s<br />
have the same choices for employee and <strong>employer</strong> contributions.<br />
In nearly every plan, the availability <strong>of</strong> <strong>employer</strong><br />
<strong>stock</strong> <strong>as</strong> an <strong>investment</strong> choice w<strong>as</strong> treated the same for<br />
employee and <strong>employer</strong> contributions—either all contributions<br />
could be invested in <strong>employer</strong> <strong>stock</strong> or no contributions<br />
could be invested in <strong>employer</strong> <strong>stock</strong>.<br />
Monthly Labor Review • November 2008 5
<strong>401</strong>(k) plans<br />
Chart 2. Percent <strong>of</strong> <strong>401</strong>(k) plan participants with <strong>employer</strong> <strong>stock</strong> included among <strong>investment</strong> choices, 1985–2005<br />
Percent <strong>of</strong> participants Percent <strong>of</strong> participants<br />
80<br />
60<br />
40<br />
20<br />
0<br />
Calculating potential <strong>stock</strong> exposure<br />
<strong>The</strong>se data alone do not provide a complete look at the<br />
potential exposure <strong>of</strong> own-<strong>employer</strong> <strong>stock</strong> in <strong>401</strong>(k) <strong>investment</strong>s.<br />
In this article, potential exposure is defined <strong>as</strong><br />
the percent <strong>of</strong> participants that could have their account<br />
invested in <strong>employer</strong> <strong>stock</strong>, either automatically (in plans<br />
that do not give employees the ability to make <strong>investment</strong><br />
decisions) or at the participant’s choosing. 13 Such a figure<br />
cannot be calculated in most years because data are not<br />
available on the proportion <strong>of</strong> plans invested in <strong>employer</strong><br />
<strong>stock</strong> where no <strong>investment</strong> choice is given. Nonetheless,<br />
available data can be used to estimate the lower and upper<br />
bounds <strong>of</strong> possible <strong>employer</strong> <strong>stock</strong> exposure by <strong>as</strong>suming<br />
that none or all <strong>of</strong> these funds, respectively, are exposed to<br />
<strong>employer</strong> <strong>stock</strong>. Additionally, some <strong>as</strong>sumptions and a little<br />
algebra can be used to provide an estimate <strong>of</strong> where the<br />
true exposure figure is likely to lie within those bounds.<br />
<strong>The</strong> lower bound, or minimum <strong>stock</strong> exposure, is derived<br />
from those participants that had a choice <strong>of</strong> <strong>investment</strong>s<br />
that included <strong>employer</strong> <strong>stock</strong>. It <strong>as</strong>sumes that none<br />
<strong>of</strong> the participants with no <strong>investment</strong> choice held <strong>employer</strong><br />
<strong>stock</strong>. Because the potential to invest in <strong>employer</strong><br />
<strong>stock</strong> among those with a choice is known, consider this<br />
6 Monthly Labor Review • November 2008<br />
Employee contributions Employer contributions<br />
1985 1989 1993 1997 2000 2003 2005<br />
proportion to be the lower bound <strong>of</strong> overall <strong>stock</strong> exposure,<br />
<strong>as</strong> follows:<br />
• In 1985, 48 percent <strong>of</strong> <strong>401</strong>(k) participants were given<br />
an <strong>investment</strong> choice for <strong>employer</strong> matching funds<br />
and 61 percent <strong>of</strong> them had <strong>employer</strong> <strong>stock</strong> <strong>as</strong> one<br />
<strong>of</strong> the choices. Thus, about 29 percent (0.48 × 0.61<br />
= 0.29) <strong>of</strong> all participants had a choice and could<br />
choose <strong>employer</strong> <strong>stock</strong>.<br />
• <strong>The</strong> comparable figures in 2005 are 76 percent and<br />
19 percent, yielding about 14 percent (0.76 × 0.19 =<br />
0.14) <strong>of</strong> all participants who had a choice and could<br />
choose <strong>employer</strong> <strong>stock</strong>.<br />
• Using the same calculation, the lower bound for<br />
employee funds w<strong>as</strong> 63 percent in 1985, and it had<br />
fallen to 23 percent by 2005.<br />
<strong>The</strong> upper bound, or maximum <strong>stock</strong> exposure, <strong>as</strong>sumes<br />
that participants who are not given a choice <strong>of</strong> <strong>investment</strong>s<br />
have potentially all their funds invested in own-<strong>employer</strong><br />
<strong>stock</strong>. This w<strong>as</strong> the c<strong>as</strong>e in the Color Tile plans, for example,<br />
but it might not be the c<strong>as</strong>e in all plans. Looking<br />
at the <strong>investment</strong> <strong>of</strong> <strong>employer</strong> matching funds, 52 percent<br />
did not have an <strong>investment</strong> choice in 1985, and 24 percent<br />
80<br />
60<br />
40<br />
20<br />
0
did not have an <strong>investment</strong> choice in 2005. Adding those<br />
with no choice to those whose choices included <strong>employer</strong><br />
<strong>stock</strong> (the lower bound computed on page 6) yields the<br />
upper bound <strong>of</strong> potential <strong>employer</strong> <strong>stock</strong> exposure. For<br />
<strong>employer</strong> matching funds, that upper bound w<strong>as</strong> 81 percent<br />
<strong>of</strong> all participants in 1985 (0.52 + 0.29), but it had<br />
fallen to 38 percent <strong>of</strong> all participants in 2005 (24 plus<br />
14). <strong>The</strong> upper bound for employee funds w<strong>as</strong> 73 percent<br />
in 1985 and 32 percent in 2005.<br />
Mirroring the incre<strong>as</strong>e in <strong>investment</strong> choice and the<br />
<strong>decline</strong> in the choice <strong>of</strong> <strong>employer</strong> <strong>stock</strong>, the <strong>decline</strong> in the<br />
upper bound for <strong>employer</strong> funds is driven by incre<strong>as</strong>ed<br />
<strong>investment</strong> choice, while the <strong>decline</strong> in the upper bound<br />
for employee funds is driven by the decre<strong>as</strong>ed opportunity<br />
to choose <strong>employer</strong> <strong>stock</strong>. Charts 3 and 4 depict the lower<br />
and upper bound for employee and <strong>employer</strong> funds.<br />
Where, between these upper and lower bounds, did the<br />
true percent <strong>of</strong> workers with exposure to company <strong>stock</strong><br />
lie? NCS data in most years do not allow the direct me<strong>as</strong>urement<br />
<strong>of</strong> this figure. In 1993, however, the BLS benefits<br />
survey compiled data on the available <strong>investment</strong> <strong>vehicle</strong>s<br />
for <strong>401</strong>(k) funds, regardless <strong>of</strong> whether participants were<br />
allowed to direct their <strong>investment</strong>s. Such data can be dif-<br />
Chart 3. Potential <strong>investment</strong> <strong>of</strong> <strong>401</strong>(k) <strong>employer</strong> matching funds in <strong>employer</strong> <strong>stock</strong>, 1985–2005<br />
Percent <strong>of</strong> participants<br />
100<br />
80<br />
60<br />
40<br />
20<br />
Lower bound<br />
Upper bound<br />
ficult to capture from written plan descriptions, which <strong>of</strong>ten<br />
do not provide details <strong>of</strong> <strong>investment</strong>s when no choice<br />
is provided. Nonetheless, this 1 year <strong>of</strong> data provides a<br />
small piece <strong>of</strong> information to anchor projections <strong>of</strong> the<br />
exposure in the surrounding years.<br />
Among all plan participants in 1993, 43 percent were in<br />
plans that allowed <strong>investment</strong> <strong>of</strong> employee contributions<br />
in <strong>employer</strong> <strong>stock</strong>; the total potential exposure <strong>of</strong> <strong>employer</strong><br />
<strong>stock</strong> w<strong>as</strong> 43 percent. This compares with about 41<br />
percent <strong>of</strong> participants who could choose <strong>employer</strong> <strong>stock</strong><br />
<strong>as</strong> an <strong>investment</strong> (86 percent with choice multiplied by 48<br />
percent with <strong>stock</strong> <strong>as</strong> one <strong>of</strong> the choices). This suggests<br />
that only about 2 percent <strong>of</strong> all participants had plans that<br />
<strong>of</strong>fered no choice and were invested in <strong>employer</strong> <strong>stock</strong>.<br />
<strong>The</strong> story is quite different for <strong>employer</strong> matching contributions.<br />
In this c<strong>as</strong>e, the exposure for all participants<br />
w<strong>as</strong> 49 percent. This compares with 22 percent who could<br />
choose <strong>employer</strong> <strong>stock</strong> <strong>as</strong> an <strong>investment</strong> (0.58 × 0.38).<br />
Thus, about 27 percent <strong>of</strong> participants had plans in which<br />
<strong>employer</strong> matching funds were automatically invested in<br />
<strong>employer</strong> <strong>stock</strong>.<br />
Some <strong>as</strong>sumptions are used to project what this exposure<br />
number might have been in other years between 1985<br />
Projected value<br />
Percent <strong>of</strong> participants<br />
0<br />
0<br />
1985 1989 1993 1997 2000 2003 2005<br />
100<br />
80<br />
60<br />
40<br />
20<br />
Monthly Labor Review • November 2008 7
<strong>401</strong>(k) plans<br />
Chart 4. Potential <strong>investment</strong> <strong>of</strong> <strong>401</strong>(k) employee contributions in <strong>employer</strong> <strong>stock</strong>, 1985–2005<br />
Percent <strong>of</strong> participants Percent <strong>of</strong> participants<br />
80<br />
80<br />
70<br />
60<br />
50<br />
40<br />
30<br />
20<br />
10<br />
Lower bound<br />
Upper bound<br />
0<br />
0<br />
1985 1989 1993 1997 2000 2003 2005<br />
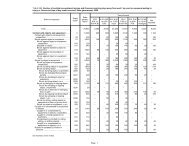
and 2005, <strong>as</strong> shown in table 1. To make this calculation,<br />
start by determining, for 1993, the percentage <strong>of</strong> participants<br />
having <strong>employer</strong> <strong>stock</strong> among those in which the<br />
employee had no choice over <strong>investment</strong> allocation; these<br />
figures were 12.29 percent (1.72 ÷ 14) for employee contributions<br />
and 64.19 percent (26.96 ÷ 42) for <strong>employer</strong><br />
contributions. Apply to these numbers the rate <strong>of</strong> change<br />
in <strong>employer</strong> <strong>stock</strong> observed between 1993 and the other<br />
years among contributions where the employee did choose<br />
the <strong>investment</strong> allocation. <strong>The</strong> overall <strong>employer</strong> <strong>stock</strong> exposure<br />
w<strong>as</strong> calculated from this projection.<br />
<strong>The</strong>se results provide a point estimate that lies between<br />
the upper and lower bounds. For employee funds, this<br />
point estimate straddles the lower bounds throughout the<br />
period, demonstrating that only a small proportion <strong>of</strong> the<br />
funds invested without employee choice went into <strong>employer</strong><br />
<strong>stock</strong>. As <strong>employer</strong> <strong>stock</strong> <strong>as</strong> a choice <strong>decline</strong>d, the<br />
overall exposure <strong>decline</strong>d at a comparable rate. Conversely,<br />
for <strong>employer</strong> funds, the point estimate begins at the upper<br />
bound in 1985, <strong>as</strong> nearly all funds invested without<br />
employee choice went into <strong>employer</strong> <strong>stock</strong>. <strong>The</strong> effect <strong>of</strong><br />
an incre<strong>as</strong>e in employee choice and a decre<strong>as</strong>e in <strong>stock</strong><br />
<strong>as</strong> a choice is seen <strong>as</strong> the point estimate <strong>decline</strong>s sharply<br />
8 Monthly Labor Review • November 2008<br />
Projected value<br />
over the two decades, ultimately nearing the lower bound.<br />
Decomposing this change, the <strong>decline</strong> can largely be attributed<br />
to the <strong>decline</strong> in the availability <strong>of</strong> <strong>stock</strong> <strong>as</strong> an<br />
<strong>investment</strong> choice. 14 <strong>The</strong> middle lines in charts 3 and 4<br />
identify the estimates <strong>of</strong> total <strong>employer</strong> <strong>stock</strong> exposure.<br />
Data by worker and establishment characteristics<br />
Although the BLS benefits program regularly updates<br />
the data that are collected and the methods <strong>of</strong> presentation,<br />
emph<strong>as</strong>is over the p<strong>as</strong>t few years h<strong>as</strong> been on presenting<br />
data for subgroupings within the private sector<br />
economy. Data on <strong>401</strong>(k) <strong>investment</strong> choices for 2005 are<br />
available by occupational group (white collar, blue collar,<br />
and service workers), industry group (goods producing<br />
and service producing), establishment employment (1 to<br />
99 workers and 100 or more workers), and whether the<br />
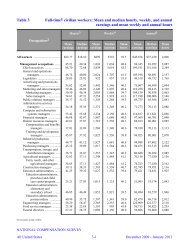
workers are union or nonunion. Table 2 provides data<br />
on whether employees can choose their <strong>investment</strong>s and<br />
whether their choices include <strong>employer</strong> <strong>stock</strong> for each <strong>of</strong><br />
these categories.<br />
<strong>The</strong> data in many <strong>of</strong> these categories show little variation,<br />
with a couple <strong>of</strong> exceptions. Looking at the availabil-<br />
70<br />
60<br />
50<br />
40<br />
30<br />
20<br />
10
Table 1. Calculation <strong>of</strong> <strong>employer</strong> <strong>stock</strong> penetration in <strong>401</strong>(k) plans, 1985–2005<br />
Employee contributions<br />
Share with <strong>investment</strong> choice ............................................................... 90.0 90.0 86.0 87.0 91.0 86.0 91.0<br />
Percent <strong>of</strong> share with <strong>employer</strong> <strong>stock</strong> <strong>as</strong> a choice ......................... 70.0 60.0 48.0 42.0 38.0 29.0 25.0<br />
Percent <strong>of</strong> total with <strong>employer</strong> <strong>stock</strong> <strong>as</strong> a choice........................... 63.0 54.0 41.3 36.5 34.6 24.9 22.8<br />
Percent <strong>of</strong> <strong>401</strong>(k) plan participants with <strong>investment</strong> choices by selected characteristics, 2005<br />
Characteristic<br />
Employee contributions<br />
Characteristic 1985 1989 1993 1997 2000 2003<br />
Share without <strong>investment</strong> choice ........................................................ 10.0 10.0 14.0 13.0 9.0 14.0 9.0<br />
Percent <strong>of</strong> share receiving <strong>employer</strong> <strong>stock</strong><br />
(projected) ............................................................................................... 17.9 15.4 1 12.3 10.8 9.7 7.4 6.4<br />
Percent <strong>of</strong> total receiving <strong>employer</strong> <strong>stock</strong><br />
with no choice (projected)................................................................. 1.8 1.5 1 1.7 1.4 .9 1.0 .6<br />
Total penetration (projected) ................................................................<br />
Employer contributions<br />
64.8 55.5 143.0 37.9 35.5 26.0 23.3<br />
Share with <strong>investment</strong> choice ............................................................... 48.0 53.0 58.0 65.0 65.0 72.0 76.0<br />
Percent <strong>of</strong> share with <strong>employer</strong> <strong>stock</strong> <strong>as</strong> a choice ......................... 61.0 50.0 38.0 25.0 20.0 21.0 19.0<br />
Percent <strong>of</strong> total with <strong>employer</strong> <strong>stock</strong> <strong>as</strong> a choice........................... 29.3 26.5 22.0 16.3 13.0 15.1 14.4<br />
Share without <strong>investment</strong> choice ........................................................ 52.0 47.0 42.0 35.0 35.0 28.0 24.0<br />
Percent <strong>of</strong> share receiving employe <strong>stock</strong> (projected) ................. 100.0 84.5 1 64.2 42.2 33.8 35.5 32.1<br />
Percent <strong>of</strong> total receiving <strong>employer</strong> <strong>stock</strong> with no choice<br />
(projected) ............................................................................................. 52.0 39.7 1 27.0 14.8 11.8 9.9 7.7<br />
Total penetration (projected) ................................................................ 81.3 66.2 1 49.0 31.0 24.8 25.1 22.1<br />
1 Estimated from 1993 data; other figures projected <strong>as</strong> discussed in text..<br />
Table 2.<br />
All workers<br />
White<br />
collar<br />
Occupational group<br />
Blue<br />
collar<br />
Goods Service 1 to 99<br />
producing producing workers Union<br />
100<br />
or more<br />
workers<br />
Investment choice allowed ..................... 91 91 92 91 89 92 91 92 97 91<br />
Choice includes company <strong>stock</strong>..........<br />
Employer contributions<br />
25 26 24 21 22 26 19 29 42 24<br />
Investment choice allowed ..................... 76 75 77 84 72 78 71 79 82 76<br />
Choice includes company <strong>stock</strong> .......... 19 19 18 19 16 20 14 22 31 18<br />
ity <strong>of</strong> <strong>investment</strong> options for employee contributions, 97<br />
percent <strong>of</strong> union participants have such options, compared<br />
with 91 percent <strong>of</strong> nonunion participants. (For all participants,<br />
the comparable figure is 91 percent and most other<br />
subgroupings show similar results.) Looking at the <strong>investment</strong><br />
choices available among those allowed to choose,<br />
42 percent <strong>of</strong> union participants who could choose their<br />
<strong>investment</strong>s had a choice <strong>of</strong> <strong>employer</strong> <strong>stock</strong>, compared<br />
with 24 percent <strong>of</strong> nonunion participants. (Again, comparable<br />
numbers for all participants and most other subgroupings<br />
were similar to the nonunion figures.) Looking<br />
at <strong>investment</strong> options for <strong>employer</strong> contributions, once<br />
again union participants more <strong>of</strong>ten had plans that allowed<br />
<strong>investment</strong> choice (82 percent <strong>of</strong> union participants<br />
NOTE: Results are rounded for presentation.<br />
Service<br />
workers<br />
Industry group<br />
Establishment<br />
size<br />
2005<br />
Union status<br />
Nonunion<br />
versus 76 percent <strong>of</strong> nonunion participants) and included<br />
<strong>employer</strong> <strong>stock</strong> among the choices (31 percent, compared<br />
with 18 percent).<br />
Although these patterns warrant further study, two<br />
factors might contribute to the difference between union<br />
and nonunion workers. First, union workers are much<br />
more likely to be in a defined benefit plan than are their<br />
nonunion counterparts—67 percent <strong>of</strong> union workers<br />
participate in a defined benefit plan, compared with 15<br />
percent <strong>of</strong> nonunion workers. 15 Second, union workers<br />
are more likely to be <strong>of</strong>fered defined contribution plans<br />
in addition to a defined benefit plan, while nonunion<br />
workers might only be <strong>of</strong>fered defined contribution plans.<br />
Thus, for union workers, <strong>401</strong>(k) plans might be consid-<br />
Monthly Labor Review • November 2008 9
<strong>401</strong>(k) plans<br />
ered supplemental plans, which may in turn give <strong>employer</strong>s<br />
more latitude to invest in <strong>employer</strong> <strong>stock</strong>.<br />
THE <strong>401</strong>(K) PLAN HAS BECOME THE MOST PROMINENT<br />
type <strong>of</strong> <strong>employer</strong>-provided retirement benefit plan—more<br />
than twice <strong>as</strong> many employees participate in such plans<br />
(or in similar defined contribution plans) <strong>as</strong> participate in<br />
defined benefit plans. As such, these plans have changed<br />
many <strong>of</strong> their provisions over time, in recognition that <strong>investment</strong><br />
risk is borne by the employee. <strong>The</strong> steady incre<strong>as</strong>e<br />
Notes<br />
Acknowledgment: <strong>The</strong> author would like to thank Keenan Dworak-Fisher,<br />
an economist in the BLS Office <strong>of</strong> Compensation and Working Conditions,<br />
for his advice and <strong>as</strong>sistance with tabulations and analysis.<br />
1 On October 24, 2007, the U.S. Department <strong>of</strong> Labor published final<br />
regulations (72 Federal Register 60452, October 24, 2007) related to the default<br />
<strong>investment</strong> <strong>of</strong> retirement plan <strong>as</strong>sets. <strong>The</strong>se regulations, which result from<br />
provisions <strong>of</strong> the Pension Protection Act <strong>of</strong> 2006 (Public Law 109–280), are<br />
codified in 29 Code <strong>of</strong> Federal Regulations 2550.404c–5.<br />
2 See Public Law 95–600, 92 Stat. 2763 (Nov. 6, 1978).<br />
3 For a discussion <strong>of</strong> <strong>employer</strong> matching contributions in <strong>401</strong>(k) plans, see<br />
Keenan Dworak-Fisher, “Employer Generosity in Employer-Matched <strong>401</strong>(k)<br />
plans, 2002–03,” Monthly Labor Review, September 2007, pp. 11–19.<br />
4 <strong>The</strong> U.S. Department <strong>of</strong> Labor, through its Employee Benefits Security<br />
Administration, provides guidance to <strong>employer</strong>s on <strong>investment</strong> education for<br />
their employees. See, for example, http://www.dol.gov/dol/allcfr/title_29/<br />
part_2509/29CFR2509.96-1.htm, <strong>as</strong> well <strong>as</strong> http://www.dol.gov/ebsa/publications/AC-1107a.html<br />
(both visited Jul. 7, 2008).<br />
5 For the most recent data on detailed provisions <strong>of</strong> employee benefits, including<br />
defined contribution plans, see National Compensation Survey: Employee<br />
Benefits in Private Industry in the United States, 2005, Bulletin 2589 (Bureau <strong>of</strong><br />
Labor Statistics, May 2007).<br />
6 Collection and tabulation <strong>of</strong> BLS benefits data have undergone several<br />
changes over the two decades covered in this study. Data for 1985 through 1997<br />
are for full-time workers in medium and large private establishments, which<br />
generally are those with 100 or more workers. Data for 2000 are for full-time<br />
workers in all private establishments, regardless <strong>of</strong> the number <strong>of</strong> workers in<br />
the establishment. Data for 2003 and 2005 are for all workers in all private<br />
establishments. Because <strong>of</strong> these changes, the analysis presented here is limited<br />
to details <strong>of</strong> plan provisions. While participation in <strong>401</strong>(k) plans may differ by<br />
employee group (such <strong>as</strong> full-time versus part-time workers), p<strong>as</strong>t studies <strong>of</strong><br />
changes in survey coverage have shown that plan provisions are <strong>of</strong>ten similar<br />
among all groups. Data by worker and establishment characteristics at the end<br />
<strong>of</strong> this article confirm this lack <strong>of</strong> variation. In addition, tabulation methods<br />
have changed over the period <strong>of</strong> this study; most notable, unknown plan provisions<br />
have been treated in different ways. In this study, every effort w<strong>as</strong> made to<br />
compare similar data. However, no estimates <strong>of</strong> sampling error were calculated<br />
for estimates in this article. <strong>The</strong>refore, statements <strong>of</strong> comparison could not be<br />
validated with a statistical test.<br />
7 <strong>The</strong>se new tabulations <strong>of</strong> the <strong>investment</strong> choice provisions for employee<br />
and <strong>employer</strong> funds are incomplete because data are missing for some plan<br />
provisions.<br />
8 See U.S. Code <strong>of</strong> Federal Regulations, 29 CFR 2550.404c-1. For further<br />
discussion, see Report <strong>of</strong> the Working Group on Employer Assets in ERISA Employer-<br />
Sponsored Plans (U.S. Department <strong>of</strong> Labor, Advisory Council on Employee<br />
Welfare and Pension Benefits Plans, Nov. 13, 1997), on the Internet at http://<br />
www.dol.gov/ebsa/publications/acemer.htm (visited Jul. 7, 2008).<br />
10 Monthly Labor Review • November 2008<br />
in the percent <strong>of</strong> participants who have <strong>investment</strong> choices<br />
for both employee and <strong>employer</strong> funds, and the steady<br />
decre<strong>as</strong>e in the percent who may choose <strong>employer</strong> <strong>stock</strong><br />
<strong>as</strong> one <strong>of</strong> those options, reflect both changes in law and<br />
regulation, concerns b<strong>as</strong>ed on high-pr<strong>of</strong>ile plans, and an incre<strong>as</strong>e<br />
in <strong>investment</strong> education among <strong>employer</strong>s and employees.<br />
Experimental tabulations further demonstrate that<br />
the upper bound <strong>of</strong> <strong>employer</strong> <strong>stock</strong> exposure h<strong>as</strong> <strong>decline</strong>d<br />
steadily in the p<strong>as</strong>t two decades <strong>as</strong> plans move toward putting<br />
all <strong>investment</strong> decisions in the hands <strong>of</strong> employees and<br />
providing education to help make those decisions.<br />
9 For more information on labor-management cooperative agreements, see<br />
George R. Gray, Donald W. Myers, and Phyllis S. Myers, Cooperative provisions<br />
in labor agreements: a new paradigm?” Monthly Labor Review, January<br />
1999, pp. 29–45.<br />
10 <strong>The</strong>se are just a few examples <strong>of</strong> issues related to the use <strong>of</strong> <strong>employer</strong> <strong>stock</strong><br />
<strong>as</strong> a <strong>401</strong>(k) <strong>investment</strong>. For more information on these and other examples,<br />
see Report <strong>of</strong> the Working Group on Employer Assets in ERISA Employer-Sponsored<br />
Plans, on the Internet at http://www.dol.gov/ebsa/publications/acemer.htm<br />
(visited Jul. 7, 2008); Eileen Alt Powell, “Holding too much company <strong>stock</strong> can<br />
hurt workers if company falters,” San Diego Union Tribune, Mar. 19, 2008, on<br />
the Internet at http://www.signonsandiego.com/news/business/20080319-<br />
1429-onthemoney.html (visited Jul. 8, 2008); and “Countrywide Sued Over<br />
<strong>401</strong>(k)s,” <strong>The</strong> W<strong>as</strong>hington Post, Sept. 13, 2007, p. D2 (visited Jul. 8, 2008).<br />
11 For more on <strong>investment</strong> education requirements, see Report <strong>of</strong> the Working<br />
Group on Employer Assets in ERISA Employer-Sponsored Plans, on the Internet at<br />
http://www.dol.gov/ebsa/publications/acemer.htm (visited Jul. 7, 2008).<br />
12 <strong>The</strong> availability <strong>of</strong> <strong>employer</strong> funds <strong>as</strong> an <strong>investment</strong> choice may be related<br />
to the type <strong>of</strong> company sponsoring the benefit plan. For example, smaller<br />
companies may be owned by a single proprietor or small number <strong>of</strong> owners;<br />
there may be no <strong>employer</strong> <strong>stock</strong>. In addition, some companies may have <strong>stock</strong><br />
holders but the <strong>stock</strong> is not publicly traded and not available for benefit plan<br />
participants. In such c<strong>as</strong>es, <strong>employer</strong> <strong>stock</strong> may not be an <strong>investment</strong> option.<br />
Looking at data for smaller versus larger establishments, the proportion <strong>of</strong> plan<br />
participants who had <strong>investment</strong> choice w<strong>as</strong> similar while the proportion that<br />
could <strong>investment</strong> in <strong>employer</strong> <strong>stock</strong> w<strong>as</strong> greater among larger <strong>employer</strong>s.<br />
13 It is important to recognize that the BLS data are limited to the benefit<br />
plan provisions; data do not include information on employee <strong>investment</strong><br />
decisions. Information on actual employee <strong>investment</strong>s is available from other<br />
sources, such <strong>as</strong> the Employee Benefit Research Institute (EBRI) and the Survey<br />
<strong>of</strong> Consumer Finance. EBRI data on <strong>401</strong>(k) <strong>as</strong>sets indicate that the portion <strong>of</strong><br />
<strong>as</strong>sets in <strong>employer</strong> <strong>stock</strong> h<strong>as</strong> dropped in recent years, from 19 percent in 1999<br />
to 11 percent in 2006. Changes in <strong>as</strong>set proportions may be due to <strong>investment</strong><br />
choices, <strong>investment</strong> returns, fund transfers, and other items. Information from<br />
EBRI may be found at www.ebri.org (visited Jul. 3, 2008). Data from the Survey<br />
<strong>of</strong> Consumer Finance are available on the Internet at www.federalreserve.gov/<br />
pubs/oss/oss2/scfindex.html (visited Jul. 3, 2008).<br />
14 Holding the availability <strong>of</strong> <strong>stock</strong> <strong>as</strong> an <strong>investment</strong> constant at 1993 levels,<br />
the <strong>decline</strong> in <strong>stock</strong> exposure from 1993 to 2005 is slight—only about 4 percentage<br />
points. Conversely, holding the availability <strong>of</strong> <strong>investment</strong> choice constant<br />
at 1993 levels, the <strong>decline</strong> in <strong>stock</strong> exposure mirrors the <strong>decline</strong> shown in<br />
chart 3. <strong>The</strong>se tests indicate that, among <strong>employer</strong> funds, eliminating <strong>stock</strong> <strong>as</strong> an<br />
<strong>investment</strong> choice h<strong>as</strong> by far the greater effect on overall <strong>stock</strong> exposure.<br />
15 For recent BLS data on participation in benefit plans, see National Compensation<br />
Survey: Employee Benefits in Private Industry in the United States,<br />
March 2007, Summary 07–05 (Bureau <strong>of</strong> Labor Statistics, August 2007);<br />
available on the Internet at http://www.bls.gov/ncs/ebs/sp/ebsm0006.pdf.<br />
(visited Sept. 8, 2008).
Not-For-Pr<strong>of</strong>it Sector<br />
Zack Warren<br />
Zack Warren is an<br />
economist in the Occupational<br />
Employment<br />
Statistics program,<br />
Bureau <strong>of</strong> Labor Statistics.<br />
E-mail: warren.<br />
zachary@bls.gov<br />
Occupational employment<br />
in the not-for-pr<strong>of</strong>it sector<br />
<strong>The</strong> for-pr<strong>of</strong>it and not-for-pr<strong>of</strong>it sectors differ in regards to the industries<br />
with the most employees and the types <strong>of</strong> jobs that employees most<br />
commonly hold; the average wage <strong>of</strong> each sector is similar, but in a given<br />
occupation, the pr<strong>of</strong>it sector is generally more highly remunerative<br />
Over the l<strong>as</strong>t few years, not-for-pr<strong>of</strong>it<br />
employment h<strong>as</strong> expanded rapidly.<br />
Employment in not-for-pr<strong>of</strong>it establishments<br />
incre<strong>as</strong>ed by over 5 percent in<br />
2 years between 2002 and 2004; 1 over the<br />
same period, total private employment incre<strong>as</strong>ed<br />
by less than 1 percent. 2 Likewise,<br />
the number <strong>of</strong> not-for-pr<strong>of</strong>it establishments<br />
h<strong>as</strong> incre<strong>as</strong>ed by more than 36 percent in<br />
the l<strong>as</strong>t 10 years. 3 This rapid employment<br />
growth, combined with the unique nature <strong>of</strong><br />
not-for-pr<strong>of</strong>it activities, h<strong>as</strong> generated significant<br />
interest in employment patterns <strong>of</strong><br />
not-for-pr<strong>of</strong>it establishments.<br />
Although there are a fair number <strong>of</strong> statistics<br />
relating to the number and type <strong>of</strong><br />
not-for-pr<strong>of</strong>it establishments in the United<br />
States, there are surprisingly few employment<br />
and wage data on the people who work<br />
in this sector. Among the most comprehensive<br />
analyses <strong>of</strong> not-for-pr<strong>of</strong>it employment<br />
w<strong>as</strong> a study by Lester M. Salamon and S.<br />
Wojciech Sokolowski, who detailed the size<br />
and urban nature <strong>of</strong> not-for-pr<strong>of</strong>it work and<br />
described not-for-pr<strong>of</strong>it employment by<br />
industry. 4 This article seeks to further their<br />
analysis by identifying the kinds <strong>of</strong> jobs<br />
found in the not-for-pr<strong>of</strong>it sector, <strong>as</strong> well<br />
<strong>as</strong> by comparing the wages <strong>of</strong> those working<br />
for not-for-pr<strong>of</strong>its with the wages <strong>of</strong><br />
those working in for-pr<strong>of</strong>it establishments.<br />
It also examines differences in occupational<br />
staffing patterns between for-pr<strong>of</strong>it and notfor-pr<strong>of</strong>it<br />
establishments within the same<br />
industry. This is accomplished by combining<br />
data from the 2006 Occupational Employment<br />
Statistics (OES) survey <strong>of</strong> the Bureau<br />
<strong>of</strong> Labor Statistics with tax-exempt-status<br />
information from the Internal Revenue<br />
Service’s Business M<strong>as</strong>ter File <strong>of</strong> the Statistics<br />
<strong>of</strong> Income program. 5<br />
For the purposes <strong>of</strong> this article, a not-forpr<strong>of</strong>it<br />
establishment is defined <strong>as</strong> one with<br />
501(c) tax-exemption status. Not-for-pr<strong>of</strong>it<br />
organizations include “corporations, and any<br />
community chest, fund, or foundation, organized<br />
and operated exclusively for religious,<br />
charitable, scientific, testing for public safety,<br />
literary, or educational purposes…no part <strong>of</strong><br />
the net wages <strong>of</strong> which inures to the benefit<br />
<strong>of</strong> any private shareholder or individual.”<br />
Not-for-pr<strong>of</strong>it establishments also consist<br />
<strong>of</strong> some labor and agricultural organizations,<br />
business leagues, clubs and fraternal organizations,<br />
employee benefit organizations, and<br />
credit unions. 6 In order to maintain not-forpr<strong>of</strong>it<br />
status, not-for-pr<strong>of</strong>it establishments<br />
must not contribute to political campaigns.<br />
As the aforementioned definition shows,<br />
the not-for-pr<strong>of</strong>it sector consists <strong>of</strong> much<br />
more than interest groups and charities. Although<br />
the 501(c) status does not encomp<strong>as</strong>s<br />
all not-for-pr<strong>of</strong>it work, it does cover a<br />
broad range <strong>of</strong> activities. <strong>The</strong> definition <strong>of</strong><br />
not-for-pr<strong>of</strong>it employment b<strong>as</strong>ed on 501(c)<br />
status excludes government workers; in this<br />
article, occupational employment and wage<br />
data for government workers are presented<br />
alongside the private for-pr<strong>of</strong>it and private<br />
not-for-pr<strong>of</strong>it establishments in industries<br />
where government employment is significant.<br />
When cross-industry government estimates<br />
are included, they comprise State-,<br />
local-, and Federal-level data. Industry-specific<br />
government estimates are for State and<br />
local government only.<br />
Monthly Labor Review • November 2008 11
Not-For-Pr<strong>of</strong>it Sector<br />
Description <strong>of</strong> the data set<br />
<strong>The</strong> OES program surveys 1.2 million business establishments<br />
in six semiannual collection panels over a period <strong>of</strong><br />
3 years. Each establishment is <strong>as</strong>ked to provide occupation<br />
and wage information on each <strong>of</strong> its workers. <strong>The</strong> data are<br />
used to create employment and wage estimates for the 801<br />
occupations in the Standard Occupational Cl<strong>as</strong>sification<br />
system; the estimates are for the Nation, States, all metropolitan<br />
and nonmetropolitan are<strong>as</strong>, and almost 400 industries<br />
defined according to the North American Industry<br />
Cl<strong>as</strong>sification System (NAICS). <strong>The</strong> sample is stratified<br />
and weighted by the establishments’ 4- or 5-digit NAICS<br />
industry, by State or territory (including Puerto Rico, the<br />
Virgin Islands and Guam), by metropolitan or nonmetropolitan<br />
area, and by size. Because the OES survey does<br />
not <strong>as</strong>k whether establishments are for pr<strong>of</strong>it or not for<br />
pr<strong>of</strong>it, the original OES sample weights, which represent<br />
individual establishments’ probability <strong>of</strong> selection, are not<br />
adjusted for pr<strong>of</strong>it-status.<br />
<strong>The</strong> estimates presented in this article were created by<br />
pairing 2006 survey year OES establishment records with<br />
the 501(c)-firm m<strong>as</strong>ter list from the IRS Business M<strong>as</strong>ter<br />
Table 1. Industries with high levels <strong>of</strong> not-for-pr<strong>of</strong>it employment, 2006<br />
NAICS Industry<br />
12 Monthly Labor Review • November 2008<br />
File. Records were linked on the b<strong>as</strong>is <strong>of</strong> the Employer<br />
Identification Number (EIN), which is an identifier <strong>as</strong>signed<br />
by the IRS to all <strong>employer</strong>s that file taxes. In this<br />
article, it is <strong>as</strong>sumed that all establishments under a taxexempt<br />
EIN are tax exempt, because EINs are firm specific<br />
and not establishment specific. This methodology<br />
produced a sample <strong>of</strong> approximately 80,000 OES units<br />
identified <strong>as</strong> tax exempt, out <strong>of</strong> the total OES sample <strong>of</strong><br />
1.2 million establishments. Although the OES sample<br />
does not target not-for-pr<strong>of</strong>it establishments specifically,<br />
the large size and deep stratification <strong>of</strong> the sample<br />
are sufficient to produce estimates for the not-for-pr<strong>of</strong>it<br />
sector nationally and for industries with a relatively large<br />
percentage <strong>of</strong> not-for-pr<strong>of</strong>it employment. This matching<br />
process is similar to, but less robust than, the one used by<br />
Salamon and Sokolowski to identify not-for-pr<strong>of</strong>it establishments<br />
within the Quarterly Census <strong>of</strong> Employment<br />
and Wages. 7<br />
Industries in the not-for-pr<strong>of</strong>it sector<br />
Overall, not-for-pr<strong>of</strong>it employees make up approximately<br />
8 percent <strong>of</strong> the total weighted employment in the OES<br />
Not-for-pr<strong>of</strong>it For-pr<strong>of</strong>it Government Percent <strong>of</strong> emp-<br />
employment employment employment ployment in notfor-pr<strong>of</strong>its<br />
6221 General, medical, and surgical hospitals ................................................... 3,375,840 741,890 799,020 69<br />
6113 Colleges, universities, and pr<strong>of</strong>essional schools ..................................... 994,510 81,630 1,632,110 37<br />
6241 Individual and family services ....................................................................... 665,180 299,040 ( 1 ) 69<br />
6111 Elementary and secondary schools ............................................................ 490,470 236,380 7,650,530 6<br />
6231 Nursing care facilities ....................................................................................... 411,470 1,159,310 ( 1 ) 26<br />
8134 Civic and social organizations ....................................................................... 374,910 34,130 ( 1 ) 92<br />
6232 Residential mental retardation, mental health, and substance<br />
abuse facilities ................................................................................................ 337,260 166,920 ( 1 ) 67<br />
8139 Business, pr<strong>of</strong>essional, labor, political, and similar organizations .... 307,020 120,170 ( 1 ) 72<br />
6211 Offices <strong>of</strong> physicians ......................................................................................... 293,560 1,848,440 ( 1 ) 14<br />
6243 Vocational rehabilitation services ................................................................ 257,100 54,850 ( 1 ) 82<br />
6244 Child day care services ..................................................................................... 251,560 517,390 ( 1 ) 33<br />
6214 Outpatient care centers ................................................................................... 241,290 246,730 ( 1 ) 49<br />
6233 Community care facilities for the elderly .................................................. 222,860 405,060 ( 1 ) 35<br />
7139 Other amusement and recreation Industries .......................................... 215,300 850,130 ( 1 ) 20<br />
6216 Home health care services ............................................................................. 170,050 684,980 ( 1 ) 20<br />
5511 Management <strong>of</strong> companies and enterprises ........................................... 167,210 1,629,380 ( 1 ) 9<br />
5417 Scientific research and development services ........................................ 157,190 429,470 ( 1 ) 27<br />
8133 Social advocacy organizations ...................................................................... 156,870 10,050 ( 1 ) 94<br />
6239 Other residential care facilities ..................................................................... 119,870 45,080 ( 1 ) 73<br />
5221 Depository credit intermediation ................................................................ 115,950 1,690,210 ( 1 ) 6<br />
6242 Community food and housing, and emergency and<br />
other relief services ...................................................................................... 107,480 22,910 ( 1 ) 82<br />
8132 Grantmaking and giving services ................................................................ 107,030 11,920 ( 1 ) 90<br />
7121 Museums, historical sites, and similar institutions ................................. 104,230 16,090 ( 1 ) 86<br />
8131 Religious organizations ................................................................................... 100,800 81,360 ( 1 ) 55<br />
1 Data are not available by industry for Federal Government workers or for State and local government workers outside schools and hospitals.
sample, where<strong>as</strong> for-pr<strong>of</strong>it employment is over 75 percent<br />
<strong>of</strong> the total; the remaining 16 percent <strong>of</strong> employees are in<br />
the public sector. Table 1 shows the 4-digit NAICS industries<br />
in the OES sample with the highest levels <strong>of</strong> not-forpr<strong>of</strong>it<br />
employment, <strong>as</strong> well <strong>as</strong> the for-pr<strong>of</strong>it employment<br />
in the same industries. In agreement with previous studies,<br />
the table reveals that not-for-pr<strong>of</strong>its participate mostly in<br />
healthcare, educational, or community support activities.<br />
Occupations in the not-for-pr<strong>of</strong>it sector<br />
<strong>The</strong> occupational composition <strong>of</strong> for-pr<strong>of</strong>it, not-for-pr<strong>of</strong>it,<br />
and government employment is shown in chart 1, with the<br />
share <strong>of</strong> employment in each <strong>of</strong> the 22 major occupational<br />
groups shown along the x-axis. For example, community<br />
and social services occupations represent only 0.3 percent<br />
<strong>of</strong> for-pr<strong>of</strong>it employment, but this occupational group<br />
represents about 7 percent <strong>of</strong> not-for-pr<strong>of</strong>it employment.<br />
<strong>The</strong> occupational mix <strong>of</strong> not-for-pr<strong>of</strong>its is influenced by<br />
the industries in which not-for-pr<strong>of</strong>its are concentrated.<br />
Compared with for-pr<strong>of</strong>it establishments, not-for-pr<strong>of</strong>its<br />
tend to employ more community and social service workers,<br />
teachers, healthcare workers, and personal care and<br />
service workers. <strong>The</strong>se occupations are concentrated in the<br />
healthcare and social <strong>as</strong>sistance industry and the education<br />
industry, which have the largest not-for-pr<strong>of</strong>it employment.<br />
<strong>The</strong>y also employ far smaller shares <strong>of</strong> sales workers,<br />
food service workers, construction and extraction workers,<br />
maintenance workers, production workers, and transportation<br />
workers, because these occupational categories are<br />
more commonly <strong>as</strong>sociated with pr<strong>of</strong>it-seeking activities:<br />
a not-for-pr<strong>of</strong>it organization that is not manufacturing or<br />
selling a product will understandably require fewer sales<br />
and production workers than a for-pr<strong>of</strong>it establishment.<br />
Wages in the not-for-pr<strong>of</strong>it sector<br />
Across all industries, for-pr<strong>of</strong>it employees earned an average<br />
hourly wage <strong>of</strong> $18.13, while not-for-pr<strong>of</strong>it employees<br />
had a slightly higher average wage <strong>of</strong> $19.93. Although<br />
the total average wages were higher for not-for-pr<strong>of</strong>it<br />
workers, this w<strong>as</strong> <strong>of</strong>ten primarily due to the occupational<br />
composition and the relative lack <strong>of</strong> very low paying occupations<br />
in these establishments. It is also possible that<br />
the duties performed by people employed in these lowpaying<br />
occupations are also performed in not-for-pr<strong>of</strong>it<br />
establishments, but by volunteers instead <strong>of</strong> paid workers.<br />
Because unpaid workers are excluded from the OES survey,<br />
their work w<strong>as</strong> not captured by this study.<br />
Chart 2 shows in more detail how occupational mix<br />
contributes to the difference in average wages. Despite<br />
the higher average wages in not-for-pr<strong>of</strong>it establishments<br />
compared with for-pr<strong>of</strong>it establishments, not-for-pr<strong>of</strong>its<br />
paid less for the same type <strong>of</strong> work: occupation by occupation,<br />
for-pr<strong>of</strong>it workers had higher average wages<br />
than not-for pr<strong>of</strong>it workers in 12 <strong>of</strong> the 22 occupational<br />
groups, including most <strong>of</strong> the higher paying occupational<br />
groups with more highly skilled workers. For many <strong>of</strong> the<br />
occupational groups, these wage differences are relatively<br />
small; 8 however, in the instances where there is a large gap<br />
in wages for the same occupational group, the gap generally<br />
favors the for-pr<strong>of</strong>it workers. Some occupations had<br />
higher wages in not-for-pr<strong>of</strong>it establishments, including<br />
education-related occupations, architecture and engineering<br />
occupations, healthcare support workers, food service<br />
occupations, and building service occupations. Overall,<br />
government workers out-earned both for-pr<strong>of</strong>it and notfor-pr<strong>of</strong>it<br />
workers in production and service occupations,<br />
where<strong>as</strong> for-pr<strong>of</strong>it workers out-earned government workers<br />
and not-for-pr<strong>of</strong>it workers in pr<strong>of</strong>essional occupations.<br />
In the few major occupational groups where not-forpr<strong>of</strong>it<br />
employees earned considerably higher wages than<br />
for-pr<strong>of</strong>it employees, the comparisons may not be especially<br />
meaningful because <strong>of</strong> the small employment totals<br />
or, in the c<strong>as</strong>e <strong>of</strong> education workers, may be somewhat<br />
misleading. For example, the construction and extraction<br />
and farming, fishing, and forestry occupational groups<br />
both show an advantage for not-for-pr<strong>of</strong>it employees;<br />
however, not-for-pr<strong>of</strong>it workers in these groups are extremely<br />
rare. Although education workers earned higher<br />
wages in not-for-pr<strong>of</strong>it establishments, the premium is<br />
magnified by differences in the detailed occupational composition<br />
within this group. Education workers are shown<br />
to have had higher wages in part because postsecondary<br />
teachers, who generally earn more than elementary and<br />
secondary school teachers, made up a larger part <strong>of</strong> notfor-pr<strong>of</strong>it<br />
employment, and in part because teachers <strong>of</strong> all<br />
types earned more in private not-for-pr<strong>of</strong>its than they did<br />
in private for-pr<strong>of</strong>it establishments, <strong>as</strong> shown below.<br />
Not-for-pr<strong>of</strong>it For-pr<strong>of</strong>it Government<br />
Postsecondary ........... $69,581 $53,254 $63,596<br />
Primary and<br />
Secondary ................. $37,968 $29,761 $50,117<br />
Salamon and Sokolowski demonstrated that, contrary<br />
to the conventional wisdom, workers in educational services<br />
earned higher wages in not-for-pr<strong>of</strong>its than in forpr<strong>of</strong>it<br />
establishments; 9 by examining occupational data<br />
Monthly Labor Review • November 2008 13
Not-For-Pr<strong>of</strong>it Sector<br />
Chart 1. Distribution <strong>of</strong> employment in not-for-pr<strong>of</strong>it, for-pr<strong>of</strong>it, and government establishments<br />
Occupational group<br />
14 Monthly Labor Review • November 2008<br />
Management<br />
Business and financial operations<br />
Computer and mathematical<br />
Architecture and engineering<br />
Life, physical, and social science<br />
Community and social services<br />
Legal<br />
Education, training, and library<br />
Arts, design, entertainment, sports, and media<br />
Healthcare practitioners and technical operations<br />
Healthcare support<br />
Protective service<br />
Food preparation and serving related<br />
Building and grounds cleaning and maintenance<br />
Personal care and service<br />
Sales and related<br />
Office and administrative support<br />
Farming, fishing, and forestry<br />
Construction and extraction<br />
Installation, maintenance, and repair<br />
Production<br />
Transportation and material moving<br />
Percentage <strong>of</strong> the sector in occupational group 1<br />
0 5 10 15 20 25 30 35<br />
Not-for-pr<strong>of</strong>it<br />
For-pr<strong>of</strong>it<br />
Government<br />
0 5 10 15 20 25 30 35<br />
Percentage <strong>of</strong> the sector in occupational group 1<br />
1 This refers to the percentage <strong>of</strong> the sector (not-for-pr<strong>of</strong>it, for-pr<strong>of</strong>it, or government) that is represented by the occupational group in question, across<br />
all industries. For example, community and social services occupations represents 7 percent <strong>of</strong> not-for-pr<strong>of</strong>it employment.
Chart 2. Mean hourly wages in not-for-pr<strong>of</strong>it, for-pr<strong>of</strong>it, and government establishments<br />
Occupational group<br />
Management<br />
Business and financial operations<br />
Computer and mathematical<br />
Architecture and engineering<br />
Life, physical, and social science<br />
Community and social services<br />
Legal<br />
Education, training, and library<br />
Arts, design, entertainment, sports, and media<br />
Healthcare practitioners and technical<br />
Healthcare support<br />
Protective service<br />
Food preparation and serving related<br />
Building and grounds cleaning and maintenance<br />
Personal care and service<br />
Sales and related<br />
Office and adminstrative support<br />
Farming, fishing, and forestry<br />
Construction and extraction<br />
Installation, maintenance and repair<br />
Production<br />
Transportation and material moving<br />
Hourly wage, in dollars<br />
0 5 10 15 20 25 30 35 40 45 50<br />
Not-for-pr<strong>of</strong>it<br />
For-pr<strong>of</strong>it<br />
Government<br />
0 5 10 15 20 25 30 35 40 45 50<br />
Hourly wage, in dollars<br />
Monthly Labor Review • November 2008 15
Not-For-Pr<strong>of</strong>it Sector<br />
one can see exactly why. Postsecondary education teachers’<br />
wages were generally lower in the government sector than<br />
in not-for-pr<strong>of</strong>its, where<strong>as</strong> government wages were usually<br />
higher for elementary and secondary school teachers<br />
than teachers’ wages in both for-pr<strong>of</strong>its and not-for-pr<strong>of</strong>its.<br />
Full employment and wage data for all detailed occupations<br />
are shown in appendix table A–1 at the end <strong>of</strong><br />
this article.<br />
Managers and employees in legal occupations had much<br />
higher wages in for-pr<strong>of</strong>it establishments. This holds true<br />
for all detailed management occupations except education<br />
administrators and food service managers. <strong>The</strong> premium<br />
for legal occupations is due in part to the much higher<br />
wages for lawyers and law clerks in for-pr<strong>of</strong>it establishments,<br />
<strong>as</strong> well <strong>as</strong> to the larger share <strong>of</strong> legal occupation<br />
employment that lawyers and law clerks constitute. Managers<br />
and employees in legal occupations have the highest<br />
wage premiums in for-pr<strong>of</strong>it establishments in part because,<br />
compared with people in other occupations, these<br />
two groups have by far the widest range <strong>of</strong> wages and<br />
therefore more room for differentiation compared with<br />
low-paying occupations, which feature very narrow wage<br />
ranges.<br />
Because an establishment’s industry is a major determinant<br />
<strong>of</strong> its occupational composition, comparing forpr<strong>of</strong>it<br />
and not-for-pr<strong>of</strong>it establishments within the same<br />
industry provides the best means <strong>of</strong> examining the effects<br />
<strong>of</strong> pr<strong>of</strong>it status on occupational staffing patterns. <strong>The</strong><br />
next section examines three industries with high levels <strong>of</strong><br />
not-for-pr<strong>of</strong>it employment: the hospital industry, which<br />
is the largest <strong>employer</strong> <strong>of</strong> not-for-pr<strong>of</strong>it workers; depository<br />
credit intermediation, which h<strong>as</strong> the majority <strong>of</strong> its<br />
employment in for-pr<strong>of</strong>its; and social advocacy, which h<strong>as</strong><br />
the majority <strong>of</strong> its employment in not-for-pr<strong>of</strong>its.<br />
General medical and surgical hospitals<br />
Of the industries shown in table 1, general medical and<br />
surgical hospitals had the highest level <strong>of</strong> not-for-pr<strong>of</strong>it<br />
employment. “This industry comprises establishments<br />
known and licensed <strong>as</strong> general medical and surgical<br />
hospitals primarily engaged in providing diagnostic and<br />
medical treatment (both surgical and nonsurgical) to<br />
inpatients with any <strong>of</strong> a wide variety <strong>of</strong> medical conditions.”<br />
10 Among the industries examined in this study, the<br />
general medical and surgical hospital industry is notable<br />
for its lack <strong>of</strong> differentiation between for-pr<strong>of</strong>it and notfor-pr<strong>of</strong>it<br />
establishments. By most me<strong>as</strong>ures other than<br />
total employment, the for-pr<strong>of</strong>it and not-for-pr<strong>of</strong>it sectors<br />
<strong>of</strong> this industry are very similar, because each sector<br />
16 Monthly Labor Review • November 2008<br />
employs relatively the same types <strong>of</strong> workers, <strong>as</strong> shown in<br />
table 2.<br />
<strong>The</strong> only two occupational groups with more than a percentage<br />
point difference in employment share are healthcare<br />
practitioners and technical workers, representing 55<br />
percent <strong>of</strong> for-pr<strong>of</strong>it employment and about 53 percent <strong>of</strong><br />
not-for-pr<strong>of</strong>it employment, and <strong>of</strong>fice and administrative<br />
support workers, with approximate shares <strong>of</strong> 15 percent <strong>of</strong><br />
not-for-pr<strong>of</strong>it employment and 14 percent <strong>of</strong> for-pr<strong>of</strong>it<br />
employment. Within the healthcare practitioner occupational<br />
group, the distribution <strong>of</strong> employment among the<br />
occupations is also very similar. <strong>The</strong> biggest differences are<br />
found in employment shares <strong>of</strong> physicians and surgeons<br />
and the nursing occupations. Physicians and surgeons<br />
account for 2.2 percent <strong>of</strong> employment in not-for-pr<strong>of</strong>it<br />
hospitals, 1.2 percent in for-pr<strong>of</strong>it hospitals, and 2.5 percent<br />
in State and local government hospitals.<br />
This may in part reflect differences in how the doctors are<br />
employed rather than in the number <strong>of</strong> doctors working<br />
at the hospital: private, for-pr<strong>of</strong>it hospitals may be more<br />
likely to have doctors who are self employed and would<br />
not be captured by the OES survey. Private for-pr<strong>of</strong>it<br />
hospitals employed relatively more registered nurses and<br />
licensed practical nurses than private not-for-pr<strong>of</strong>it hospitals<br />
and government hospitals. Not-for-pr<strong>of</strong>it hospitals<br />
also had about 8 percent more <strong>of</strong>fice and administrative<br />
support workers. <strong>The</strong> difference in <strong>of</strong>fice and administrative<br />
support employment is not due to a large difference<br />
in any single occupation, but rather to an accumulation <strong>of</strong><br />
small differences in most occupations between for-pr<strong>of</strong>it<br />
and not-for-pr<strong>of</strong>it hospitals.<br />
Average wages across all occupations in this industry<br />
were $21.95 per hour in the for-pr<strong>of</strong>it sector and $22.59<br />
per hour in the not-for-pr<strong>of</strong>it sector—a marginal but statistically<br />
significant 64-cent advantage for not-for-pr<strong>of</strong>it<br />
employees. Average wages for all occupations were similar<br />
in part because the staffing patterns were similar, and in<br />
part because the wages for individual occupations were<br />
similar. As with employment, the biggest differences in<br />
wages were in nursing occupations, because registered<br />
nurses, licensed practical nurses, and nursing aides earned<br />
between 2 percent and 5 percent more in not-for-pr<strong>of</strong>it<br />
hospitals, <strong>as</strong> shown in table 3.<br />
<strong>The</strong> similarities between the two sectors are due to several<br />
re<strong>as</strong>ons, not le<strong>as</strong>t <strong>of</strong> which is that the nature <strong>of</strong> hospital<br />
activities demands an adherence to standards <strong>of</strong> patient<br />
care and welfare that may limit the ability <strong>of</strong> pr<strong>of</strong>it-seeking<br />
hospitals to distinguish themselves from not-forpr<strong>of</strong>it<br />
hospitals in terms <strong>of</strong> production and staffing. Also,<br />
in contr<strong>as</strong>t to industries where not-for-pr<strong>of</strong>its make up a
Table 2. Occupational employment in for-pr<strong>of</strong>it, not-for-pr<strong>of</strong>it, and government establishments in general medical and<br />
surgical hospitals, 2006<br />
Occupation<br />
For-pr<strong>of</strong>it<br />
employment<br />
Not-for-pr<strong>of</strong>it<br />
employment<br />
Government Percentage Percentage<br />
employment <strong>of</strong> for-pr<strong>of</strong>it <strong>of</strong> not-foremployment<br />
pr<strong>of</strong>it employment<br />
Relative percent<br />
difference<br />
Percentage<br />
between for-<br />
<strong>of</strong><br />
pr<strong>of</strong>it and not-<br />
government<br />
for-pr<strong>of</strong>it<br />
employment<br />
1<br />
Total, all occupations ....................... 741,890 3,375,840 799,020 100.0 100.0 100.0 ...<br />
Management ................................................... 26,410 112,450 27,660 3.6 3.3 3.5 6<br />
Business and financial operations ............ 11,310 59,330 14,150 1.5 1.8 1.8 –15<br />
Computer and mathematical ..................... 5,490 33,650 8,560 .7 1.0 1.1 –35<br />
Architecture and engineering ................... 640 3,540 760 .1 .1 .1 –22<br />
Life, physical, and social science ............... 2,500 16,260 3,380 .3 .5 .4 –43<br />
Community and social services ................. 11,900 63,380 16,010 1.6 1.9 2.0 –17<br />
Legal .................................................................... 90 800 230 .0 .0 .0 –105<br />
Education, training, and library ................. 2,530 13,550 4,050 .3 .4 .5 –18<br />
Arts, design, entertainment, sports,<br />
and media ....................................................... 780 6,670 1,460 .1 .2 .2 –88<br />
Healthcare practitioners and technical ... 408,210 1,773,890 408,780 55.0 52.5 51.2 5<br />
Dentists, general ......................................... 50 500 270 .01 .01 .03 –120<br />
Dietitians and nutritionists ..................... 2,400 12,280 2,800 .32 .36 .35 –13<br />
Pharmacists .................................................. 8,080 35,930 8,340 1.09 1.06 1.04 2<br />
Anesthesiologists ....................................... 390 2,500 820 .05 .07 .10 –42<br />
Family and general practitioners .......... 1,780 11,730 2,610 .24 .35 .33 –45<br />
Internists, general....................................... 590 5,230 760 .08 .16 .10 –95<br />
Obstetricians and gynecologists .......... 260 1,630 310 .03 .05 .04 –38<br />
Pediatricians, general ................................ 300 2,320 540 .04 .07 .07 –71<br />
Psychiatrists .................................................. 260 2,670 560 .04 .08 .07 –122<br />
Surgeons ....................................................... 560 3,860 510 .08 .11 .06 –52<br />
Physicians and surgeons, all other ....... 4,970 42,750 14,030 .67 1.27 1.76 –89<br />
Physician <strong>as</strong>sistants ................................... 1,280 11,250 2,010 .17 .33 .25 –93<br />
Registered nurses ....................................... 218,950 951,140 211,300 29.51 28.17 26.45 5<br />
Occupational therapists ........................... 3,810 16,100 3,440 .51 .48 .43 7<br />
Physical therapists ..................................... 7,150 31,390 6,530 .96 .93 .82 4<br />
Respiratory therapists ............................... 14,260 50,120 10,670 1.92 1.48 1.34 23<br />
Medical and clinical laboratory<br />
technologists ........................................... 14,020 68,710 14,640 1.89 2.04 1.83 –8<br />
Medical and clinical laboratory<br />
technicians ............................................... 9,000 43,620 9,670 1.21 1.29 1.21 –7<br />
Cardiov<strong>as</strong>cular technologists and<br />
technicians ............................................... 4,980 23,480 4,570 .67 .70 .57 –4<br />
Diagnostic medical sonographers ....... 4,130 18,450 3,480 .56 .55 .44 ( 2 )<br />
Radiologic technologists and<br />
technicians ............................................... 19,360 78,780 17,130 2.61 2.33 2.14 11<br />
Emergency medical technicians and<br />
paramedics ............................................... 6,260 24,110 9,230 .84 .71 1.16 15<br />
Pharmacy technicians............................... 7,880 33,410 7,790 1.06 .99 .98 7<br />
Surgical technologists .............................. 10,740 40,390 8,790 1.45 1.20 1.10 17<br />
Licensed practical and licensed<br />
vocational nurses ................................... 33,940 107,210 33,870 4.57 3.18 4.24 31<br />
Medical records and health<br />
information technicians ...................... 9,970 41,250 10,380 1.34 1.22 1.30 9<br />
Health technologists and<br />
technicians, all other ............................ 4,530 24,250 4,320 .61 .72 .54 –18<br />
Healthcare support ........................................ 94,130 430,380 103,980 12.7 12.7 13.0 ( 2 )<br />
Nursing aides, orderlies, and<br />
attendants ................................................ 59,330 259,860 64,520 8.00 7.70 8.07 4<br />
Medical <strong>as</strong>sistants ...................................... 5,920 33,240 8,950 .80 .98 1.12 –23<br />
Medical equipment preparers ............... 3,710 20,950 3,950 .50 .62 .49 –24<br />
Medical transcriptionists ......................... 5,330 27,490 5,470 .72 .81 .68 –13<br />
Healthcare support workers, all other 10,080 48,820 9,190 1.36 1.45 1.15 –6<br />
Protective service ........................................... 4,910 26,800 6,600 .7 .8 .8 –20<br />
See note at end <strong>of</strong> table.<br />
Monthly Labor Review • November 2008 17
Not-For-Pr<strong>of</strong>it Sector<br />
Table 2. Continued—Occupational employment in for-pr<strong>of</strong>it, not-for-pr<strong>of</strong>it, and government establishments in general<br />
medical and surgical hospitals, 2006<br />
For-pr<strong>of</strong>it Not-for-pr<strong>of</strong>it Government Percentage Percentage Percentage<br />
Occupation employment employment employment <strong>of</strong> for-pr<strong>of</strong>it <strong>of</strong> not-for- <strong>of</strong><br />
employment pr<strong>of</strong>it employ- government<br />
ment employment<br />
Sales and related ............................................ 1,580 9,980 1,540 .2 .3 .2 –39<br />
Office and administrative support ........... 106,300 520,100 125,850 14.3 15.4 15.8 –8<br />
First-line supervisors/managers<br />
<strong>of</strong> <strong>of</strong>fice and administrative<br />
support workers ..................................... 6,190 28,360 7,310 .83 .84 .91 ( 2 )<br />
Switchboard operators, including<br />
answering service .................................. 4,790 15,030 3,590 .65 .45 .45 31<br />
Bill and account collectors ...................... 3,640 12,200 3,960 .49 .36 .50 26<br />
Billing and posting clerks and<br />
machine operators ................................ 5,620 29,120 7,390 .76 .86 .92 –14<br />
Bookkeeping, accounting, and<br />
auditing clerks ........................................ 3,800 20,890 6,050 .51 .62 .76 –21<br />
Interviewers, except eligibility<br />
and loan .................................................... 11,920 56,620 12,240 1.61 1.68 1.53 –4<br />
Receptionists and information<br />
clerks .......................................................... 5,600 30,140 5,580 .75 .89 .70 –18<br />
Stock clerks and order fillers .................. 3,720 17,250 4,330 .50 .51 .54 ( 2 )<br />
Medical secretaries .................................... 14,490 64,990 15,760 1.95 1.93 1.97 ( 2 )<br />
Secretaries, except legal, medical,<br />
and executive .......................................... 8,220 48,910 8,440 1.11 1.45 1.06 –31<br />
Office clerks, general ................................. 15,880 73,150 27,110 2.14 2.17 3.39 ( 2 )<br />
Construction and extraction ...................... 1,690 9,260 2,580 .2 .3 .3 –21<br />
Installation, maintenance, and repair ..... 7,230 34,590 9,440 1.0 1.0 1.2 –5<br />
Production ........................................................ 3,140 17,430 4,360 .4 .5 .5 –22<br />
Transportation and material moving ...... 1,930 11,370 2,310 .3 .3 .3 –29<br />
relatively small proportion <strong>of</strong> total industry employment,<br />
not-for-pr<strong>of</strong>its accounted for 69 percent <strong>of</strong> employment<br />
in the hospital industry, and they may influence wages in<br />
the hospital industry more than not-for-pr<strong>of</strong>its influence<br />
wages in other industries.<br />
Depository credit intermediation<br />
<strong>The</strong> depository credit intermediation industry illustrates a<br />
different <strong>as</strong>pect <strong>of</strong> not-for-pr<strong>of</strong>it employment: in contr<strong>as</strong>t<br />
to hospitals, and despite composing one <strong>of</strong> the industries<br />
with the highest level <strong>of</strong> not-for-pr<strong>of</strong>it employment, the<br />
establishments in the depository credit intermediation<br />
industry are overwhelmingly for-pr<strong>of</strong>it. This industry is<br />
made up mostly <strong>of</strong> commercial banks, which are primarily<br />
for-pr<strong>of</strong>it institutions, and credit unions, which are equally<br />
18 Monthly Labor Review • November 2008<br />
Relative<br />
percent<br />
difference<br />
between<br />
for-pr<strong>of</strong>it<br />
and not-forpr<strong>of</strong>it<br />
1<br />
Food preparation and serving related .... 21,410 94,270 22,770 2.9 2.8 2.8 3<br />
Building and grounds cleaning and<br />
maintenance ............................................... 27,600 121,880 30,420 3.7 3.6 3.8 3<br />
Personal care and service ............................ 2,110 16,250 4,150 .3 .5 .5 –69<br />
1 This refers to the relative percentage difference between for-pr<strong>of</strong>it<br />
and not-for-pr<strong>of</strong>it percentage <strong>of</strong> employment, using the for-pr<strong>of</strong>it<br />
percentage <strong>as</strong> a b<strong>as</strong>e, which allows occupations with low and high levels<br />
<strong>of</strong> employment to be more e<strong>as</strong>ily compared.<br />
2 All differences are statistically significant at the 90-percent confidence<br />
level, except those marked <strong>as</strong> footnote 2.<br />
NOTE: Occupations that are indented are categories <strong>of</strong> the non-indented<br />
occupational groups and enter into each respective occupational group’s<br />
estimate. <strong>The</strong>y are broken out from the occupational groups in order to<br />
provide more detail where necessary.<br />
divided between for-pr<strong>of</strong>it and not-for-pr<strong>of</strong>it establishments<br />
in the OES sample. As shown in table 4, this industry—unlike<br />
the hospital industry—shows a clear distinction<br />
between the pr<strong>of</strong>it sector and not-for-pr<strong>of</strong>it sector in<br />
regards to occupational employment and wages. Not-forpr<strong>of</strong>it<br />
establishments in this industry accounted for only 6<br />
percent <strong>of</strong> total industry employment and therefore likely<br />
held much less sway over the industry’s wages than notfor-pr<strong>of</strong>it<br />
hospitals.<br />
Total average wages in this industry were $20.06 per<br />
hour in for-pr<strong>of</strong>it establishments, compared with $17.04<br />
in not-for-pr<strong>of</strong>it organizations. Unlike the cross-industry<br />
totals, this difference appears across the occupational<br />
board and is more than a mere effect <strong>of</strong> the occupational<br />
mix in the two establishment types. Wages in for-pr<strong>of</strong>it establishments<br />
were significantly higher in all occupational
Table 3. Occupational wages in for-pr<strong>of</strong>it, not-for-pr<strong>of</strong>it, and government establishments in general medical and surgical<br />
hospitals, 2006<br />
Occupation<br />
Difference Difference<br />
For–pr<strong>of</strong>it Not–for–pr<strong>of</strong>it Government between between<br />
wage wage wage for-pr<strong>of</strong>it for-pr<strong>of</strong>it<br />
and not-for- and<br />
pr<strong>of</strong>it government<br />
Total, all occupations .......................................... $21.95 $22.59 $21.24 –$0.64 $0.71 $1.35<br />
Management ................................................................... 40.82 42.58 39.96 –1.76 .86 2.62<br />
Business and financial operations ............................ 24.64 25.31 24.47 –.67 ( 1 ) .84<br />
Computer and mathematical ..................................... 28.08 28.25 27.21 ( 1 ) ( 1 ) 1.04<br />
Architecture and engineering ................................... 28.65 26.66 27.87 1.99 ( 1 ) –1.21<br />
Life, physical, and social science ............................... 31.67 30.12 25.65 1.55 6.02 4.47<br />
Community and social services ................................. 22.01 22.24 21.20 ( 1 ) .81 1.04<br />
Legal .................................................................................... 42.43 40.53 32.33 ( 1 ) 10.10 8.20<br />
Education, training, and library ................................. 32.43 26.20 34.03 ( 1 ) ( 1 ) –7.83<br />
Arts, design, entertainment, sports, and media .. 21.42 21.57 19.93 ( 1 ) 1.49 1.64<br />
Healthcare practitioners and technical .................. 26.64 27.84 26.24 –1.20 ( 1 ) 1.60<br />
Dentists, general ......................................................... 49.92 57.29 41.54 ( 1 ) 8.38 15.75<br />
Dietitians and nutritionists ..................................... 23.36 23.12 22.86 ( 1 ) .50 ( 1 )<br />
Pharmacists .................................................................. 45.01 44.21 44.77 .80 ( 1 ) –.56<br />
Anesthesiologists ....................................................... 72.26 73.05 73.46 ( 1 ) ( 1 ) (1)<br />
Family and general practitioners .......................... 68.96 67.41 73.16 ( 1 ) ( 1 ) –5.75<br />
Internists, general....................................................... 76.42 62.84 67.01 13.58 9.41 ( 1 )<br />
Obstetricians and gynecologists .......................... 68.24 74.63 76.96 ( 1 ) ( 1 ) –2.33<br />
Pediatricians, general ................................................ 65.71 60.28 68.21 ( 1 ) ( 1 ) –7.93<br />
Psychiatrists .................................................................. 69.07 63.58 63.55 ( 1 ) ( 1 ) ( 1 )<br />
Surgeons ....................................................................... 75.47 73.13 79.26 ( 1 ) ( 1 ) ( 1 )<br />
Physicians and surgeons, all other ....................... 58.41 55.66 38.71 ( 1 ) 19.70 16.95<br />
Physician <strong>as</strong>sistants ................................................... 35.60 35.95 36.72 ( 1 ) –1.12 ( 1 )<br />
Registered nurses ....................................................... 28.97 29.48 28.26 –.51 .71 1.22<br />
Occupational therapists ........................................... 31.32 29.94 30.60 1.38 .72 –.66<br />
Physical therapists ..................................................... 33.14 32.09 32.22 1.05 .92 ( 1 )<br />
Respiratory therapists ............................................... 23.03 23.47 22.43 –.44 .60 1.04<br />
Medical and clinical laboratory technologists . 24.32 24.34 23.70 ( 1 ) .62 .64<br />
Medical and clinical laboratory technicians ..... 17.46 17.32 16.89 ( 1 ) .57 .43<br />
Cardiov<strong>as</strong>cular technologists and technicians 20.18 20.87 19.89 –.69 ( 1 ) .98<br />
Diagnostic medical sonographers ...................... 27.42 27.93 26.61 –.51 .81 1.32<br />
Radiologic technologists and technicians ........ 23.57 24.01 22.98 –.44 .59 1.03<br />
Emergency medical technicians and<br />
paramedics .................................................... 14.82 14.88 13.78 ( 1 ) 1.04 1.10<br />
Pharmacy technicians ............................................. 14.17 14.32 14.00 ( 1 ) ( 1 ) .32<br />
Surgical technologists .............................................. 17.52 17.94 16.45 –.42 1.07 1.49<br />
Licensed practical and licensed vocational<br />
nurses .......................................................................... 16.90 17.51 16.18 –.61 .72 1.33<br />
Medical records and health information<br />
technicians ................................................................ 14.71 15.40 14.51 –.69 ( 1 ) .89<br />
Health technologists and technicians,<br />
all other ......................................................... 19.86 18.71 18.29 1.15 1.57 ( 1 )<br />
Healthcare support ........................................................ 12.27 12.70 11.77 –.43 .50 .93<br />
Nursing aides, orderlies, and attendants ........... 11.27 11.81 10.72 –.54 .55 1.09<br />
Medical <strong>as</strong>sistants ...................................................... 13.15 14.03 13.46 –.88 –.31 .57<br />
Medical equipment preparers ............................... 12.97 13.14 12.28 ( 1 ) .69 .86<br />
Medical transcriptionists ......................................... 15.25 15.08 13.96 ( 1 ) 1.29 1.12<br />
Healthcare support workers, all other ................ 13.45 13.19 12.98 ( 1 ) ( 1 ) ( 1 )<br />
Protective service ........................................................... 13.58 13.86 15.49 ( 1 ) –1.91 –1.63<br />
Food preparation and serving related .................... 10.38 10.93 10.29 –.55 ( 1 ) .64<br />
Building and grounds cleaning and<br />
maintenance ............................................................... 10.24 10.89 10.19 –.65 ( 1 ) .70<br />
Personal care and service ............................................ 11.65 12.14 10.97 ( 1 ) .68 1.17<br />
Sales and related ............................................................ 13.63 14.37 13.30 ( 1 ) ( 1 ) 1.07<br />
Office and administrative support ........................... 13.85 14.40 13.70 –.55 ( 1 ) .70<br />
First-line supervisors/managers <strong>of</strong> <strong>of</strong>fice and<br />
See notes at end <strong>of</strong> table.<br />
Difference<br />
between<br />
not-for-pr<strong>of</strong>it<br />
and<br />
government<br />
Monthly Labor Review • November 2008 19
Not-For-Pr<strong>of</strong>it Sector<br />
Table 3. Continued—Occupational wages in for-pr<strong>of</strong>it, not-for-pr<strong>of</strong>it, and government establishments in general medical<br />
and surgical hospitals, 2006<br />
Occupation<br />
administrative support workers ........................ $21.88 $22.69 $21.02 –$0.81 $0.86 $1.67<br />
Switchboard operators, including<br />
answering service ................................................... 11.07 11.75 10.80 –.68 .27 .95<br />
Bill and account collectors ...................................... 13.83 14.41 13.10 –.58 .73 1.31<br />
Billing and posting clerks and machine<br />
operators .................................................................... 13.55 14.17 13.26 –.62 ( 1 ) .91<br />
Bookkeeping, accounting, and auditing<br />
clerks ............................................................................ 14.63 15.24 14.76 –.61 ( 1 ) .48<br />
Office clerks, general ................................................. 12.07 12.97 12.92 –.90 –.85 ( 1 )<br />
Interviewers, except eligibility and loan ............ 12.83 13.10 12.18 –.27 .65 .92<br />
Receptionists and information clerks ................. 11.74 12.47 11.12 –.73 .62 1.35<br />
Stock clerks and order fillers .................................. 12.80 12.82 12.89 ( 1 ) ( 1 ) ( 1 )<br />
Medical secretaries .................................................... 13.59 13.85 12.97 –.26 .62 .88<br />
Secretaries, except legal, medical, and<br />
executive .................................................................... 13.14 14.49 13.31 –1.35 ( 1 ) 1.18<br />
Construction and extraction ...................................... 21.84 22.97 24.57 –1.13 –2.73 –1.60<br />
Installation, maintenance, and repair ..................... 17.09 18.39 17.20 –1.30 ( 1 ) 1.19<br />
Production ........................................................................ 15.88 14.81 13.26 1.07 2.62 1.55<br />
Transportation and material moving ...................... 12.92 12.71 12.89 ( 1 ) ( 1 ) ( 1 )<br />
1 All differences are statistically significant at the 90-percent confidence<br />
level, except those marked <strong>as</strong> footnote 1.<br />
NOTE: Occupations that are indented are categories <strong>of</strong> the non-indented<br />
groups other than protective services; building, cleaning<br />
and maintenance occupations; and legal occupations, all<br />
<strong>of</strong> which are very small parts <strong>of</strong> the depository credit intermediation<br />
industry. <strong>The</strong> differences are illustrated by<br />
the high-paying occupations: for-pr<strong>of</strong>it managers earned<br />
an average <strong>of</strong> $45.89 per hour, compared with $38.91 for<br />
not-for-pr<strong>of</strong>it managers; for-pr<strong>of</strong>it business and financial<br />
workers earned $28.87, compared with $21.32; and forpr<strong>of</strong>it<br />
computer and mathematical workers earned $32.58,<br />
compared with $24.47.<br />
As illustrated in table 4, not-for-pr<strong>of</strong>it credit intermediaries<br />
also showed a significant difference in occupational<br />
mix from their for-pr<strong>of</strong>it counterparts: for-pr<strong>of</strong>it establishments<br />
employed relatively more managers and business<br />
and financial workers and, like for-pr<strong>of</strong>it hospitals,<br />
relatively fewer <strong>of</strong>fice and administrative support workers.<br />
Among the business and financial operations occupations,<br />
the not-for-pr<strong>of</strong>its employed larger concentrations <strong>of</strong><br />
loan <strong>of</strong>ficers, loan counselors, and training and development<br />
specialists than the for-pr<strong>of</strong>its, where<strong>as</strong> most other<br />
business and financial operations occupations were more<br />
prevalent in the for-pr<strong>of</strong>it establishments.<br />
Among <strong>of</strong>fice and administrative workers, wages were<br />
generally higher in for-pr<strong>of</strong>it establishments. Bank tellers<br />
are one <strong>of</strong> the few occupations that received higher wages<br />
20 Monthly Labor Review • November 2008<br />
Difference Difference<br />
For-pr<strong>of</strong>it Not-for-pr<strong>of</strong>it Government between between<br />
wage wage wage for-pr<strong>of</strong>it for-pr<strong>of</strong>it<br />
and not-for- and<br />
pr<strong>of</strong>it government<br />
Difference<br />
between<br />
not-for-pr<strong>of</strong>it<br />
and<br />
government<br />
occupational groups and enter into each respective occupational group’s estimate.<br />
<strong>The</strong>y are broken out from the occupational groups in order to provide<br />
more detail where necessary.<br />
in not-for pr<strong>of</strong>it establishments, averaging $10.88 per<br />
hour in for-pr<strong>of</strong>its and $11.19 in not-for-pr<strong>of</strong>its. In addition<br />
to differences in wages, there were large differences<br />
in the occupational distribution <strong>of</strong> bank-related <strong>of</strong>fice and<br />
administrative workers. Tellers, who are heavily concentrated<br />
in the credit intermediation industry, accounted for<br />
29.8 percent <strong>of</strong> employment in for-pr<strong>of</strong>it establishments<br />
and 35.4 percent in not-for-pr<strong>of</strong>its. Similarly, loan interviewers<br />
accounted for 4.4 percent in for-pr<strong>of</strong>it businesses<br />
and 5.7 percent in not-for-pr<strong>of</strong>its. <strong>The</strong> difference in distribution<br />
among bank tellers, loan interviewers, and other<br />
bank-related <strong>of</strong>fice occupations may be due to the more<br />
diverse product lines <strong>of</strong>fered by for-pr<strong>of</strong>it banks, which<br />
serve a wider market than credit unions (because credit<br />
unions, by definition, restrict their membership).<br />
Perhaps most tellingly, for-pr<strong>of</strong>it banks also employed,<br />
by a large margin, relatively more sales workers than notfor-pr<strong>of</strong>it<br />
establishments in the industry. This suggests<br />
that active sales are a much more important part <strong>of</strong> forpr<strong>of</strong>it<br />
business, which again relates to the more diverse<br />
products available from the for-pr<strong>of</strong>it banks, compared<br />
with the credit unions. Although for-pr<strong>of</strong>it banks employed<br />
higher shares <strong>of</strong> most sales occupations, the largest<br />
difference w<strong>as</strong> in the share <strong>of</strong> securities, commodities, and<br />
financial services sales agents, who accounted for 2.9 per
Table 4. For-pr<strong>of</strong>it and not-for-pr<strong>of</strong>it employment and wages in depository credit intermediation, 2006<br />
Occupation<br />
For-pr<strong>of</strong>it Not-for-pr<strong>of</strong>it For-pr<strong>of</strong>it Not-for- Percentage Percentage Relative Wage<br />
employment employment wage pr<strong>of</strong>it wage <strong>of</strong> for-pr<strong>of</strong>it <strong>of</strong> not-for- percentage difference<br />
employ- pr<strong>of</strong>it difference<br />
ment employment between<br />
for-pr<strong>of</strong>it and<br />
not-for-pr<strong>of</strong>it 1<br />
Total, all occupations .......................... 1,690,210 115,950 $20.06 $17.04 100.0 100.0 ... $3.02<br />
Management ................................................... 140,820 9,330 45.89 38.91 8.3 8.0 ( 2 ) 6.98<br />
Business and financial operations ............ 275,990 17,120 28.87 21.32 16.3 14.8 10 7.55<br />
Training and development<br />
specialists ................................................... 5,550 590 23.29 21.90 .33 .51 –54 1.39<br />
Business operations specialists,<br />
all other....................................................... 15,100 720 29.65 23.86 .89 .62 31 5.79<br />
Accountants and auditors ....................... 24,340 1,900 26.40 22.80 1.44 1.64 ( 2 ) 3.60<br />
Credit analysts ............................................. 14,820 480 28.20 20.92 .88 .42 52 7.28<br />
Financial analysts ....................................... 16,670 200 34.43 27.25 .99 .17 83 7.18<br />
Personal financial advisors ...................... 23,680 250 36.62 36.59 1.40 .22 84 ( 2 )<br />
Loan counselors .......................................... 4,320 540 22.01 16.62 .26 .47 –83 5.39<br />
Loan <strong>of</strong>ficers ................................................. 121,560 10,860 27.80 20.35 7.19 9.37 –30 7.45<br />
Financial specialists, all other ................. 19,390 480 27.41 22.84 1.15 .41 64 4.57<br />
Computer and mathematical ..................... 53,280 2,350 32.58 24.47 3.2 2.0 36 8.11<br />
Life, physical, and social science ............... 4,510 490 29.76 24.47 .3 .4 –59 5.29<br />
Legal .................................................................... 3,140 60 44.57 34.94 .2 .1 71 ( 2 )<br />
Arts, design, entertainment, sports, and<br />
media ......................................................... 3,520 450 24.61 20.86 .2 .4 –88 3.75<br />
Protective service ........................................... 4,240 440 17.16 20.28 .3 .4 ( 2 ) ( 2 )<br />
Building and grounds cleaning and<br />
maintenance ............................................ 7,260 400 9.48 11.34 .4 .3 19 –1.86<br />
Sales and related ............................................ 80,790 1,460 26.92 23.26 4.8 1.3 74 3.66<br />
Securities, commodities, and financial<br />
services sales agents .............................. 48,930 610 29.35 23.40 2.89 .53 82 5.95<br />
Sales representatives, services,<br />
all other....................................................... 16,010 380 21.95 21.04 .95 .33 66 ( 2 )<br />
Office and administrative support ........... 1,111,640 83,430 13.47 13.34 65.8 72.0 –9 ( 2 )<br />
First-line supervisors/managers <strong>of</strong><br />
<strong>of</strong>fice and administrative support<br />
workers ...................................................... 103,460 7,570 21.25 20.84 6.12 6.52 ( 2 ) ( 2 )<br />
Bill and account collectors ...................... 20,290 2,570 15.35 15.35 1.20 2.22 –85 ( 2 )<br />
Bookkeeping, accounting, and<br />
auditing clerks .......................................... 58,020 3,890 13.90 14.80 3.43 3.35 ( 2 ) –.90<br />
Tellers .............................................................. 503,950 41,000 10.88 11.19 29.82 35.36 –19 –.31<br />
Customer service representatives ........ 97,520 7,330 14.36 13.99 5.77 6.32 ( 2 ) ( 2 )<br />
Loan interviewers and clerks ................. 74,030 6,600 15.18 14.80 4.38 5.69 –30 ( 2 )<br />
New accounts clerks .................................. 68,430 5,650 14.06 13.57 4.05 4.87 –20 .49<br />
Receptionists and information<br />
clerks ............................................................ 8,040 1,010 11.20 11.09 .48 .87 –83 ( 2 )<br />
Executive secretaries and<br />
administrative <strong>as</strong>sistants ...................... 34,600 1,350 18.99 18.29 2.05 1.16 43 .70<br />
Office clerks, general ................................. 37,740 2,020 12.32 11.94 2.23 1.74 22 .38<br />
Installation, maintenance, and repair ..... 3,410 330 16.19 16.70 .2 .3 –43 ( 2 )<br />
Production ........................................................ 320 ( 3 ) 18.94 ( 3 ) .0 .0 49 ( 2 )<br />
1 This refers to the relative percentage difference between for-pr<strong>of</strong>it and<br />
not-for-pr<strong>of</strong>it percentage <strong>of</strong> employment, using the for-pr<strong>of</strong>it percentage <strong>as</strong><br />
a b<strong>as</strong>e, which allows occupations with low and high levels <strong>of</strong> employment to<br />
be more e<strong>as</strong>ily compared.<br />
2 All differences are statistically significant at the 90-percent confidence<br />
level, except those marked <strong>as</strong> footnote 2.<br />
cent <strong>of</strong> employment in for-pr<strong>of</strong>it establishments and only<br />
0.5 percent in not-for-pr<strong>of</strong>it establishments. Finally, forpr<strong>of</strong>it<br />
establishments employed relatively more computer<br />
and mathematical workers, which may be a function <strong>of</strong> the<br />
greater urgency for innovation in the for-pr<strong>of</strong>it sector.<br />
3 Data not available.<br />
NOTE: Occupations that are indented are categories <strong>of</strong> the nonindented<br />
occupational groups and enter into each respective occupational<br />
group’s estimate. <strong>The</strong>y are broken out from the occupational groups in<br />
order to provide more detail where necessary.<br />
Social advocacy organizations<br />
<strong>The</strong> industry that most typifies what is generally considered<br />
to be not-for-pr<strong>of</strong>it work is the social advocacy<br />
industry, which comprises “establishments primarily en-<br />
Monthly Labor Review • November 2008 21
Not-For-Pr<strong>of</strong>it Sector<br />
Table 5. For-pr<strong>of</strong>it and not-for-pr<strong>of</strong>it employment and wages in social advocacy organizations, 2006<br />
Occupation<br />
22 Monthly Labor Review • November 2008<br />
For-pr<strong>of</strong>it Not-for-pr<strong>of</strong>it For-pr<strong>of</strong>it Not-for- Percentage Percentage <strong>of</strong> Relative Wage<br />
employment employment wage pr<strong>of</strong>it wage <strong>of</strong> for-pr<strong>of</strong>it not-for-pr<strong>of</strong>it percentage difference<br />
employ- employment difference<br />
ment between for-<br />
pr<strong>of</strong>it and<br />
not-for-pr<strong>of</strong>it 1<br />
Total, all occupations .............................. 10,050 156,870 $18.68 $17.95 100.0 100.0 ... $0.73<br />
Management .......................................................... 930 17,190 36.80 34.42 9.3 11.0 –18 ( 2 )<br />
Public relations managers .............................. 60 1,260 33.36 37.17 .56 .80 –44 –3.81<br />
Financial managers ........................................... 90 720 39.39 37.57 .85 .46 46 ( 2 )<br />
Social and community service<br />
managers ......................................................... 350 5,210 31.11 26.46 3.44 3.32 ( 2 ) ( 2 )<br />
General and operations managers ............. 230 5,290 41.32 40.98 2.25 3.37 –50 ( 2 )<br />
Business and financial operations ................... 920 11,590 27.62 23.22 9.2 7.4 20 4.40<br />
Meeting and convention planners ............. ( 3 ) 660 25.68 19.92 ( 3 ) .42 ( 2 ) 5.76<br />
Business operations specialists,<br />
all other .............................................................. 430 5,370 26.58 22.05 4.27 3.42 20 4.53<br />
Accountants and auditors .............................. 130 2,420 26.16 26.67 1.28 1.54 –21 ( 2 )<br />
Community and social services ........................ 2,350 27,500 16.49 15.93 23.4 17.5 25 ( 2 )<br />
Mental health counselors ............................... 170 330 12.05 16.89 1.70 .21 87 –4.84<br />
Child, family, and school social workers.... 220 5,650 21.20 16.37 2.21 3.60 –63 4.83<br />
Medical and public health social<br />
workers ............................................................. 130 1,600 25.03 18.72 1.31 1.02 22 6.31<br />
Mental health and substance abuse<br />
social workers ................................................. 440 1,540 16.87 16.44 4.39 .98 78 ( 2 )<br />
Social workers, all other .................................. 100 1,070 23.59 18.28 .98 .68 30 5.31<br />
Health educators ............................................... 50 1,470 12.30 19.16 .45 .93 –108 –6.86<br />
Social and human service <strong>as</strong>sistants .......... 750 8,380 12.50 12.86 7.46 5.34 28 ( 2 )<br />
Community and social service<br />
specialists, all other ...................................... 390 5,220 17.89 17.61 3.89 3.33 14 ( 2 )<br />
Arts, design, entertainment, sports, and<br />
media .................................................................... 500 7,730 29.54 24.28 5.0 4.9 ( 2 ) ( 2 )<br />
Healthcare practitioners and technical ......... 70 1,730 33.60 21.24 .7 1.1 –63 12.36<br />
Building and grounds cleaning and<br />
maintenance ...................................................... 140 3,510 11.43 10.61 1.4 2.2 –60 ( 2 )<br />
Personal care and service ................................... 1,480 19,570 8.94 9.72 14.7 12.5 15 –.78<br />
Office and administrative support .................. 1,850 32,260 14.40 14.40 18.4 2.6 –11 ( 2 )<br />
Computer and mathematical ............................ 170 2,150 25.39 27.08 1.7 1.4 18 ( 2 )<br />
Life, physical, and social science ...................... 500 4,340 21.02 27.43 5.0 2.8 45 –6.41<br />
Legal ........................................................................... 70 1,710 24.10 32.99 .7 1.1 –51 –8.89<br />
Education, training, and library ........................ 290 11,000 12.37 13.34 2.8 7.0 –147 ( 2 )<br />
Healthcare support ............................................... 20 800 11.41 10.21 .2 .5 –116 ( 2 )<br />
Food preparation and serving related ........... 120 2,990 9.08 8.84 1.2 1.9 –65 ( 2 )<br />
Sales and related ................................................... 160 3,740 15.03 19.89 1.6 2.4 –45 –4.86<br />
Farming, fishing, and forestry ........................... 40 440 15.20 12.12 .4 .3 32 ( 2 )<br />
Construction and extraction ............................. 60 500 22.31 15.92 .6 .3 50 6.39<br />
Installation, maintenance, and repair ............ 80 1,490 17.31 14.36 .8 1.0 –15 2.95<br />
Transportation and material moving ............. 80 3,480 11.17 10.36 .8 2.2 –173 ( 2 )<br />
1 This refers to the relative percentage difference between for-pr<strong>of</strong>it<br />
and not-for-pr<strong>of</strong>it percentage <strong>of</strong> employment, using the for-pr<strong>of</strong>it<br />
percentage <strong>as</strong> a b<strong>as</strong>e, which allows occupations with low and high levels<br />
<strong>of</strong> employment to be more e<strong>as</strong>ily compared.<br />
2 All differences are statistically significant at the 90-percent<br />
confidence level, except those marked <strong>as</strong> footnote 2.<br />
gaged in promoting a particular cause or working for the<br />
realization <strong>of</strong> a specific social or political goal to benefit a<br />
broad or specific constituency.” 11 <strong>The</strong> industry, predictably,<br />
heavily favors the not-for-pr<strong>of</strong>it sector, which makes up<br />
94 percent <strong>of</strong> industry employment. Although the total<br />
number <strong>of</strong> not-for-pr<strong>of</strong>it jobs in this industry is not <strong>as</strong><br />
large <strong>as</strong> it is in some other industries, social advocacy or-<br />
3 Data not available.<br />
NOTE: Occupations that are indented are categories <strong>of</strong> the non-indented<br />
occupational groups and enter into each respective occupational group’s estimate.<br />
<strong>The</strong>y are broken out from the occupational groups in order to provide<br />
more detail where necessary.<br />
ganizations had the highest percentage <strong>of</strong> not-for-pr<strong>of</strong>it<br />
employment, <strong>as</strong> shown in table 1.<br />
<strong>The</strong> staffing patterns in the for-pr<strong>of</strong>it and not-for-pr<strong>of</strong>it<br />
sectors <strong>of</strong> the social advocacy industry are disparate. <strong>The</strong><br />
largest difference between the for-pr<strong>of</strong>it and not-forpr<strong>of</strong>it<br />
establishments in the industry is in the community<br />
and social service occupational group, which makes up 23
percent <strong>of</strong> for-pr<strong>of</strong>it social advocacy employment and only<br />
18 percent <strong>of</strong> not-for-pr<strong>of</strong>it social advocacy employment.<br />
(See table 5.) <strong>The</strong> difference in this group is driven by two<br />
mental-health-related occupations and by the <strong>as</strong>sistants<br />
to the people in those occupations. <strong>The</strong> two occupations<br />
are mental health and substance abuse social workers and<br />
mental health counselors. Mental health and substance<br />
abuse workers accounted for 4.4 percent <strong>of</strong> employment<br />
in for-pr<strong>of</strong>it social advocacy establishments and one percent<br />
in not-for-pr<strong>of</strong>it social advocacy establishments.<br />
Mental health counselors accounted for 1.7 percent <strong>of</strong><br />
employment in for-pr<strong>of</strong>its and 0.2 percent in not-forpr<strong>of</strong>its.<br />
Social and human service <strong>as</strong>sistants accounted for<br />
7.5 percent <strong>of</strong> not-for-pr<strong>of</strong>it employment and 5.3 percent<br />
<strong>of</strong> for-pr<strong>of</strong>it employment. <strong>The</strong> not-for-pr<strong>of</strong>it sector employed<br />
a higher concentration <strong>of</strong> education, training, and<br />
library workers, and a lower concentration <strong>of</strong> business and<br />
financial occupations. As it w<strong>as</strong> in other industries, the<br />
share <strong>of</strong> <strong>of</strong>fice and administrative workers w<strong>as</strong> higher in<br />
the not-for-pr<strong>of</strong>it sector.<br />
Despite having fairly similar total average wages <strong>of</strong> $18.68<br />
per hour in for-pr<strong>of</strong>it establishments and $17.95 per hour<br />
in not-for-pr<strong>of</strong>it establishments, the social advocacy industry<br />
had relative wages that differed greatly depending<br />
on the occupation. Major differences in wages appear <strong>as</strong><br />
large premiums for employees <strong>of</strong> for-pr<strong>of</strong>it establishments<br />
in business and financial, healthcare practitioner, and construction<br />
and extraction occupations. In contr<strong>as</strong>t, the life,<br />
physical, and social science; legal; and sales occupational<br />
groups all show a sizeable wage premium for the not-for-<br />
Notes<br />
1 Lester M. Salamon and S. Wojciech Sokolowski, “Employment in<br />
America’s Charities: A Pr<strong>of</strong>ile,” Johns Hopkins Center for Civil Society<br />
Studies Nonpr<strong>of</strong>it Employment Bulletin, December 2006, p. 9.<br />
2 Total private employment 2002–2004 w<strong>as</strong> calculated using “Table<br />
1. Total coverage (UI and UCFE) by ownership: Establishments, employment,<br />
and wages, 1997-2006 annual averages,” from the Quarterly<br />
Census <strong>of</strong> Employment and Wages, Bureau <strong>of</strong> Labor Statistics, Sept.<br />
17, 2007, on the Internet at www.bls.gov/cew/ew06table1.pdf (visited<br />
Nov. 24, 2008).<br />
3 “Number <strong>of</strong> Nonpr<strong>of</strong>it Organizations in the United States, 1996<br />
– 2006,” National Center for Charitable Statistics, on the Internet at<br />
http://nccsdataweb.urban.org/PubApps/pr<strong>of</strong>ile1.php?state=US<br />
(visited Nov. 24, 2008).<br />
4 Lester M. Salamon and S. Wojciech Sokolowski, “Nonpr<strong>of</strong>it organizations:<br />
new insights from the QCEW data,” Monthly Labor Review,<br />
September 2005, pp. 21–23.<br />
5 “SOI Tax Stats - Exempt Organizations: IRS M<strong>as</strong>ter File Data,” Internal<br />
Revenue Service, on the Internet at www.irs.gov/taxstats/char-<br />
pr<strong>of</strong>its. Together, these differences in opposite directions<br />
produce similar average wages, though some <strong>of</strong> the variation<br />
can be explained by the low level <strong>of</strong> for-pr<strong>of</strong>it employment<br />
in certain occupations in this industry. Three <strong>of</strong><br />
the four social work occupations had much higher wages<br />
in for-pr<strong>of</strong>its, where<strong>as</strong> other community and social service<br />
occupations earned much lower wages in for-pr<strong>of</strong>its.<br />
Meeting and convention planners and business operations<br />
specialists also earned higher wages in for-pr<strong>of</strong>its.<br />
THIS ARTICLE EXAMINED EMPLOYMENT AND WAGES<br />
in for-pr<strong>of</strong>it and not-for-pr<strong>of</strong>it establishments, using data<br />
from the Occupational Employment Statistics survey and<br />
the IRS Business M<strong>as</strong>ter File, which w<strong>as</strong> used to identify<br />
not-for-pr<strong>of</strong>it establishments that appeared in the<br />
OES sample. This article showed that average wages were<br />
slightly higher in not-for-pr<strong>of</strong>it establishments but that<br />
this is because not-for-pr<strong>of</strong>it organizations generally do<br />
not have the same employment patterns <strong>as</strong> for-pr<strong>of</strong>it businesses,<br />
not because not-for-pr<strong>of</strong>its pay more for the same<br />
work. <strong>The</strong> article demonstrates that, in general, not-forpr<strong>of</strong>it<br />
workers earned less for a given occupation, especially<br />
among the highest paying occupations. Occupational differences<br />
between for-pr<strong>of</strong>it and not-for-pr<strong>of</strong>it establishments<br />
vary greatly from industry to industry, but not-forpr<strong>of</strong>it<br />
establishments on the whole employed many fewer<br />
production, construction, transportation, sales, and food<br />
service workers, yet more scientists, healthcare workers,<br />
community workers, and personal care workers.<br />
itablestats/article/0,,id=97186,00.html (visited Nov. 24, 2008).<br />
6 “Exemption from tax on corporations, certain trusts, etc,” Government<br />
Printing Office, 26 U.S. Code 501, Jan. 3, 2006. Visit www.gpoaccess.gov/uscode<br />
(visited Nov. 24, 2008) and search for 26USC501.<br />
7 Salamon and Sokolowski, “Employment in America’s Charities,”<br />
p. 21.<br />
8 <strong>The</strong> difference is, like all comparisons in the text, statistically significant<br />
at the 90-percent confidence interval for all occupations except for<br />
the arts, design, entertainment, sports, and media occupational group.<br />
9 Salamon and Sokolowski, pp. 24–25.<br />
10 See North American Industry Cl<strong>as</strong>sification System, United States,<br />
2002 (Office <strong>of</strong> Management and Budget), NAICS 622110, p. 820.<br />
Available on the Internet at www.census.gov/eos/www/naics/ (visited<br />
Nov. 24, 2008).<br />
11 Ibid, NAICS 813310, p. 893. Available on the Internet at www.census.gov/eos/www/naics/<br />
(visited Nov. 24, 2008).<br />
Monthly Labor Review • November 2008 23
Not-For-Pr<strong>of</strong>it Sector<br />
Table A–1. For-pr<strong>of</strong>it, not-for-pr<strong>of</strong>it, and government employment and wages, by detailed occupation, 2006<br />
Occupation<br />
See notes at end <strong>of</strong> table.<br />
24 Monthly Labor Review • November 2008<br />
For-pr<strong>of</strong>it Not-for-pr<strong>of</strong>it Govern-<br />
employ- employ- ment<br />
ment ment employ-<br />
ment<br />
Percentage<br />
<strong>of</strong> forpr<strong>of</strong>itemployment<br />
Percentage<br />
<strong>of</strong> not-forpr<strong>of</strong>itemployment<br />
Percentage<br />
<strong>of</strong><br />
governmentemployment<br />
For-pr<strong>of</strong>it Not-for-<br />
Governwage<br />
pr<strong>of</strong>it wage<br />
ment<br />
wage<br />
Chief executives .............................................. 228,750 28,170 45,190 0.23 0.26 0.21 $73.70 $66.26 $49.15<br />
General and operations managers .......... 1,427,710 117,840 124,850 1.41 1.09 .58 48.65 42.78 41.09<br />
Advertising and promotions managers . 33,670 4,090 810 .03 .04 .00 41.82 34.01 32.12<br />
Marketing managers ..................................... 150,130 8,880 2,080 .15 .08 .01 52.46 40.73 37.81<br />
Sales managers ............................................... 306,590 4,320 640 .30 .04 .00 49.26 45.62 36.69<br />
Public relations managers ........................... 22,420 15,630 6,190 .02 .14 .03 50.19 38.78 36.66<br />
Administrative services managers ........... 146,580 34,630 52,910 .14 .32 .25 35.85 33.11 33.64<br />
Computer and information systems<br />
managers...................................................... 210,130 17,270 25,030 .21 .16 .12 53.03 46.27 42.20<br />
Financial managers........................................ 388,550 36,070 48,030 .38 .33 .22 50.14 42.59 40.56<br />
Compensation and benefits managers .. 37,570 5,170 4,180 .04 .05 .02 40.29 36.12 35.03<br />
Training and development managers .... 20,330 3,940 3,330 .02 .04 .02 43.45 38.34 34.05<br />
Human resources managers, all other .... 39,010 6,110 11,160 .04 .06 .05 47.29 41.35 40.63<br />
Industrial production managers ............... 152,810 1,020 1,080 .15 .01 .01 40.40 38.43 36.50<br />
Purch<strong>as</strong>ing managers ................................... 57,230 2,720 7,100 .06 .03 .03 41.28 39.52 41.79<br />
Transportation, storage, and<br />
distribution managers ............................. 73,510 1,090 15,200 .07 .01 .07 37.54 34.67 38.56<br />
Farm, ranch, and other agricultural<br />
managers..................................................... 2,630 160 520 .00 .00 .00 28.39 24.00 28.18<br />
Farmers and ranchers ................................... 230 ( 1 ) 50 .00 ( 1 ) .00 21.91 16.00 17.67<br />
Construction managers ............................... 197,060 1,710 9,770 .19 .02 .05 40.04 38.11 33.91<br />
Education administrators, preschool<br />
and child care center/program ............ 22,520 18,370 6,230 .02 .17 .03 18.48 20.78 29.65<br />
Education administrators, elementary<br />
and secondary school .............................. 8,780 18,500 190,270 .01 .17 .88 65,880 72,610 80,060<br />
Education administrators,<br />
postsecondary ............................................ 8,560 31,840 63,840 .01 .29 .30 33.39 39.51 40.61<br />
Education administrators, all other ......... 7,110 6,290 14,260 .01 .06 .07 30.33 34.20 35.62<br />
Engineering managers ................................. 165,720 3,200 15,940 .16 .03 .07 53.21 54.98 48.52<br />
Food service managers ................................ 175,440 6,630 8,290 .17 .06 .04 22.36 25.13 22.08<br />
Funeral directors ............................................. 22,450 30 390 .02 .00 .00 27.47 25.41 29.47<br />
Gaming managers ......................................... 2,330 80 1,060 .00 .00 .00 32.89 20.51 31.08<br />
Lodging managers ......................................... 30,200 700 590 .03 .01 .00 23.81 23.23 25.11<br />
Medical and health services managers .. 93,810 96,940 42,830 .09 .89 .20 38.05 39.80 39.24<br />
Natural sciences managers ......................... 19,820 4,770 14,190 .02 .04 .07 57.49 51.67 44.07<br />
Property, real estate, and community<br />
<strong>as</strong>sociation managers .............................. 142,200 5,910 9,530 .14 .05 .04 24.82 25.65 28.93<br />
Social and community service<br />
managers...................................................... 17,490 65,800 29,390 .02 .61 .14 26.24 25.77 29.98<br />
Managers, all other ........................................ 181,050 31,210 123,790 .18 .29 .58 44.40 37.37 38.05<br />
Agents and business managers<br />
<strong>of</strong> artists, performers, and athletes ..... 10,330 780 ( 1 ) .01 .01 ( 1 ) 41.37 27.78 40.73<br />
Purch<strong>as</strong>ing agents and buyers,<br />
farm products ............................................. 12,630 250 300 .01 .00 .00 25.99 21.77 20.46<br />
Wholesale and retail buyers,<br />
except farm products.............................. 135,490 1,700 790 .13 .02 .00 24.52 23.62 21.59<br />
Purch<strong>as</strong>ing agents, except wholesale,<br />
retail, and farm products ........................ 218,070 11,730 48,310 .22 .11 .22 25.55 23.45 28.39<br />
Claims adjusters, examiners, and<br />
investigators ................................................ 225,550 6,130 49,130 .22 .06 .23 24.67 22.91 28.60<br />
Insurance appraisers, auto damage ........ 12,660 80 ( 1 ) .01 .00 ( 1 ) 23.91 27.73 20.32<br />
Compliance <strong>of</strong>ficers, except agriculture,<br />
construction, health and safety, and<br />
transportation ............................................ 71,360 8,630 145,560 .07 .08 .68 28.10 25.38 22.48<br />
Cost estimators ............................................... 215,610 880 910 .21 .01 .00 27.30 28.45 26.44<br />
Emergency management specialists ...... 2,730 1,040 7,740 .00 .01 .04 27.29 26.13 22.65<br />
Employment, recruitment,<br />
and placement specialists ...................... 143,560 18,910 24,520 .14 .17 .11 25.07 21.11 20.36<br />
Compensation, benefits, and job<br />
analysis specialists .................................... 73,030 12,430 18,750 .07 .11 .09 26.27 24.39 24.29
Table A–1. Continued—For-pr<strong>of</strong>it, not-for-pr<strong>of</strong>it, and government employment and wages, by detailed occupation, 2006<br />
Occupation<br />
Training and development specialists .... 139,770 30,530 27,580 0.14 0.28 0.13 $24.81 $23.09 $24.66<br />
Human resources, training, and labor<br />
relations specialists, all other ................ 99,390 60,700 46,470 .10 .56 .22 26.61 22.85 29.64<br />
Logisticians ....................................................... 55,550 1,140 23,220 .05 .01 .11 30.81 29.74 33.34<br />
Management analysts .................................. 354,410 20,900 102,060 .35 .19 .47 39.11 35.11 30.63<br />
Meeting and convention planners .......... 27,280 12,690 2,640 .03 .12 .01 21.76 22.51 20.39<br />
Business operations specialists,<br />
all other ......................................................... 540,740 120,400 332,220 .53 1.11 1.54 29.95 24.22 28.67<br />
Accountants and auditors ........................... 899,880 72,650 131,160 .89 .67 .61 29.66 26.05 26.46<br />
Appraisers and <strong>as</strong>sessors <strong>of</strong> real estate .. 38,090 210 28,210 .04 .00 .13 26.78 29.59 21.53<br />
Budget analysts .............................................. 23,310 4,080 31,170 .02 .04 .14 33.27 27.51 29.07<br />
Credit analysts ................................................. 65,510 1,430 210 .06 .01 .00 28.97 24.04 25.01<br />
Financial analysts ........................................... 182,380 8,490 7,270 .18 .08 .03 37.68 30.76 29.23<br />
Personal financial advisors .......................... 115,620 3,220 1,000 .11 .03 .00 42.25 26.71 25.30<br />
Insurance underwriters ................................ 97,040 2,530 650 .10 .02 .00 27.85 25.75 23.48<br />
Financial examiners ....................................... 15,170 390 9,070 .01 .00 .04 31.95 32.00 37.83<br />
Loan counselors .............................................. 21,150 5,650 3,750 .02 .05 .02 20.94 17.92 18.68<br />
Loan <strong>of</strong>ficers ..................................................... 340,400 14,510 5,740 .34 .13 .03 30.06 22.21 28.50<br />
Tax preparers ................................................... 62,660 210 70 .06 .00 .00 15.94 13.38 16.41<br />
Financial specialists, all other ..................... 83,210 8,980 29,330 .08 .08 .14 29.43 23.94 27.56<br />
Computer and information scientists,<br />
research........................................................ 19,810 1,810 6,040 .02 .02 .03 48.40 42.92 40.69<br />
Computer programmers ............................. 352,860 16,040 28,950 .35 .15 .13 34.04 29.94 26.70<br />
Computer s<strong>of</strong>tware engineers,<br />
applications ................................................. 440,360 13,460 19,310 .43 .12 .09 39.87 36.08 31.07<br />
Computer s<strong>of</strong>tware engineers,<br />
systems s<strong>of</strong>tware ....................................... 318,640 6,310 4,490 .31 .06 .02 42.03 42.38 34.00<br />
Computer support specialists ................... 397,810 39,010 80,050 .39 .36 .37 21.68 20.05 19.97<br />
Computer systems analysts ........................ 370,550 26,470 51,050 .37 .24 .24 35.64 31.88 29.24<br />
Datab<strong>as</strong>e administrators ............................. 86,750 10,890 12,520 .09 .10 .06 33.48 28.38 28.46<br />
Network and computer systems<br />
administrators ............................................ 230,740 24,470 35,050 .23 .23 .16 32.11 29.51 27.62<br />
Network systems and data<br />
communications analysts...................... 170,260 13,850 20,040 .17 .13 .09 33.15 30.39 27.47<br />
Computer specialists, all other .................. 94,550 5,830 81,240 .09 .05 .38 32.19 28.08 34.93<br />
Actuaries ............................................................ 15,460 480 760 .02 .00 .00 44.51 39.12 38.56<br />
Mathematicians .............................................. 1,150 220 1,470 .00 .00 .01 44.02 46.56 39.19<br />
Operations research analysts ..................... 42,760 3,500 9,970 .04 .03 .05 33.07 33.20 33.81<br />
Statisticians ...................................................... 9,100 2,600 8,240 .01 .02 .04 34.20 31.41 32.06<br />
Mathematical technicians ........................... 590 170 450 .00 .00 .00 26.40 22.18 16.45<br />
Mathematical scientists, all other ............. 9,460 250 480 .01 .00 .00 31.81 27.68 21.20<br />
Architects, except landscape and naval . 96,150 470 4,790 .09 .00 .02 33.43 35.25 34.82<br />
Landscape architects .................................... 19,970 90 2,110 .02 .00 .01 29.04 30.35 29.14<br />
Cartographers and photogrammetrists . 7,090 210 4,180 .01 .00 .02 24.75 21.69 26.26<br />
Surveyors........................................................... 51,690 300 5,120 .05 .00 .02 24.47 29.00 26.36<br />
Aerospace engineers .................................... 74,850 ( 1 ) ( 1 ) .00 ( 1 ) ( 1 ) 42.07 ( 1 ) 46.38<br />
Agricultural engineers .................................. 2,130 180 770 .00 .00 .00 32.84 33.30 31.40<br />
Biomedical engineers ................................... 11,100 2,010 940 .01 .02 .00 39.39 29.35 32.60<br />
Chemical engineers ....................................... 26,870 650 1,840 .03 .01 .01 39.37 43.08 34.67<br />
Civil engineers ................................................. 169,980 1,030 68,270 .17 .01 .32 35.31 33.28 32.73<br />
Computer hardware engineers ................. 68,870 1,440 4,340 .07 .01 .02 44.22 34.08 41.44<br />
Electrical engineers ....................................... 136,950 4,060 7,200 .14 .04 .03 37.99 37.98 36.08<br />
Electronics engineers, except<br />
computer ...................................................... 112,330 1,930 18,130 .11 .02 .08 39.38 42.71 41.89<br />
Environmental engineers ............................ 34,650 1,910 15,040 .03 .02 .07 35.61 39.64 32.60<br />
Health and safety engineers, except<br />
mining safety engineers and<br />
inspectors ..................................................... 20,720 780 3,210 .02 .01 .01 33.24 29.21 31.41<br />
Industrial engineers ...................................... 195,970 1,940 2,150 .19 .02 .01 33.90 34.53 34.63<br />
Marine engineers and naval architects .. 6,530 330 960 .01 .00 .00 35.53 30.70 42.95<br />
See notes at end <strong>of</strong> table.<br />
For-pr<strong>of</strong>it Not-for-pr<strong>of</strong>it Govern-<br />
employ- employ- ment<br />
ment ment employ-<br />
ment<br />
Percentage<br />
<strong>of</strong> forpr<strong>of</strong>itemployment<br />
Percentage<br />
<strong>of</strong> not-forpr<strong>of</strong>itemployment<br />
Percentage<br />
<strong>of</strong><br />
governmentemployment<br />
For-pr<strong>of</strong>it Not-for-<br />
Governwage<br />
pr<strong>of</strong>it wage<br />
ment<br />
- wage<br />
Monthly Labor Review • November 2008 25
Not-For-Pr<strong>of</strong>it Sector<br />
Table A–1. Continued—For-pr<strong>of</strong>it, not-for-pr<strong>of</strong>it, and government employment and wages, by detailed occupation, 2006<br />
Occupation<br />
Materials engineers ....................................... 19,030 370 1,860 0.02 0.00 0.01 $36.03 $36.00 $41.55<br />
Mechanical engineers .................................. 203,730 2,180 12,120 .20 .02 .06 34.67 38.53 37.70<br />
Mining and geological engineers,<br />
including mining safety engineers ..... 6,320 ( 1 ) 480 .01 ( 1 ) .00 37.56 35.11 34.24<br />
Nuclear engineers .......................................... 11,650 580 2,650 .01 .01 .01 45.14 44.43 40.29<br />
Petroleum engineers..................................... 14,630 30 410 .00 .00 .00 49.15 42.94 38.18<br />
Engineers, all other ........................................ 122,970 4,460 29,930 .12 .04 .14 38.40 39.96 42.11<br />
Architectural and civil drafters .................. 103,680 320 4,160 .10 .00 .02 20.97 21.77 22.19<br />
Electrical and electronics drafters ............ 31,910 420 220 .03 .00 .00 23.88 21.64 22.68<br />
Mechanical drafters ....................................... 72,590 260 330 .07 .00 .00 22.07 25.60 21.15<br />
Drafters, all other ............................................ 21,050 530 1,450 .02 .00 .01 21.87 24.26 19.40<br />
Aerospace engineering and operations<br />
technicians ................................................... 7,890 ( 1 ) ( 1 ) .00 ( 1 ) ( 1 ) 25.92 ( 1 ) 20.56<br />
Civil engineering technicians .................... 48,590 500 38,190 .05 .00 .18 20.76 21.63 19.76<br />
Electrical and electronic engineering<br />
technicians ................................................... 142,350 3,430 22,060 .14 .03 .10 23.75 23.78 28.43<br />
Electro–mechanical technicians ............... 14,520 390 440 .01 .00 .00 22.40 25.26 18.94<br />
Environmental engineering technicians 16,660 590 3,520 .02 .01 .02 20.31 22.78 21.92<br />
Industrial engineering technicians .......... 72,420 550 1,330 .07 .01 .01 24.40 25.55 27.44<br />
Mechanical engineering technicians ...... 45,120 800 890 .04 .01 .00 22.86 24.36 24.83<br />
Engineering technicians, except,<br />
drafters all other ........................................ 53,310 1,420 24,310 .05 .01 .11 25.10 22.94 27.41<br />
Surveying and mapping technicians ...... 58,720 1,220 11,270 .06 .01 .05 16.06 20.50 19.02<br />
Animal scientists ............................................. 840 170 2,920 .00 .00 .01 28.70 27.56 24.58<br />
Food scientists and technologists ............ 7,380 620 820 .01 .01 .00 28.27 32.19 27.15<br />
Soil and plant scientists ............................... 5,100 810 5,210 .01 .01 .02 29.29 25.32 27.35<br />
Biochemists and biophysicists .................. 14,420 2,630 1,650 .01 .02 .01 40.84 37.69 23.54<br />
Microbiologists ............................................... 7,990 2,240 5,760 .01 .02 .03 30.26 33.03 31.73<br />
Zoologists and wildlife biologists ............ 3,990 2,240 11,790 .00 .02 .05 28.29 25.44 26.82<br />
Biological scientists, all other ..................... 5,690 1,870 18,000 .01 .02 .08 33.68 28.95 29.52<br />
Conservation scientists ................................ 990 1,260 13,820 .00 .01 .06 24.94 27.00 26.73<br />
Foresters ............................................................ 3,840 120 6,820 .00 .00 .03 26.83 24.09 24.32<br />
Epidemiologists .............................................. 540 810 2,800 .00 .01 .01 34.75 33.81 26.34<br />
Medical scientists, except<br />
epidemiologists ......................................... 38,540 19,950 19,890 .04 .18 .09 38.78 31.47 26.47<br />
Life scientists, all other ................................. 6,810 2,570 3,790 .01 .02 .02 33.50 27.59 28.26<br />
Astronomers .................................................... 100 360 960 .00 .00 .00 48.71 43.53 46.15<br />
Physicists ........................................................... 6,830 3,730 4,860 .01 .03 .02 47.20 48.06 42.57<br />
Atmospheric and space scientists ............ 3,390 1,220 3,670 .00 .01 .02 32.93 43.39 39.56<br />
Chemists ............................................................ 67,790 2,610 12,470 .07 .02 .06 31.06 32.10 33.70<br />
Materials scientists......................................... 8,360 560 470 .01 .01 .00 37.30 39.14 29.57<br />
Environmental scientists and<br />
specialists, including health .................. 38,040 3,360 37,060 .04 .03 .17 31.02 31.71 27.25<br />
Geoscientists, except hydrologists and<br />
geographers ................................................ 22,390 360 6,280 .02 .00 .03 40.07 35.92 32.55<br />
Hydrologists ..................................................... 3,860 80 3,810 .00 .00 .02 33.20 44.19 32.14<br />
Physical scientists, all other ........................ 8,080 2,280 11,380 .01 .02 .05 43.86 35.29 39.51<br />
Economists ....................................................... 3,770 1,690 7,620 .00 .02 .04 43.86 41.19 37.75<br />
Market research analysts ............................. 196,040 14,130 4,210 .19 .13 .02 32.14 26.09 28.10<br />
Survey researchers ......................................... 19,850 2,160 2,280 .02 .02 .01 18.26 19.73 25.18<br />
Clinical, counseling, and school<br />
psychologists .............................................. 21,660 23,390 52,600 .02 .22 .24 37.48 28.33 30.90<br />
Industrial–organizational psychologists 750 250 150 .00 .00 .00 47.51 38.19 30.09<br />
Psychologists, all other ................................. 2,010 1,210 4,800 .00 .01 .02 45.90 38.70 35.39<br />
Sociologists ...................................................... 700 1,760 980 .00 .02 .00 33.64 36.23 26.09<br />
Urban and regional planners ..................... 6,480 420 25,800 .01 .00 .12 32.13 27.47 27.38<br />
Anthropologists and archeologists ......... 2,820 280 1,890 .00 .00 .01 23.78 23.73 28.07<br />
Geographers .................................................... 210 50 710 .00 .00 .00 29.36 21.87 31.44<br />
Historians .......................................................... 730 370 2,000 .00 .00 .01 27.38 22.69 25.10<br />
Political scientists ........................................... 770 680 2,520 .00 .01 .01 28.67 40.67 45.66<br />
See notes at end <strong>of</strong> table.<br />
26 Monthly Labor Review • November 2008<br />
For-pr<strong>of</strong>it Not-for-pr<strong>of</strong>it Govern-<br />
employ- employ- ment<br />
ment ment employ-<br />
ment<br />
Percentage<br />
<strong>of</strong> forpr<strong>of</strong>itemployment<br />
Percentage<br />
<strong>of</strong> not-forpr<strong>of</strong>itemployment<br />
Percentage<br />
<strong>of</strong><br />
governmentemployment<br />
For-pr<strong>of</strong>it Not-for-<br />
Governwage<br />
pr<strong>of</strong>it wage<br />
ment<br />
wage
Table A–1. Continued—For-pr<strong>of</strong>it, not-for-pr<strong>of</strong>it, and government employment and wages, by detailed occupation, 2006<br />
Occupation<br />
Social scientists and related workers,<br />
all other ......................................................... 9,080 4,880 17,470 0.01 0.04 0.08 $33.47 $34.55 $31.29<br />
Agricultural and food science<br />
technicians ................................................... 10,380 1,730 7,210 .01 .02 .03 16.23 16.78 15.94<br />
Biological technicians ................................... 28,180 18,340 25,530 .03 .17 .12 19.60 18.89 16.57<br />
Chemical technicians .................................... 56,620 2,050 2,420 .06 .02 .01 19.69 18.47 19.06<br />
Geological and petroleum technicians .. 10,790 60 430 .01 .00 .00 25.03 18.63 18.74<br />
Nuclear technicians ....................................... 5,990 320 100 .01 .00 .00 31.31 30.22 23.80<br />
Social science research <strong>as</strong>sistants ............ 5,160 5,770 4,910 .01 .05 .02 18.69 16.50 16.54<br />
Environmental science and protection<br />
technicians, including health ............... 19,310 2,050 13,700 .02 .02 .06 18.77 16.37 20.48<br />
Forensic science technicians ...................... 1,700 220 10,540 .00 .00 .05 24.08 24.12 22.82<br />
Forest and conservation technicians ...... 980 380 29,240 .00 .00 .14 18.14 17.95 16.16<br />
Life, physical, and social science<br />
technicians, all other ............................... 22,730 11,080 25,410 .02 .10 .12 20.53 19.96 18.39<br />
Substance abuse and behavioral<br />
disorder counselors .................................. 18,830 43,520 13,710 .02 .40 .06 17.13 16.63 19.54<br />
Educational, vocational, and school<br />
counselors .................................................... 21,780 45,840 161,300 .02 .42 .75 19.81 19.22 25.70<br />
Marriage and family therapists ................. 6,200 9,080 6,080 .01 .08 .03 20.31 20.09 24.73<br />
Mental health counselors ............................ 23,810 54,330 13,770 .02 .50 .06 18.83 16.87 22.27<br />
Rehabilitation counselors ........................... 23,980 71,700 26,030 .02 .66 .12 16.52 13.92 20.32<br />
Counselors, all other ..................................... 3,580 9,170 11,920 .00 .08 .06 18.26 17.28 20.98<br />
Child, family, and school social<br />
workers .......................................................... 22,230 95,170 149,570 .02 .88 .70 17.56 16.64 21.52<br />
Medical and public health social<br />
workers .......................................................... 35,820 58,820 22,670 .04 .54 .11 21.69 21.14 21.81<br />
Mental health and substance abuse<br />
social workers ............................................. 23,510 67,100 24,450 .02 .62 .11 19.04 17.37 19.87<br />
Social workers, all other ............................... 8,050 20,310 33,980 .01 .19 .16 19.31 18.76 23.61<br />
Health educators ............................................ 10,260 29,170 18,740 .01 .27 .09 21.12 20.23 24.51<br />
Probation <strong>of</strong>ficers and correctional<br />
treatment specialists ............................... 1,720 900 87,880 .00 .01 .41 15.32 14.26 22.31<br />
Social and human service <strong>as</strong>sistants ....... 54,270 167,890 103,070 .05 1.55 .48 12.58 12.13 14.68<br />
Community and social service<br />
specialists, all other ................................... 14,640 45,900 48,640 .01 .42 .23 16.64 16.55 19.51<br />
Clergy ................................................................. 15,050 19,400 3,520 .01 .18 .02 19.91 20.65 24.08<br />
Directors, religious activities and<br />
education ..................................................... 6,890 7,460 420 .01 .07 .00 16.93 18.47 29.33<br />
Religious workers, all other......................... 2,280 3,610 130 .00 .03 .00 13.15 14.48 19.40<br />
Lawyers .............................................................. 418,460 17,210 115,270 .41 .16 .54 58.09 41.08 43.50<br />
Arbitrators, mediators, and conciliators . 2,900 2,620 2,710 .00 .02 .01 27.59 28.07 28.70<br />
Paralegals and legal <strong>as</strong>sistants .................. 191,480 5,160 33,550 .19 .05 .16 21.61 20.37 23.35<br />
Court reporters ............................................... 6,370 ( 1 ) 10,290 .00 ( 1 ) .00 21.31 ( 1 ) 24.55<br />
Law clerks .......................................................... 18,270 370 13,350 .02 .00 .06 18.38 13.98 19.62<br />
Title examiners, abstractors, and<br />
searchers ....................................................... 61,640 220 1,740 .06 .00 .01 19.53 18.60 19.85<br />
Legal support workers, all other ............... 12,920 1,180 24,980 .01 .01 .12 22.59 18.14 25.42<br />
Business teachers, postsecondary ........... 6,020 22,300 39,700 .01 .21 .18 60,110 72,810 69,890<br />
Computer science teachers,<br />
postsecondary ........................................... 4,820 8,030 24,000 .00 .07 .11 58,780 73,950 63,050<br />
Mathematical science teachers,<br />
postsecondary ........................................... 1,660 10,320 32,870 .00 .10 .15 61,290 65,490 61,930<br />
Architecture teachers, postsecondary .... 300 1,810 3,760 .00 .02 .02 64,340 71,870 65,020<br />
Engineering teachers, postsecondary .... 890 7,700 23,580 .00 .07 .11 78,170 87,320 80,200<br />
Agricultural sciences teachers,<br />
postsecondary ............................................ 80 950 9,120 .00 .01 .04 61,480 72,470 77,750<br />
Biological science teachers,<br />
postsecondary ............................................ 880 15,610 35,700 .00 .14 .17 73,770 81,840 82,260<br />
Forestry and conservation science<br />
teachers, postsecondary ........................ ( 1 ) 440 2,170 ( 1 ) .00 .00 ( 1 ) 58,360 68,990<br />
See notes at end <strong>of</strong> table.<br />
For-pr<strong>of</strong>it Not-for-pr<strong>of</strong>it Govern-<br />
employ- employ- ment<br />
ment ment employ-<br />
ment<br />
Percentage<br />
<strong>of</strong> forpr<strong>of</strong>itemployment<br />
Percentage<br />
<strong>of</strong> not-forpr<strong>of</strong>itemployment<br />
Percentage<br />
<strong>of</strong><br />
governmentemployment<br />
For-pr<strong>of</strong>it Not-for-<br />
Governwage<br />
pr<strong>of</strong>it wage<br />
ment<br />
wage<br />
Monthly Labor Review • November 2008 27
Not-For-Pr<strong>of</strong>it Sector<br />
Table A–1. Continued—For-pr<strong>of</strong>it, not-for-pr<strong>of</strong>it, and government employment and wages, by detailed occupation, 2006<br />
Occupation<br />
Atmospheric, earth, marine, and space<br />
sciences teachers, postsecondary ....... 260 1,970 6,480 0.00 0.02 0.03 $73,290 $78,260 $73,890<br />
Chemistry teachers, postsecondary ........ 1,010 6,870 11,840 .00 .06 .06 68,680 72,440 68,680<br />
Environmental science teachers,<br />
postsecondary ............................................ 110 1,650 2,570 .00 .02 .01 60,500 69,490 73,970<br />
Physics teachers, postsecondary .............. 210 4,190 8,000 .00 .04 .04 77,480 78,370 72,500<br />
Anthropology and archeology teachers,<br />
postsecondary ............................................ 70 1,710 3,300 .00 .02 .02 70,240 72,800 65,770<br />
Area, ethnic, and cultural studies<br />
teachers, postsecondary ......................... 180 2,860 4,340 .00 .03 .02 62,920 67,580 61,200<br />
Economics teachers, postsecondary ....... 300 4,340 7,770 .00 .04 .04 72,890 85,730 75,810<br />
Geography teachers, postsecondary ...... 130 780 3,170 .00 .01 .01 60,180 64,710 62,500<br />
Political science teachers, p<br />
ostsecondary............................................... 330 5,030 8,520 .00 .05 .04 71,400 71,750 67,270<br />
Psychology teachers, postsecondary ...... 1,250 10,350 18,190 .00 .10 .08 65,150 66,490 63,380<br />
Sociology teachers, postsecondary ......... 430 5,720 9,990 .00 .05 .05 62,310 67,400 60,730<br />
Social sciences teachers, postsecondary,<br />
all other ........................................................ 430 1,590 3,830 .00 .00 .00 49,620 73,510 70,130<br />
Health specialties teachers,<br />
postsecondary ........................................... 8,720 41,080 68,140 .01 .38 .32 61,590 95,580 91,680<br />
Nursing instructors and teachers,<br />
postsecondary ........................................... 4,090 11,190 24,270 .00 .10 .11 55,420 60,870 58,070<br />
Education teachers, postsecondary ........ 3,740 17,760 32,370 .00 .16 .15 53,090 56,110 58,600<br />
Library science teachers,<br />
postsecondary ............................................ 40 880 2,950 .00 .01 .01 56,630 53,960 58,490<br />
Criminal justice and law enforcement<br />
teachers, postsecondary ......................... 400 2,080 7,960 .00 .02 .04 55,330 53,030 55,880<br />
Law teachers, postsecondary .................... 940 6,240 4,790 .00 .06 .02 71,870 95,680 96,300<br />
Social work teachers, postsecondary ...... 110 2,620 5,170 .00 .02 .02 54,710 59,630 57,190<br />
Art, drama, and music teachers,<br />
postsecondary ............................................ 6,230 29,980 36,120 .01 .28 .17 55,630 59,630 57,500<br />
Communications teachers,<br />
postsecondary ............................................ 1,010 6,790 15,910 .00 .06 .07 52,110 57,510 56,480<br />
English language and literature<br />
teachers, postsecondary ......................... 2,600 15,800 41,220 .00 .15 .19 56,410 59,650 56,430<br />
Foreign language and literature<br />
teachers, postsecondary ......................... 2,290 9,470 13,120 .00 .09 .06 41,180 66,700 58,340<br />
History teachers, postsecondary .............. 550 7,570 12,940 .00 .07 .06 63,760 67,470 60,560<br />
Philosophy and religion teachers,<br />
postsecondary ............................................ 930 10,430 6,570 .00 .10 .03 54,710 59,750 61,520<br />
Graduate teaching <strong>as</strong>sistants ..................... 960 25,550 86,620 .00 .24 .40 28,320 32,600 29,480<br />
Home economics teachers,<br />
postsecondary ............................................ 130 500 3,720 .00 .00 .02 46,500 62,050 60,890<br />
Recreation and fitness studies teachers,<br />
postsecondary ............................................ 1,440 4,370 11,380 .00 .04 .05 47,630 50,130 56,330<br />
Vocational education teachers,<br />
postsecondary ............................................ 43,660 12,880 54,690 .04 .12 .25 20.25 24.61 23.81<br />
Postsecondary teachers, all other ............ 14,570 77,750 182,640 .01 .72 .85 69,280 77,640 70,060<br />
Preschool teachers, except special<br />
education ..................................................... 195,330 119,920 48,640 .19 1.11 .23 10.50 12.45 20.17<br />
Kindergarten teachers, except special<br />
education ..................................................... 11,740 14,550 140,080 .01 .13 .65 32,220 36,730 49,250<br />
Elementary school teachers, except<br />
special education ...................................... 66,520 86,710 1,379,610 .07 .80 6.41 38,520 41,150 49,330<br />
Middle school teachers, except<br />
special and vocational education ........ 19,890 42,800 594,870 .02 .39 2.77 40,950 44,210 49,960<br />
Vocational education teachers, .................<br />
middle school ............................................. 290 1,020 14,550 .00 .01 .07 38,190 40,540 47,180<br />
Secondary school teachers, except<br />
special and vocational education ........ 28,960 76,490 938,890 .03 .70 4.37 46,060 47,250 51,310<br />
See notes at end <strong>of</strong> table.<br />
28 Monthly Labor Review • November 2008<br />
For-pr<strong>of</strong>it Not-for-pr<strong>of</strong>it Govern-<br />
employ- employ- ment<br />
ment ment employ-<br />
ment<br />
Percentage<br />
<strong>of</strong> forpr<strong>of</strong>itemployment<br />
Percentage<br />
<strong>of</strong> not-forpr<strong>of</strong>itemployment<br />
Percentage<br />
<strong>of</strong><br />
governmentemployment<br />
For-pr<strong>of</strong>it Not-for-<br />
Governwage<br />
pr<strong>of</strong>it wage<br />
ment<br />
- wage
Table A–1. Continued—For-pr<strong>of</strong>it, not-for-pr<strong>of</strong>it, and government employment and wages, by detailed occupation, 2006<br />
Occupation<br />
For-pr<strong>of</strong>it Not-for-pr<strong>of</strong>it Govern-<br />
employ- employ- ment<br />
ment ment employ-<br />
ment<br />
Percentage<br />
<strong>of</strong> forpr<strong>of</strong>itemployment<br />
Percentage<br />
<strong>of</strong> not-forpr<strong>of</strong>itemployment<br />
Percentage<br />
<strong>of</strong><br />
governmentemployment<br />
For-pr<strong>of</strong>it Not-for-<br />
Governwage<br />
pr<strong>of</strong>it wage<br />
ment<br />
- wage<br />
Vocational education teachers,<br />
secondary school ...................................... 2,110 2,960 91,940 0.00 0.03 0.43 $52,160 $53,580 $50,500<br />
Special education teachers, preschool,<br />
kindergarten, and elementary<br />
school ........................................................... 7,620 15,410 194,310 .01 .14 .90 43,870 42,410 50,470<br />
Special education teachers, middle<br />
school ............................................................ 1,520 3,890 100,950 .00 .04 .47 44,890 47,290 51,620<br />
Special education teachers, secondary<br />
school ............................................................ 3,930 6,500 126,680 .00 .06 .59 45,200 46,980 52,990<br />
Adult literacy, remedial education, and<br />
GED teachers and instructors .................. 9,710 10,070 52,050 .01 .09 .24 18.18 18.75 23.94<br />
Self–enrichment education teachers ...... 76,520 45,790 27,730 .08 .42 .13 17.44 18.59 21.17<br />
Teachers and instructors, all other ........... 71,610 54,060 456,420 .07 .50 2.12 34,270 35,700 35,410<br />
Archivists ........................................................... 1,050 2,510 1,930 .00 .02 .01 21.58 19.73 23.20<br />
Curators ............................................................. 1,030 5,620 2,900 .00 .05 .01 25.16 23.51 24.58<br />
Museum technicians and<br />
conservators ................................................ 670 4,220 4,960 .00 .04 .02 18.42 17.47 18.94<br />
Librarians ........................................................... 10,370 21,220 118,910 .01 .20 .55 23.97 23.85 24.45<br />
Library technicians ........................................ 5,250 13,980 95,590 .01 .13 .44 14.46 14.19 13.22<br />
Audio–visual collections specialists ........ 350 1,160 5,120 .00 .01 .02 17.01 18.17 20.78<br />
Farm and home management advisors . 1,850 570 10,280 .00 .01 .05 35.63 20.08 20.28<br />
Instructional coordinators .......................... 18,550 21,600 77,970 .02 .20 .36 25.55 23.17 27.91<br />
Teacher <strong>as</strong>sistants .......................................... 114,100 154,720 983,120 .11 1.43 4.57 20,060 21,340 22,130<br />
Education, training, and library<br />
workers, all other ....................................... 4,290 11,940 68,650 .00 .11 .32 17.74 17.84 16.94<br />
Art directors ..................................................... 28,990 1,860 350 .03 .02 .00 38.25 29.59 28.18<br />
Craft artists ....................................................... 4,400 370 140 .00 .00 .00 13.91 10.35 16.44<br />
Fine artists, including painters,<br />
sculptors, and illustrators ....................... 9,940 570 750 .01 .01 .00 22.65 21.16 23.57<br />
Multi–media artists and animators .......... 25,040 690 560 .02 .01 .00 28.11 24.01 22.23<br />
Artists and related workers, all other ...... 4,050 320 3,510 .00 .00 .02 19.37 18.84 28.70<br />
Commercial and industrial designers ..... 33,040 300 230 .03 .00 .00 28.58 25.74 22.43<br />
F<strong>as</strong>hion designers .......................................... 15,370 250 60 .02 .00 .00 33.53 20.91 23.77<br />
Floral designers ............................................... 61,400 120 70 .06 .00 .00 11.05 13.22 16.90<br />
Graphic designers .......................................... 179,020 6,200 6,650 .18 .06 .03 20.97 20.64 22.90<br />
Interior designers ........................................... 52,100 170 320 .05 .00 .00 23.01 23.57 28.48<br />
Merchandise displayers and window<br />
trimmers ....................................................... 62,760 190 30 .06 .00 .00 12.75 13.07 17.80<br />
Set and exhibit designers ............................ 5,620 1,950 770 .01 .02 .00 23.12 18.19 22.58<br />
Designers, all other ........................................ 10,700 410 320 .01 .00 .00 23.28 28.77 23.71<br />
Actors.................................................................. 45,420 6,190 270 .04 .06 .00 22.11 20.10 15.37<br />
Producers and directors ............................... 52,300 8,280 3,590 .05 .08 .02 36.80 24.88 25.66<br />
Athletes and sports competitors .............. 10,840 1,420 250 .01 .01 .00 78,980 44,020 49,270<br />
Coaches and scouts ....................................... 56,750 40,360 57,410 .06 .37 .27 33,390 33,170 33,250<br />
Umpires, referees, and other sports<br />
<strong>of</strong>ficials .......................................................... 5,500 3,000 5,320 .01 .03 .02 28,620 25,300 27,410<br />
Dancers .............................................................. 13,080 3,030 70 .01 .03 .00 13.05 17.01 13.98<br />
Choreographers .............................................. 14,480 1,800 100 .01 .02 .00 18.10 21.16 16.66<br />
Music directors and composers ................ 5,240 4,000 240 .01 .04 .00 26.44 24.53 26.05<br />
Musicians and singers .................................. 22,660 22,870 1,160 .02 .21 .01 26.06 29.38 19.24<br />
Entertainers and performers, sports<br />
and related workers, all other ............... 56,610 1,440 1,450 .06 .01 .01 16.84 17.40 16.11<br />
Radio and television announcers ............. 37,210 2,640 420 .04 .02 .00 17.37 17.10 14.44<br />
Public address system and other<br />
announcers .................................................. 8,110 110 110 .01 .00 .00 16.31 17.15 15.32<br />
Broadc<strong>as</strong>t news analysts .............................. 6,450 330 90 .01 .00 .00 32.44 29.06 18.05<br />
Reporters and correspondents ................. 51,300 1,850 280 .05 .02 .00 20.19 18.61 20.01<br />
Public relations specialists .......................... 117,600 62,790 30,420 .12 .58 .14 26.63 24.68 24.79<br />
Editors ................................................................ 86,170 11,430 2,940 .09 .11 .01 25.75 25.06 21.87<br />
Technical writers ............................................. 42,070 1,650 1,660 .04 .02 .01 29.28 28.54 28.85<br />
Writers and authors ....................................... 33,280 7,320 2,820 .03 .07 .01 28.70 24.13 28.17<br />
Interpreters and translators ........................ 9,730 4,760 16,520 .01 .04 .08 20.15 17.40 18.97<br />
See notes at end <strong>of</strong> table.<br />
Monthly Labor Review • November 2008 29
Not-For-Pr<strong>of</strong>it Sector<br />
Table A–1. Continued—For-pr<strong>of</strong>it, not-for-pr<strong>of</strong>it, and government employment and wages, by detailed occupation, 2006<br />
Occupation<br />
Media and communication workers,<br />
all other ......................................................... 16,010 3,010 4,170 0.02 .03 0.02 $23.11 $21.09 $19.46<br />
Audio and video equipment<br />
technicians .................................................. 30,840 4,150 5,840 .03 .04 .03 19.03 16.57 17.21<br />
Broadc<strong>as</strong>t technicians ................................... 27,180 2,700 2,680 .03 .02 .01 16.63 17.69 19.71<br />
Radio operators .............................................. 470 40 930 .00 .00 .00 17.68 20.08 16.71<br />
Sound engineering technicians ................ 12,970 990 220 .01 .01 .00 24.45 20.16 19.25<br />
Photographers ................................................ 58,280 1,080 1,180 .06 .01 .01 15.09 21.76 19.75<br />
Camera operators, television, video,<br />
and motion picture ................................... 19,970 1,310 1,140 .02 .01 .01 22.50 15.13 23.13<br />
Film and video editors .................................. 16,900 410 130 .02 .00 .00 28.17 18.19 19.76<br />
Media and communication equipment<br />
workers, all other ....................................... 9,460 2,170 6,350 .01 .02 .03 22.58 23.97 30.22<br />
Chiropractors ................................................... 24,870 510 90 .02 .00 .00 39.09 35.93 24.86<br />
Dentists, general ............................................. 80,710 3,260 2,350 .08 .03 .01 68.76 55.55 47.14<br />
Oral and maxill<strong>of</strong>acial surgeons................ 5,030 250 50 .00 .00 .00 80.94 50.56 47.32<br />
Orthodontists .................................................. 5,120 ( 1 ) ( 1 ) .01 ( 1 ) ( 1 ) 85.64 53.80 ( 1 )<br />
Prosthodontists ............................................... 450 ( 1 ) ( 1 ) .00 ( 1 ) ( 1 ) 78.39 47.26 ( 1 )<br />
Dentists, all other specialists ...................... 1,880 200 2,530 .00 .00 .01 74.59 40.17 36.15<br />
Dietitians and nutritionists ......................... 19,780 19,000 12,980 .02 .18 .06 23.22 22.84 22.67<br />
Optometrists .................................................... 22,910 1,040 410 .02 .01 .00 47.47 49.02 31.09<br />
Pharmacists ...................................................... 181,900 41,510 18,220 .18 .38 .08 45.17 44.18 42.73<br />
Anesthesiologists ........................................... 24,420 4,440 1,210 .02 .04 .01 91.74 76.56 64.78<br />
Family and general practitioners .............. 69,750 27,880 12,580 .07 .26 .06 76.00 68.08 56.96<br />
Internists, general .......................................... 34,750 12,450 1,670 .03 .11 .01 81.79 66.30 62.94<br />
Obstetricians and gynecologists .............. 18,010 3,900 650 .02 .04 .00 88.00 78.53 59.79<br />
Pediatricians, general.................................... 19,230 8,390 1,450 .02 .08 .01 70.07 63.47 64.46<br />
Psychiatrists ...................................................... 10,260 8,380 6,170 .01 .08 .03 77.59 70.35 65.11<br />
Surgeons ........................................................... 41,780 8,060 2,140 .04 .07 .01 91.04 79.51 72.79<br />
Physicians and surgeons, all other ........... 99,800 62,410 48,110 .10 .58 .22 84.26 59.60 45.83<br />
Physician <strong>as</strong>sistants ....................................... 39,570 17,430 6,060 .04 .16 .03 35.59 35.90 35.65<br />
Podiatrists ......................................................... 7,640 730 670 .01 .01 .00 58.92 50.73 41.53<br />
Registered nurses ........................................... 829,950 1,164,360 439,300 .82 10.73 2.04 28.34 29.07 27.88<br />
Audiologists ..................................................... 6,920 2,170 1,830 .01 .02 .01 30.21 28.37 27.43<br />
Occupational therapists............................... 40,730 29,160 18,910 .04 .27 .09 31.88 28.93 27.69<br />
Physical therapists ......................................... 91,700 48,910 16,130 .09 .45 .07 33.37 31.98 30.56<br />
Radiation therapists ...................................... 4,150 8,240 1,920 .00 .08 .01 34.86 31.78 30.33<br />
Recreational therapists ................................ 8,420 8,570 7,200 .01 .08 .03 16.11 17.02 19.85<br />
Respiratory therapists................................... 33,350 54,080 12,360 .03 .50 .06 23.32 23.45 22.60<br />
Speech–language pathologists ................ 26,610 18,240 53,950 .03 .17 .25 33.41 29.60 27.06<br />
<strong>The</strong>rapists, all other ....................................... 4,730 5,390 1,590 .00 .05 .01 21.92 20.35 25.14<br />
Veterinarians .................................................... 46,310 1,140 2,380 .05 .01 .01 39.53 33.90 34.55<br />
Health diagnosing and treating<br />
practitioners, all other ............................. 19,480 17,740 16,130 .02 .16 .08 52.94 29.75 35.42<br />
Medical and clinical laboratory<br />
technologists .............................................. 55,940 81,320 27,110 .06 .75 .13 23.86 24.20 23.99<br />
Medical and clinical laboratory<br />
technicians ................................................... 63,480 59,570 22,180 .06 .55 .10 15.90 17.20 17.13<br />
Dental hygienists ............................................ 162,610 2,310 1,570 .16 .02 .01 30.11 27.13 23.32<br />
Cardiov<strong>as</strong>cular technologists<br />
and technicians .......................................... 14,010 24,920 5,210 .01 .23 .02 21.65 20.94 20.20<br />
Diagnostic medical sonographers ........... 20,140 20,330 4,080 .02 .19 .02 27.89 27.99 27.09<br />
Nuclear medicine technologists ............... 7,460 10,000 1,940 .01 .09 .01 30.70 30.16 28.58<br />
Radiologic technologists and<br />
technicians ................................................... 81,230 87,830 22,720 .08 .81 .11 23.25 24.06 23.09<br />
Emergency medical technicians and<br />
paramedics .................................................. 76,080 49,380 73,080 .08 .46 .34 13.15 13.76 15.23<br />
Dietetic technicians ....................................... 8,540 11,440 4,560 .01 .11 .02 11.85 12.99 12.64<br />
Pharmacy technicians .................................. 230,410 38,300 15,680 .23 .35 .07 12.29 14.34 15.10<br />
See notes at end <strong>of</strong> table.<br />
30 Monthly Labor Review • November 2008<br />
For-pr<strong>of</strong>it Not-for-pr<strong>of</strong>it Govern-<br />
employ- employ- ment<br />
ment ment employ-<br />
ment<br />
Percentage<br />
<strong>of</strong> forpr<strong>of</strong>itemployment<br />
Percentage<br />
<strong>of</strong> not-forpr<strong>of</strong>itemployment<br />
Percentage<br />
<strong>of</strong><br />
governmentemployment<br />
For-pr<strong>of</strong>it Not-for-<br />
Governwage<br />
pr<strong>of</strong>it wage<br />
ment<br />
wage
Table A–1. Continued—For-pr<strong>of</strong>it, not-for-pr<strong>of</strong>it, and government employment and wages, by detailed occupation, 2006<br />
Occupation<br />
Psychiatric technicians ................................. 15,120 13,620 30,340 0.01 0.13 0.14 $12.90 $13.27 $16.11<br />
Respiratory therapy technicians ............... 5,360 10,490 3,300 .01 .10 .02 18.62 19.44 17.86<br />
Surgical technologists .................................. 31,630 43,180 10,220 .03 .40 .05 18.20 18.00 16.44<br />
Veterinary technologists and<br />
technicians ................................................... 65,350 1,930 2,560 .06 .02 .01 13.15 15.03 16.92<br />
Licensed practical and licensed<br />
vocational nurses ...................................... 419,690 212,350 96,550 .41 1.96 .45 18.28 17.78 16.77<br />
Medical records and health<br />
information technicians .......................... 80,470 63,590 21,710 .08 .59 .10 13.66 14.89 16.12<br />
Opticians, dispensing ................................... 64,490 1,180 130 .06 .01 .00 15.41 17.49 16.01<br />
Orthotists and prosthetists ......................... 4,100 630 590 .00 .01 .00 30.83 24.29 28.68<br />
Health technologists and technicians,<br />
all other ......................................................... 33,360 28,890 10,360 .03 .27 .05 17.64 18.77 19.46<br />
Occupational health and safety<br />
specialists ..................................................... 19,130 3,300 20,160 .02 .03 .09 29.23 28.78 27.60<br />
Occupational health and safety<br />
technicians ................................................... 5,710 1,330 3,020 .01 .01 .01 22.32 18.40 20.64<br />
Athletic trainers .............................................. 7,370 4,470 3,620 .01 .04 .02 36,890 38,520 43,250<br />
Healthcare practitioners and technical<br />
workers, all other ....................................... 21,040 19,150 10,650 .02 .18 .05 20.65 20.83 25.18<br />
Home health aides ......................................... 471,040 245,180 36,690 .46 2.26 .17 9.27 9.97 12.45<br />
Nursing aides, orderlies, and<br />
attendants .................................................... 727,130 499,070 152,340 .72 4.60 .71 10.58 11.47 11.79<br />
Psychiatric aides ............................................. 13,110 12,260 31,910 .01 .11 .15 10.52 11.36 12.84<br />
Occupational therapist <strong>as</strong>sistants ............ 12,950 7,550 3,250 .01 .07 .02 21.20 18.90 19.43<br />
Occupational therapist aides ..................... 3,810 2,630 1,370 .00 .02 .01 13.62 12.40 14.35<br />
Physical therapist <strong>as</strong>sistants ....................... 38,510 16,940 4,320 .04 .16 .02 20.08 19.37 19.47<br />
Physical therapist aides ................................ 31,770 10,690 3,110 .03 .10 .01 11.11 11.79 10.03<br />
M<strong>as</strong>sage therapists ........................................ 40,140 1,590 390 .04 .01 .00 18.83 20.21 19.72<br />
Dental <strong>as</strong>sistants ............................................. 266,370 6,400 7,190 .26 .06 .03 14.76 14.06 15.30<br />
Medical <strong>as</strong>sistants .......................................... 315,340 75,720 19,060 .31 .70 .09 12.88 13.52 14.46<br />
Medical equipment preparers ................... 13,910 24,040 4,910 .01 .22 .02 12.78 13.15 12.51<br />
Medical transcriptionists ............................. 46,580 33,670 6,710 .05 .31 .03 14.61 15.00 14.22<br />
Pharmacy aides ............................................... 46,080 3,070 930 .05 .03 .00 9.75 12.20 12.18<br />
Veterinary <strong>as</strong>sistants and laboratory<br />
animal caretakers ...................................... 64,210 3,760 2,540 .06 .03 .01 9.88 12.23 12.98<br />
Healthcare support workers, all other .... 81,870 71,260 33,830 .08 .66 .16 13.05 13.43 14.86<br />
First–line supervisors/managers<br />
<strong>of</strong> correctional <strong>of</strong>ficers ............................. 1,060 80 36,410 .00 .00 .17 20.78 21.78 26.40<br />
First–line supervisors/managers<br />
<strong>of</strong> police and detectives .......................... 30 510 91,530 .00 .00 .43 28.27 31.34 33.20<br />
First–line supervisors/managers<br />
<strong>of</strong> fire fighting and prevention<br />
workers .......................................................... 580 200 50,370 .00 .00 .23 26.81 21.06 31.26<br />
First–line supervisors/managers,<br />
protective service workers,<br />
all other ......................................................... 31,110 4,320 10,840 .03 .04 .05 20.20 21.64 27.39<br />
Fire fighters ....................................................... 5,290 2,630 277,940 .01 .02 1.29 16.84 13.34 20.44<br />
Fire inspectors and investigators .............. 1,280 60 12,120 .00 .00 .06 22.20 21.77 24.13<br />
Forest fire inspectors and prevention<br />
specialists ..................................................... 30 ( 1 ) 1,680 .00 ( 1 ) .00 14.08 ( 1 ) 17.28<br />
Correctional <strong>of</strong>ficers and jailers................. 15,110 960 409,010 .01 .01 1.90 13.56 12.70 18.48<br />
Detectives and criminal investigators .... ( 1 ) 60 ( 1 ) ( 1 ) .00 ( 1 ) ( 1 ) 30.40 ( 1 )<br />
Parking enforcement workers ................... 330 290 9,500 .00 .00 .04 14.70 10.81 15.16<br />
Police and sheriff’s patrol <strong>of</strong>ficers............. 230 3,640 642,600 .00 .03 2.99 20.22 21.45 22.93<br />
Transit and railroad police........................... ( 1 ) ( 1 ) 3,870 ( 1 ) ( 1 ) .00 23.81 ( 1 ) 23.74<br />
Animal control workers ................................ 80 1,470 13,070 .00 .01 .06 13.88 12.37 14.31<br />
Private detectives and investigators ....... 31,810 560 3,730 .03 .01 .02 17.91 24.29 21.51<br />
Gaming surveillance <strong>of</strong>ficers<br />
and gaming investigators ...................... 4,070 50 4,520 .00 .00 .02 13.64 14.55 15.42<br />
See notes at end <strong>of</strong> table.<br />
For-pr<strong>of</strong>it Not-for-pr<strong>of</strong>it Govern-<br />
employ- employ- ment<br />
ment ment employ-<br />
ment<br />
Percentage<br />
<strong>of</strong> forpr<strong>of</strong>itemployment<br />
Percentage<br />
<strong>of</strong> not-forpr<strong>of</strong>itemployment<br />
Percentage<br />
<strong>of</strong><br />
governmentemployment<br />
For-pr<strong>of</strong>it Not-for-<br />
Governwage<br />
pr<strong>of</strong>it wage<br />
ment<br />
wage<br />
Monthly Labor Review • November 2008 31
Not-For-Pr<strong>of</strong>it Sector<br />
Table A–1. Continued—For-pr<strong>of</strong>it, not-for-pr<strong>of</strong>it, and government employment and wages, by detailed occupation, 2006<br />
Occupation<br />
Security guards ............................................... 863,230 70,590 100,000 0.85 0.65 0.46 $10.86 $12.39 $13.54<br />
Crossing guards .............................................. 10,870 310 56,630 .01 .00 .26 12.08 12.36 10.43<br />
Lifeguards, ski patrol, and other<br />
recreational protective service<br />
workers .......................................................... 29,820 34,340 45,040 .03 .32 .21 8.72 8.31 9.34<br />
Protective service workers, all other ....... 27,180 3,820 51,140 .03 .04 .24 12.53 13.48 15.71<br />
Chefs and head cooks ................................... 96,120 4,770 3,840 .09 .04 .02 17.78 22.49 22.84<br />
First–line supervisors/managers<br />
<strong>of</strong> food preparation and serving<br />
workers .......................................................... 692,580 26,910 55,840 .68 .25 .26 13.77 15.32 14.20<br />
Cooks, f<strong>as</strong>t food .............................................. 619,950 ( 1 ) ( 1 ) .61 ( 1 ) ( 1 ) 7.64 8.94 ( 1 )<br />
Cooks, institution and cafeteria ................ 149,180 72,160 159,120 .15 .67 .74 10.19 10.80 9.99<br />
Cooks, private household............................ 500 390 ( 1 ) .00 .00 ( 1 ) 15.38 11.53 9.98<br />
Cooks, restaurant............................................ 813,950 12,800 3,250 .80 .12 .02 10.07 11.60 10.59<br />
Cooks, short order .......................................... 183,450 6,300 540 .18 .06 .00 8.97 9.56 9.74<br />
Cooks, all other ................................................ 11,500 1,330 110 .01 .01 .00 11.47 10.19 11.70<br />
Food preparation workers .......................... 718,420 67,840 100,860 .71 .63 .47 8.69 9.50 9.62<br />
Bartenders ........................................................ 433,670 49,990 3,670 .43 .46 .02 8.98 8.30 8.74<br />
Combined food preparation and<br />
serving workers, including f<strong>as</strong>t food .. 2,283,990 42,830 146,240 2.25 .39 .68 7.51 9.15 9.50<br />
Counter attendants, cafeteria,<br />
food concession, and c<strong>of</strong>fee shop ....... 479,820 14,580 36,510 .47 .13 .17 8.01 9.13 9.21<br />
Waiters and waitresses ................................. 2,261,080 54,460 9,120 2.23 .50 .04 8.23 9.31 8.39<br />
Food servers, nonrestaurant ...................... 126,550 47,790 10,170 .12 .44 .05 9.32 9.65 10.45<br />
Dining room and cafeteria attendants<br />
and bartender helpers ............................. 362,300 20,150 20,700 .36 .19 .10 7.75 8.51 8.82<br />
Dishw<strong>as</strong>hers ..................................................... 477,930 21,130 6,170 .47 .19 .03 7.75 8.37 8.11<br />
Hosts and hostesses, restaurant,<br />
lounge, and c<strong>of</strong>fee shop ......................... 336,140 3,790 2,030 .33 .03 .01 8.07 9.95 8.91<br />
Food preparation and serving related<br />
workers, all other ....................................... 45,230 4,550 5,620 .04 .04 .03 9.10 10.15 10.12<br />
First–line supervisors/managers<br />
<strong>of</strong> housekeeping and janitorial<br />
workers .......................................................... 122,090 20,610 41,870 .12 .19 .19 15.33 16.93 17.93<br />
First–line supervisors/managers<br />
<strong>of</strong> landscaping, lawn service,<br />
and groundskeeping workers ............... 87,030 7,750 16,940 .09 .07 .08 18.82 21.34 20.84<br />
Janitors and cleaners, except maids<br />
and housekeeping cleaners .................. 1,449,300 172,700 536,320 1.43 1.59 2.49 9.68 10.65 12.25<br />
Maids and housekeeping cleaners .......... 729,880 141,370 34,170 .72 1.30 .16 8.76 9.96 9.66<br />
Building cleaning workers, all other ........ 12,240 ( 1 ) ( 1 ) .01 ( 1 ) ( 1 ) 13.01 10.77 ( 1 )<br />
Pest control workers ...................................... 61,260 ( 1 ) ( 1 ) .00 ( 1 ) ( 1 ) 14.03 ( 1 ) 14.67<br />
Landscaping and groundskeeping<br />
workers .......................................................... 739,780 65,120 126,850 .73 .60 .59 10.70 11.11 12.91<br />
Pesticide handlers, sprayers,<br />
and applicators, vegetation ................... 22,360 340 3,230 .02 .00 .02 13.52 14.84 15.00<br />
Tree trimmers and pruners ......................... 24,380 360 3,920 .02 .00 .02 13.99 16.96 16.37<br />
Grounds maintenance workers,<br />
all other ......................................................... 13,250 1,200 7,650 .01 .01 .04 11.84 10.06 11.87<br />
Gaming supervisors ...................................... 17,040 590 6,460 .02 .01 .03 20.86 15.65 19.37<br />
Slot key persons .............................................. 7,060 60 6,440 .01 .00 .03 12.56 12.09 11.69<br />
First–line supervisors/managers<br />
<strong>of</strong> personal service workers ................... 78,910 30,410 17,220 .08 .28 .08 17.00 16.26 20.47<br />
Animal trainers ................................................ 9,250 700 90 .01 .01 .00 14.17 16.82 16.93<br />
Nonfarm animal caretakers ........................ 87,420 16,120 4,880 .09 .15 .02 9.47 10.00 13.15<br />
Gaming dealers ............................................... 61,160 1,250 21,260 .06 .01 .10 7.78 10.56 9.14<br />
Gaming and sports book writers<br />
and runners ................................................. 9,990 3,760 4,070 .01 .03 .02 9.85 9.14 11.25<br />
Gaming service workers, all other ............ 7,920 380 6,150 .01 .00 .03 12.10 10.04 11.02<br />
See notes at end <strong>of</strong> table.<br />
32 Monthly Labor Review • November 2008<br />
For-pr<strong>of</strong>it Not-for-pr<strong>of</strong>it Govern-<br />
employ- employ- ment<br />
ment ment employ-<br />
ment<br />
Percentage<br />
<strong>of</strong> forpr<strong>of</strong>itemployment<br />
Percentage<br />
<strong>of</strong> not-forpr<strong>of</strong>itemployment<br />
Percentage<br />
<strong>of</strong><br />
governmentemployment<br />
For-pr<strong>of</strong>it Not-for-<br />
Governwage<br />
pr<strong>of</strong>it wage<br />
ment<br />
wage
Table A–1. Continued—For-pr<strong>of</strong>it, not-for-pr<strong>of</strong>it, and government employment and wages, by detailed occupation, 2006<br />
Occupation<br />
Motion picture projectionists .................... 10,370 360 ( 1 ) 0.01 0.00 ( 1 ) $9.58 $11.68 $15.04<br />
Ushers, lobby attendants,<br />
and ticket takers ........................................ 88,650 9,600 4,440 .09 .09 .02 8.24 9.34 9.26<br />
Amusement and recreation<br />
attendants .................................................... 164,180 24,950 47,270 .16 .23 .22 8.15 8.44 9.37<br />
Costume attendants ..................................... 2,630 1,190 330 .00 .01 .00 14.44 14.11 12.61<br />
Locker room, coatroom, and dressing<br />
room attendants ........................................ 14,120 3,850 860 .01 .04 .00 9.33 9.93 10.29<br />
Entertainment attendants<br />
and related workers, all other ............... (1) 5,630 ( 1 ) ( 1 ) .00 ( 1 ) ( 1 ) 8.36 10.59<br />
Embalmers ........................................................ 8,780 80 ( 1 ) .01 .00 ( 1 ) 19.44 18.07 17.95<br />
Funeral attendants......................................... 32,620 90 ( 1 ) .03 .00 ( 1 ) 10.52 12.95 ( 1 )<br />
Barbers ............................................................... 11,360 50 180 .01 .00 .00 12.68 13.00 15.67<br />
Hairdressers, hairstylists,<br />
and cosmetologists .................................. 345,940 990 360 .34 .01 .00 11.78 12.08 12.93<br />
Makeup artists, theatrical<br />
and performance ....................................... 1,080 190 ( 1 ) .00 .00 ( 1 ) 16.98 21.43 ( 1 )<br />
Manicurists and pedicurists........................ 47,640 ( 1 ) ( 1 ) .05 ( 1 ) ( 1 ) 10.22 11.78 ( 1 )<br />
Shampooers ..................................................... 15,660 ( 1 ) ( 1 ) .00 ( 1 ) ( 1 ) 8.19 ( 1 ) ( 1 )<br />
Skin care specialists ....................................... 23,080 110 ( 1 ) .02 .00 ( 1 ) 14.06 15.79 16.50<br />
Baggage porters and bellhops .................. 47,330 400 1,110 .05 .00 .01 10.33 10.26 11.08<br />
Concierges ........................................................ 18,040 620 740 .02 .01 .00 12.62 11.08 10.08<br />
Tour guides and escorts ............................... 16,640 11,150 3,040 .02 .10 .01 11.02 9.72 12.56<br />
Travel guides .................................................... 3,100 120 60 .00 .00 .00 14.92 12.93 11.17<br />
Flight attendants ............................................ 96,940 ( 1 ) ( 1 ) .00 ( 1 ) ( 1 ) ( 1 ) ( 1 ) ( 1 )<br />
Transportation attendants,<br />
except flight attendants<br />
and baggage porters ............................... 16,490 370 4,340 .02 .00 .02 10.00 9.72 10.57<br />
Child care workers ......................................... 272,180 175,890 127,020 .27 1.62 .59 8.39 9.23 10.15<br />
Personal and home care aides ................... 370,210 193,230 19,010 .37 1.78 .09 8.28 9.45 9.85<br />
Fitness trainers and aerobics<br />
instructors .................................................... 149,740 48,730 8,040 .15 .45 .04 15.70 13.95 14.07<br />
Recreation workers ........................................ 76,200 83,070 115,720 .08 .77 .54 10.73 10.44 11.62<br />
Residential advisors ....................................... 8,980 27,800 11,760 .01 .26 .05 11.48 11.39 12.95<br />
Personal care and service workers,<br />
all other ......................................................... 38,770 10,870 9,190 .04 .10 .04 10.18 10.39 11.24<br />
First–line supervisors/managers<br />
<strong>of</strong> retail sales workers ............................... 1,107,610 9,760 7,300 1.09 .09 .03 18.62 16.34 18.98<br />
First–line supervisors/managers<br />
<strong>of</strong> non–retail sales workers .................... 269,790 3,400 14,450 .27 .03 .07 37.35 31.43 28.29<br />
C<strong>as</strong>hiers .............................................................. 3,429,260 37,620 44,370 3.38 .35 .21 8.55 9.50 12.11<br />
Gaming change persons<br />
and booth c<strong>as</strong>hiers ................................... 18,820 460 7,660 .02 .00 .04 10.53 9.72 9.79<br />
Counter and rental clerks ............................ 465,360 4,980 1,080 .46 .05 .01 11.21 10.13 11.39<br />
Parts salespersons .......................................... 236,960 40 40 .23 .00 .00 14.37 18.75 16.55<br />
Retail salespersons ........................................ 4,376,750 30,980 13,220 4.32 .29 .06 11.48 9.69 11.66<br />
Advertising sales agents .............................. 156,990 2,900 180 .15 .03 .00 24.68 24.75 16.71<br />
Insurance sales agents ................................. 307,360 ( 1 ) ( 1 ) .30 ( 1 ) ( 1 ) 28.08 27.39 ( 1 )<br />
Securities, commodities, and financial<br />
services sales agents ................................ 259,800 1,510 100 .26 .01 .00 43.42 34.01 35.19<br />
Travel agents .................................................... 87,500 910 90 .09 .01 .00 15.06 15.57 11.43<br />
Sales representatives, services,<br />
all other ......................................................... 489,920 11,850 1,310 .48 .11 .01 27.17 24.35 23.59<br />
Sales representatives, wholesale<br />
and manufacturing, technical<br />
and scientific products ............................ 391,050 1,740 260 .39 .02 .00 34.90 33.85 20.82<br />
Sales representatives, wholesale<br />
and manufacturing, except technical<br />
and scientific products ............................ 1,492,150 3,770 510 1.47 .03 .00 28.08 27.38 22.10<br />
See notes at end <strong>of</strong> table.<br />
For-pr<strong>of</strong>it Not-for-pr<strong>of</strong>it Govern-<br />
employ- employ- ment<br />
ment ment employ-<br />
ment<br />
Percentage<br />
<strong>of</strong> forpr<strong>of</strong>itemployment<br />
Percentage<br />
<strong>of</strong> not-forpr<strong>of</strong>itemployment<br />
Percentage<br />
<strong>of</strong><br />
governmentemployment<br />
For-pr<strong>of</strong>it Not-for-<br />
Governwage<br />
pr<strong>of</strong>it wage<br />
ment<br />
wage<br />
Monthly Labor Review • November 2008 33
Not-For-Pr<strong>of</strong>it Sector<br />
Table A–1. Continued—For-pr<strong>of</strong>it, not-for-pr<strong>of</strong>it, and government employment and wages, by detailed occupation, 2006<br />
Occupation<br />
Demonstrators and product<br />
promoters .................................................... 83,440 650 80 0.08 0.01 0.00 $12.32 $13.38 $17.25<br />
Models ................................................................ 690 210 570 .00 .00 .00 13.31 13.68 13.50<br />
Real estate brokers ........................................ 46,670 360 90 .05 .00 .00 38.58 33.77 28.33<br />
Real estate sales agents ............................... 161,630 2,260 4,880 .16 .02 .02 26.09 22.14 28.49<br />
Sales engineers ............................................... 74,900 300 90 .07 .00 .00 39.92 39.01 36.00<br />
Telemarketers .................................................. 378,230 10,050 150 .37 .09 .00 11.61 10.99 12.68<br />
Door–to–door sales workers, news and<br />
street vendors, and related workers ... 10,960 ( 1 ) ( 1 ) .01 ( 1 ) ( 1 ) 12.84 12.12 ( 1 )<br />
Sales and related workers, all other ......... 140,690 19,230 3,380 .14 .18 .02 19.23 21.21 23.27<br />
First–line supervisors/managers <strong>of</strong><br />
<strong>of</strong>fice and administrative support<br />
workers......................................................... 1,100,580 116,310 148,660 1.09 1.07 .69 22.25 22.23 22.76<br />
Switchboard operators, including<br />
answering service ..................................... 129,360 30,680 13,330 .13 .28 .06 11.17 11.63 12.38<br />
Telephone operators ..................................... 23,480 2,150 1,040 .02 .02 .00 15.90 13.60 14.44<br />
Communications equipment<br />
operators, all other .................................... 1,950 460 1,840 .00 .00 .01 14.65 11.98 18.21<br />
Bill and account collectors .......................... 387,110 28,110 11,750 .38 .26 .05 14.66 14.87 14.89<br />
Billing and posting clerks and<br />
machine operators .................................... 430,380 64,960 26,740 .42 .60 .12 14.38 14.30 13.78<br />
Bookkeeping, accounting, and<br />
auditing clerks ........................................... 1,545,730 131,990 191,410 1.52 1.22 .89 15.18 15.15 15.83<br />
Gaming cage workers ................................... 12,910 100 5,140 .01 .00 .02 11.82 10.93 11.11<br />
Payroll and timekeeping clerks ................. 164,880 14,830 28,150 .16 .14 .13 15.75 16.12 16.54<br />
Procurement clerks ........................................ 47,220 5,560 22,270 .05 .05 .10 15.51 15.17 17.51<br />
Tellers .................................................................. 564,980 42,220 430 .56 .39 .00 10.92 11.20 13.35<br />
Brokerage clerks ............................................. 72,290 170 160 .07 .00 .00 18.88 18.65 21.59<br />
Correspondence clerks ................................ 13,090 1,150 2,050 .01 .01 .01 14.56 14.15 13.11<br />
Court, municipal, and license clerks ........ 3,140 60 103,970 .00 .00 .48 12.16 16.37 15.76<br />
Credit authorizers, checkers,<br />
and clerks ..................................................... 65,020 ( 1 ) ( 1 ) .06 ( 1 ) ( 1 ) 15.15 15.49 ( 1 )<br />
Customer service representatives ............ 2,010,600 93,250 56,810 1.98 .86 .26 14.59 14.24 14.98<br />
Eligibility interviewers, government<br />
programs ...................................................... 2,400 3,030 101,720 .00 .03 .47 16.37 14.29 18.29<br />
File clerks ........................................................... 172,010 26,760 25,490 .17 .25 .12 11.12 11.53 12.33<br />
Hotel, motel, and resort desk clerks ........ 213,500 1,010 810 .21 .01 .00 9.35 9.93 9.86<br />
Interviewers, except eligibility<br />
and loan ........................................................ 102,720 76,860 32,480 .10 .71 .15 12.44 13.28 14.50<br />
Library <strong>as</strong>sistants, clerical ............................ 4,000 15,660 89,660 .00 .14 .42 11.85 11.39 10.93<br />
Loan interviewers and clerks ..................... 240,550 8,860 910 .24 .08 .00 15.67 15.11 14.74<br />
New accounts clerks...................................... 76,130 5,840 (1) .08 .05 (1) 14.17 13.61 10.39<br />
Order clerks ...................................................... 261,330 3,190 690 .26 .03 .00 13.51 13.43 14.85<br />
Human resources <strong>as</strong>sistants, except<br />
payroll and timekeeping ........................ 99,740 18,280 42,900 .10 .17 .20 16.43 15.89 17.53<br />
Receptionists and information clerks ..... 921,160 130,070 66,410 .91 1.20 .31 11.39 11.40 12.08<br />
Reservation and transportation ticket<br />
agents and travel clerks .......................... 158,570 1,270 530 .16 .01 .00 14.48 12.62 15.81<br />
All other information and record<br />
clerks .............................................................. 107,700 14,330 110,700 .11 .13 .51 14.75 15.44 16.86<br />
Cargo and freight agents ............................ 84,060 470 680 .08 .00 .00 18.45 19.62 22.99<br />
Couriers and messengers ............................ 93,980 7,800 6,890 .09 .07 .03 10.92 11.18 12.51<br />
Police, fire, and ambulance<br />
dispatchers .................................................. 6,200 2,450 86,160 .01 .02 .40 14.53 14.26 15.78<br />
Dispatchers, except police, fire,<br />
and ambulance .......................................... 166,990 4,980 14,660 .16 .05 .07 16.57 14.92 16.43<br />
Meter readers, utilities .................................. 22,920 3,140 19,800 .02 .03 .09 16.40 14.26 14.42<br />
Production, planning, and expediting<br />
clerks .............................................................. 259,740 10,900 17,210 .26 .10 .08 19.13 16.71 21.82<br />
Shipping, receiving, and traffic clerks ..... 743,210 10,250 14,060 .73 .09 .07 13.11 12.41 18.55<br />
See notes at end <strong>of</strong> table.<br />
34 Monthly Labor Review • November 2008<br />
For-pr<strong>of</strong>it Not-for-pr<strong>of</strong>it Govern-<br />
employ- employ- ment<br />
ment ment employ-<br />
ment<br />
Percentage<br />
<strong>of</strong> forpr<strong>of</strong>itemployment<br />
Percentage<br />
<strong>of</strong> not-forpr<strong>of</strong>itemployment<br />
Percentage<br />
<strong>of</strong><br />
governmentemployment<br />
For-pr<strong>of</strong>it Not-for-<br />
Governwage<br />
pr<strong>of</strong>it wage<br />
ment<br />
wage
Table A–1. Continued—For-pr<strong>of</strong>it, not-for-pr<strong>of</strong>it, and government employment and wages, by detailed occupation, 2006<br />
Occupation<br />
For-pr<strong>of</strong>it Not-for-pr<strong>of</strong>it Govern-<br />
employ- employ- ment<br />
ment ment employ-<br />
ment<br />
Not-forpr<strong>of</strong>it<br />
wage<br />
Stock clerks and order fillers ...................... 1,646,820 33,720 44,050 1.62 0.31 0.20 $10.61 $11.88 $15.44<br />
Weighers, me<strong>as</strong>urers, checkers, and<br />
samplers, recordkeeping ........................ 74,430 1,880 1,490 .07 .02 .01 13.16 10.81 14.62<br />
Executive secretaries and<br />
administrative <strong>as</strong>sistants ........................ 1,042,460 195,140 267,500 1.03 1.80 1.24 18.94 18.16 18.46<br />
Legal secretaries ............................................. 245,460 3,780 20,980 .24 .03 .10 19.14 17.48 17.93<br />
Medical secretaries ........................................ 281,520 95,040 21,080 .28 .88 .10 14.09 13.88 13.56<br />
Secretaries, except legal, medical,<br />
and executive.............................................. 1,119,710 202,500 456,820 1.10 1.87 2.12 13.10 13.97 14.66<br />
Computer operators...................................... 96,540 9,220 19,140 .10 .08 .09 16.67 16.06 17.66<br />
Data entry keyers ........................................... 243,390 19,550 36,160 .24 .18 .17 12.03 12.79 13.71<br />
Word processors and typists ...................... 57,360 8,190 96,130 .06 .08 .45 14.91 14.67 14.15<br />
Desktop publishers ........................................ 28,340 1,260 890 .03 .01 .00 17.34 18.27 16.52<br />
Insurance claims and policy<br />
processing clerks ....................................... 226,260 9,990 3,180 .22 .09 .01 15.71 16.04 16.95<br />
Mail clerks and mail machine<br />
operators, except postal<br />
service ........................................................... 119,200 9,660 13,010 .12 .09 .06 11.79 12.48 13.89<br />
Office clerks, general ..................................... 2,169,390 290,330 598,230 2.14 2.68 2.78 11.87 12.18 12.78<br />
Office machine operators,<br />
except computer ....................................... 83,850 2,710 5,560 .08 .02 .03 12.36 13.10 14.28<br />
Pro<strong>of</strong>readers and copy markers ................ 15,130 440 1,410 .01 .00 .01 14.54 15.61 9.21<br />
Statistical <strong>as</strong>sistants ....................................... 8,900 1,990 9,950 .01 .02 .05 16.93 15.93 14.15<br />
Office and administrative support<br />
workers, all other ....................................... 144,260 31,190 103,750 .14 .29 .48 14.48 13.89 13.49<br />
First–line supervisors/managers<br />
<strong>of</strong> farming, fishing, and forestry<br />
workers......................................................... 16,670 370 2,800 .02 .00 .01 18.61 21.19 22.94<br />
Farm labor contractors ................................. 2,050 ( 1 ) ( 1 ) .00 ( 1 ) ( 1 ) 13.87 ( 1 ) ( 1 )<br />
Agricultural inspectors ................................. 3,230 290 11,420 .00 .00 .05 16.65 13.38 19.27<br />
Animal breeders ............................................. 1,990 70 ( 1 ) .00 .00 ( 1 ) 15.38 15.19 ( 1 )<br />
Graders and sorters, agricultural<br />
products ....................................................... 43,940 90 1,920 .04 .00 .01 8.80 10.27 12.27<br />
Agricultural equipment operators ........... 20,810 100 300 .02 .00 .00 10.52 9.15 13.19<br />
Farmworkers and laborers, crop,<br />
nursery, and greenhouse ........................ 228,140 1,330 2,080 .23 .01 .01 8.42 10.97 12.68<br />
Farmworkers, farm and ranch<br />
animals .......................................................... 45,760 950 1,280 .05 .01 .01 9.80 10.15 13.74<br />
Agricultural workers, all other ................... 5,340 270 2,980 .01 .00 .01 11.03 11.68 13.88<br />
Fishers and related fishing workers ......... 770 ( 1 ) ( 1 ) .00 ( 1 ) ( 1 ) 12.98 ( 1 ) 17.32<br />
Forest and conservation workers ............. 1,420 650 6,810 .00 .01 .03 12.92 10.40 11.73<br />
Fallers .................................................................. 8,640 ( 1 ) ( 1 ) .00 ( 1 ) ( 1 ) 15.72 ( 1 ) ( 1 )<br />
Logging equipment operators .................. 28,140 ( 1 ) 150 .00 ( 1 ) .00 14.84 ( 1 ) 16.50<br />
Log graders and scalers ............................... 4,750 ( 1 ) ( 1 ) .00 ( 1 ) ( 1 ) 14.88 ( 1 ) 15.87<br />
Logging workers, all other .......................... 5,740 ( 1 ) ( 1 ) .00 ( 1 ) ( 1 ) 15.15 ( 1 ) ( 1 )<br />
First–line supervisors/managers<br />
<strong>of</strong> construction trades<br />
and extraction workers ........................... 532,090 3,700 46,100 .52 .03 .21 27.73 29.38 24.41<br />
Boilermakers .................................................... 16,710 160 560 .02 .00 .00 23.34 22.56 21.54<br />
Brickm<strong>as</strong>ons and blockm<strong>as</strong>ons ................. 117,460 230 1,290 .12 .00 .01 21.26 19.84 21.19<br />
Stonem<strong>as</strong>ons ................................................... 19,100 ( 1 ) 50 .02 ( 1 ) .00 17.88 22.51 18.62<br />
Carpenters ........................................................ 964,000 8,060 22,620 .95 .07 .11 19.08 21.01 19.53<br />
Carpet installers .............................................. 36,730 50 100 .04 .00 .00 18.39 22.48 19.62<br />
Floor layers, except carpet, wood,<br />
and hard tiles .............................................. 14,850 ( 1 ) 60 .01 ( 1 ) .00 18.80 17.42 20.22<br />
Floor sanders and finishers ......................... 7,440 ( 1 ) ( 1 ) .00 ( 1 ) ( 1 ) 15.31 ( 1 ) ( 1 )<br />
Tile and marble setters ................................. 51,370 ( 1 ) ( 1 ) .00 ( 1 ) ( 1 ) 18.89 ( 1 ) 24.70<br />
Cement m<strong>as</strong>ons and concrete<br />
finishers ......................................................... 219,580 100 1,350 .22 .00 .01 17.00 19.57 18.68<br />
Construction laborers ................................... 984,670 2,220 48,260 .97 .02 .22 14.22 14.95 15.01<br />
See notes at end <strong>of</strong> table.<br />
Percentage<br />
<strong>of</strong> forpr<strong>of</strong>itemployment<br />
Percentage<br />
<strong>of</strong> not-forpr<strong>of</strong>itemployment<br />
Percentage<br />
<strong>of</strong><br />
governmentemployment<br />
For-pr<strong>of</strong>it<br />
wage<br />
Government<br />
wage<br />
Monthly Labor Review • November 2008 35
Not-For-Pr<strong>of</strong>it Sector<br />
Table A–1. Continued—For-pr<strong>of</strong>it, not-for-pr<strong>of</strong>it, and government employment and wages, by detailed occupation, 2006<br />
Occupation<br />
Paving, surfacing, and tamping<br />
equipment operators ............................... 48,040 ( 1 ) ( 1 ) 0.00 ( 1 ) ( 1 ) $16.62 ( 1 ) $15.74<br />
Pile–driver operators .................................... 5,040 ( 1 ) ( 1 ) .00 ( 1 ) ( 1 ) 24.16 ( 1 ) 20.40<br />
Operating engineers and other<br />
construction equipment operators .... 326,970 1,320 68,960 .32 0.01 0.32 19.95 20.01 16.77<br />
Drywall and ceiling tile installers .............. 140,530 150 60 .14 .00 .00 18.66 13.80 19.79<br />
Electricians ........................................................ 584,680 6,120 31,060 .58 .06 .14 22.28 23.30 23.20<br />
Glaziers ............................................................... 51,770 ( 1 ) 310 .05 ( 1 ) .00 18.25 24.78 23.02<br />
Insulation workers, floor, ceiling,<br />
and wall ......................................................... 31,110 600 70 .03 .01 .00 16.44 14.01 18.87<br />
Insulation workers, mechanical ................ 27,550 30 570 .03 .00 .00 19.87 14.57 23.89<br />
Painters, construction<br />
and maintenance ...................................... 244,650 3,930 16,360 .24 .04 .08 16.13 18.60 19.99<br />
Paperhangers................................................... 6,120 ( 1 ) ( 1 ) .01 ( 1 ) ( 1 ) 17.41 21.98 18.49<br />
Pipelayers .......................................................... 47,800 160 10,680 .05 .00 .05 16.33 15.25 15.59<br />
Plumbers, pipefitters, and steamfitters .. 409,960 3,290 25,420 .40 .03 .12 22.03 22.55 20.76<br />
Pl<strong>as</strong>terers and stucco m<strong>as</strong>ons .................... 50,190 50 780 .05 .00 .00 17.79 20.41 22.64<br />
Reinforcing iron and rebar workers ......... 30,980 ( 1 ) ( 1 ) .00 ( 1 ) ( 1 ) 20.01 ( 1 ) 23.71<br />
Ro<strong>of</strong>ers ............................................................... 124,960 100 660 .12 .00 .00 16.92 20.05 20.72<br />
Sheet metal workers ..................................... 170,800 270 7,090 .17 .00 .03 19.43 21.93 22.87<br />
Helpers––brickm<strong>as</strong>ons, blockm<strong>as</strong>ons,<br />
stonem<strong>as</strong>ons, and tile and marble<br />
setters ............................................................ 62,540 ( 1 ) 110 .00 ( 1 ) .00 13.34 ( 1 ) 19.52<br />
Helpers––carpenters ..................................... 107,410 330 400 .11 .00 .00 11.45 12.65 11.03<br />
Helpers––electricians ................................... 102,070 210 1,240 .10 .00 .01 11.85 15.71 16.47<br />
Helpers––painters, paperhangers,<br />
pl<strong>as</strong>terers, and stucco m<strong>as</strong>ons .............. 23,320 40 170 .02 .00 .00 10.81 13.59 15.92<br />
Helpers––pipelayers, plumbers,<br />
pipefitters, and steamfitters .................. 81,250 150 1,450 .08 .00 .01 12.04 14.89 19.64<br />
Helpers, construction trades,<br />
all other ......................................................... 34,630 140 1,700 .03 .00 .01 11.74 14.77 14.14<br />
Construction and building inspectors .... 41,140 700 55,520 .04 .01 .26 23.82 20.20 22.95<br />
Elevator installers and repairers ................ 21,400 30 600 .02 .00 .00 29.62 25.13 27.70<br />
Fence erectors ................................................. 24,470 ( 1 ) ( 1 ) .00 ( 1 ) ( 1 ) 13.53 ( 1 ) 10.62<br />
Hazardous materials removal workers ... 37,350 340 1,440 .04 .00 .01 18.24 19.29 20.56<br />
Highway maintenance workers ................ 5,460 40 136,940 .01 .00 .64 15.51 14.97 15.32<br />
Rail–track laying and maintenance<br />
equipment operators ............................... 13,180 ( 1 ) ( 1 ) .00 ( 1 ) ( 1 ) 18.91 ( 1 ) 22.65<br />
Construction and related workers,<br />
all other ......................................................... 46,660 720 8,950 .05 .01 .04 15.75 17.56 15.90<br />
Derrick operators, oil and g<strong>as</strong> .................... 16,910 ( 1 ) ( 1 ) .00 ( 1 ) ( 1 ) 18.23 ( 1 ) ( 1 )<br />
Rotary drill operators, oil and g<strong>as</strong> ............ 18,010 ( 1 ) ( 1 ) .00 ( 1 ) ( 1 ) 20.36 ( 1 ) ( 1 )<br />
Earth drillers, except oil and g<strong>as</strong> ............... 19,200 ( 1 ) 150 .00 ( 1 ) .00 17.66 ( 1 ) 21.11<br />
Explosives workers, ordnance handling<br />
experts, and bl<strong>as</strong>ters ................................ 3,600 ( 1 ) ( 1 ) .00 ( 1 ) ( 1 ) 20.24 ( 1 ) 18.76<br />
Mine cutting and channeling machine<br />
operators ...................................................... 7,730 ( 1 ) ( 1 ) .00 ( 1 ) ( 1 ) 18.68 ( 1 ) ( 1 )<br />
Rock splitters, quarry .................................... 3,830 ( 1 ) ( 1 ) .00 ( 1 ) ( 1 ) 13.85 ( 1 ) ( 1 )<br />
Helpers––extraction workers ..................... 24,000 ( 1 ) ( 1 ) .00 ( 1 ) ( 1 ) 14.59 ( 1 ) ( 1 )<br />
Extraction workers, all other ...................... 8,690 ( 1 ) 210 .00 ( 1 ) .00 18.40 ( 1 ) 20.78<br />
First–line supervisors/managers<br />
<strong>of</strong> mechanics, installers,<br />
and repairers ............................................... 385,310 12,340 56,250 .38 .11 .26 27.04 25.99 26.28<br />
Computer, automated teller,<br />
and <strong>of</strong>fice machine repairers................. 135,450 1,070 4,510 .13 .01 .02 18.20 18.05 18.98<br />
Radio mechanics ............................................ 5,240 40 960 .01 .00 .00 18.55 19.95 22.55<br />
Telecommunications equipment<br />
installers and repairers, except line<br />
installers ........................................................ 185,020 2,620 3,610 .18 .02 .02 24.39 20.77 21.67<br />
Avionics technicians ...................................... 13,200 50 2,120 .01 .00 .01 22.80 21.80 22.65<br />
See notes at end <strong>of</strong> table.<br />
36 Monthly Labor Review • November 2008<br />
For-pr<strong>of</strong>it Govern-<br />
Not-for-pr<strong>of</strong>it<br />
ment<br />
employ- employemploymentment<br />
ment<br />
Percentage<br />
<strong>of</strong> forpr<strong>of</strong>itemployment<br />
Percentage<br />
<strong>of</strong> not-forpr<strong>of</strong>itemployment<br />
Percentage<br />
<strong>of</strong><br />
governmentemployment<br />
For-pr<strong>of</strong>it Not-for-<br />
Governwage<br />
pr<strong>of</strong>it wage<br />
ment<br />
wage
Table A–1. Continued—For-pr<strong>of</strong>it, not-for-pr<strong>of</strong>it, and government employment and wages, by detailed occupation, 2006<br />
Occupation<br />
Electric motor, power tool,<br />
and related repairers ................................ 21,740 150 340 0.02 0.00 0.00 $16.67 $13.83 $20.72<br />
Electrical and electronics installers<br />
and repairers, transportation<br />
equipment ................................................... 16,660 280 ( 1 ) .02 .00 ( 1 ) 20.42 19.80 ( 1 )<br />
Electrical and electronics repairers,<br />
commercial and industrial<br />
equipment ................................................... 64,760 630 13,610 .06 .01 .06 21.48 22.84 23.87<br />
Electrical and electronics repairers,<br />
powerhouse, substation,<br />
and relay ....................................................... 18,510 1,400 2,410 .02 .01 .01 27.62 25.72 25.01<br />
Electronic equipment installers<br />
and repairers, motor <strong>vehicle</strong>s................ 19,380 ( 1 ) ( 1 ) .00 ( 1 ) ( 1 ) 14.82 ( 1 ) 22.61<br />
Electronic home entertainment<br />
equipment installers and repairers ..... 35,070 60 270 .03 .00 .00 15.20 14.70 19.67<br />
Security and fire alarm systems<br />
installers ........................................................ 51,980 140 510 .05 .00 .00 17.35 19.65 19.77<br />
Aircraft mechanics and service<br />
technicians ................................................... 99,900 650 18,250 .10 .01 .08 23.77 21.64 23.37<br />
Automotive body and related<br />
repairers ....................................................... 154,690 70 1,670 .15 .00 .01 18.29 20.18 21.00<br />
Automotive gl<strong>as</strong>s installers<br />
and repairers ............................................... 18,790 ( 1 ) ( 1 ) .00 ( 1 ) ( 1 ) 15.35 ( 1 ) ( 1 )<br />
Automotive service technicians<br />
and mechanics ........................................... 607,850 2,740 35,890 .60 .03 .17 17.15 17.94 19.56<br />
Bus and truck mechanics and diesel<br />
engine specialists ...................................... 216,120 1,240 38,900 .21 .01 .18 18.31 18.61 19.12<br />
Farm equipment mechanics ...................... 29,200 40 300 .03 .00 .00 14.56 15.57 16.06<br />
Mobile heavy equipment mechanics,<br />
except engines ........................................... 100,460 260 19,340 .10 .00 .09 19.58 19.75 21.06<br />
Rail car repairers ............................................. 19,860 ( 1 ) ( 1 ) .00 ( 1 ) ( 1 ) 19.85 ( 1 ) ( 1 )<br />
Motorboat mechanics .................................. 18,450 80 100 .00 .00 .00 16.53 15.90 18.67<br />
Outdoor power equipment and other<br />
small engine mechanics ......................... 24,610 240 730 .02 .00 .00 13.28 15.54 17.78<br />
Bicycle repairers .............................................. 8,320 ( 1 ) ( 1 ) .00 ( 1 ) ( 1 ) 10.86 ( 1 ) ( 1 )<br />
Recreational <strong>vehicle</strong> service<br />
technicians ................................................... 13,520 30 ( 1 ) .01 .00 ( 1 ) 16.00 12.86 14.37<br />
Tire repairers and changers ........................ 103,840 ( 1 ) 370 .10 ( 1 ) .00 10.90 11.59 15.53<br />
Mechanical door repairers .......................... 15,070 ( 1 ) 100 .00 ( 1 ) .00 16.34 ( 1 ) 17.55<br />
Control and valve installers<br />
and repairers, except mechanical<br />
door ................................................................ 33,140 1,470 7,860 .03 .01 .04 22.17 19.89 20.26<br />
Heating, air conditioning,<br />
and refrigeration mechanics<br />
and installers ............................................... 229,340 4,470 19,100 .23 .04 .09 18.83 21.23 20.83<br />
Home appliance repairers ........................... 43,160 150 150 .04 .00 .00 16.91 19.98 18.97<br />
Industrial machinery mechanics .............. 243,080 1,290 10,100 .24 .01 .05 20.28 20.62 22.95<br />
Maintenance and repair workers,<br />
general .......................................................... 999,240 95,320 226,040 .99 .88 1.05 16.02 15.12 16.67<br />
Maintenance workers, machinery ............ 73,170 890 8,030 .07 .01 .04 17.33 17.97 18.63<br />
Millwrights ........................................................ 53,020 70 250 .05 .00 .00 22.99 24.74 22.61<br />
Electrical power–line installers<br />
and repairers ............................................... 79,470 16,940 15,250 .08 .16 .07 24.17 23.35 23.25<br />
Telecommunications line installers<br />
and repairers ............................................... 155,850 1,590 1,000 .15 .01 .00 21.91 20.96 22.44<br />
Camera and photographic equipment<br />
repairers ........................................................ 3,130 140 230 .00 .00 .00 17.81 17.64 15.53<br />
Medical equipment repairers .................... 24,770 6,020 1,490 .02 .06 .01 20.50 21.27 20.67<br />
Musical instrument repairers<br />
and tuners .................................................... 4,980 60 90 .00 .00 .00 15.15 21.03 21.15<br />
See notes at end <strong>of</strong> table.<br />
For-pr<strong>of</strong>it Not-for-pr<strong>of</strong>it Govern-<br />
employ- employ- ment<br />
ment ment employ-<br />
ment<br />
Percentage<br />
<strong>of</strong> forpr<strong>of</strong>itemployment<br />
Percentage<br />
<strong>of</strong> not-forpr<strong>of</strong>itemployment<br />
Percentage<br />
<strong>of</strong><br />
governmentemployment<br />
For-pr<strong>of</strong>it Not-for-<br />
Governwage<br />
pr<strong>of</strong>it wage<br />
ment<br />
wage<br />
Monthly Labor Review • November 2008 37
Not-For-Pr<strong>of</strong>it Sector<br />
Table A–1. Continued—For-pr<strong>of</strong>it, not-for-pr<strong>of</strong>it, and government employment and wages, by detailed occupation, 2006<br />
Occupation<br />
Precision instrument and equipment<br />
repairers, all other ..................................... 9,950 120 3,160 0.01 0.00 0.01 $22.35 $19.89 $23.25<br />
Coin, vending, and amusement<br />
machine servicers and repairers .......... 37,230 300 2,060 .04 .00 .01 14.25 12.71 15.73<br />
Commercial divers ......................................... 2,500 60 130 .00 .00 .00 22.08 16.73 18.01<br />
Fabric menders, except garment .............. 1,260 ( 1 ) ( 1 ) .00 ( 1 ) ( 1 ) 14.53 ( 1 ) 16.07<br />
Locksmiths and safe repairers ................... 15,200 610 2,120 .01 .01 .01 15.34 21.14 20.23<br />
Manufactured building and mobile<br />
home installers ........................................... 9,510 ( 1 ) ( 1 ) .00 ( 1 ) ( 1 ) 12.79 ( 1 ) ( 1 )<br />
Riggers ............................................................... 10,340 400 1,330 .01 .00 .01 18.34 21.49 23.67<br />
Signal and track switch repairers .............. 4,710 ( 1 ) ( 1 ) .00 ( 1 ) ( 1 ) 23.50 18.41 ( 1 )<br />
Helpers––installation, maintenance,<br />
and repair workers .................................... 141,990 3,760 16,320 .14 .03 .08 11.27 13.03 14.15<br />
Installation, maintenance, and repair<br />
workers, all other ....................................... 115,450 1,430 15,280 .11 .01 .07 16.54 16.12 20.74<br />
First–line supervisors/managers<br />
<strong>of</strong> production and operating<br />
workers .......................................................... 652,250 6,870 23,370 .64 .06 .11 24.21 21.21 25.47<br />
Aircraft structure, surfaces, rigging,<br />
and systems <strong>as</strong>semblers ......................... 27,650 ( 1 ) ( 1 ) .00 ( 1 ) ( 1 ) 21.09 ( 1 ) ( 1 )<br />
Coil winders, tapers, and finishers............ 22,660 ( 1 ) ( 1 ) .00 ( 1 ) ( 1 ) 12.90 ( 1 ) ( 1 )<br />
Electrical and electronic equipment<br />
<strong>as</strong>semblers ................................................... 215,100 700 190 .21 .01 .00 13.10 14.53 12.27<br />
Electromechanical equipment<br />
<strong>as</strong>semblers ................................................... 60,260 ( 1 ) ( 1 ) .00 ( 1 ) ( 1 ) 13.87 ( 1 ) ( 1 )<br />
Engine and other machine <strong>as</strong>semblers .. 45,150 ( 1 ) ( 1 ) .00 ( 1 ) ( 1 ) 17.01 ( 1 ) ( 1 )<br />
Structural metal fabricators and fitters .. 100,170 ( 1 ) ( 1 ) .00 ( 1 ) ( 1 ) 15.07 ( 1 ) 18.38<br />
Team <strong>as</strong>semblers ............................................ 1,253,650 ( 1 ) ( 1 ) 1.24 ( 1 ) ( 1 ) 12.56 9.47 ( 1 )<br />
Timing device <strong>as</strong>semblers, adjusters,<br />
and calibrators ............................................ 2,470 ( 1 ) ( 1 ) .00 ( 1 ) ( 1 ) 14.54 ( 1 ) ( 1 )<br />
Assemblers and fabricators, all other ...... 283,830 4,840 640 .28 .04 .00 14.97 9.75 10.19<br />
Bakers ................................................................. 140,660 630 830 .14 .01 .00 11.31 12.57 13.20<br />
Butchers and meat cutters .......................... 128,940 ( 1 ) 1,220 .13 ( 1 ) .01 13.47 12.51 18.93<br />
Meat, poultry, and fish cutters<br />
and trimmers ............................................. 140,490 ( 1 ) (1) .14 ( 1 ) ( 1 ) 10.21 10.66 ( 1 )<br />
Slaughterers and meat packers ................ 118,750 ( 1 ) (1) .00 ( 1 ) ( 1 ) 10.54 ( 1 ) ( 1 )<br />
Food and tobacco ro<strong>as</strong>ting, baking,<br />
and drying machine operators<br />
and tenders ................................................. 18,570 ( 1 ) (1) .00 ( 1 ) ( 1 ) 12.34 ( 1 ) ( 1 )<br />
Food batchmakers ......................................... 93,000 ( 1 ) (1) .00 ( 1 ) ( 1 ) 11.89 ( 1 ) ( 1 )<br />
Food cooking machine operators<br />
and tenders ................................................. 44,340 ( 1 ) (1) .00 ( 1 ) ( 1 ) 10.93 ( 1 ) ( 1 )<br />
Computer–controlled machine tool<br />
operators, metal and pl<strong>as</strong>tic .................. 139,600 270 ( 1 ) .14 .00 ( 1 ) 15.77 14.51 ( 1 )<br />
Numerical tool and process control<br />
programmers .............................................. 17,740 ( 1 ) ( 1 ) .02 ( 1 ) ( 1 ) 21.54 20.44 ( 1 )<br />
Extruding and drawing machine<br />
setters, operators, and tenders, metal<br />
and pl<strong>as</strong>tic .................................................... 94,300 ( 1 ) ( 1 ) .00 ( 1 ) ( 1 ) 14.09 ( 1 ) 23.13<br />
Forging machine setters, operators,<br />
and tenders, metal and pl<strong>as</strong>tic ............. 30,640 ( 1 ) ( 1 ) .00 ( 1 ) ( 1 ) 14.31 ( 1 ) 22.04<br />
Rolling machine setters, operators,<br />
and tenders, metal and pl<strong>as</strong>tic ............. 34,490 ( 1 ) ( 1 ) .00 ( 1 ) ( 1 ) 15.42 ( 1 ) ( 1 )<br />
Cutting, punching, and press machine<br />
setters, operators, and tenders,<br />
metal and pl<strong>as</strong>tic ....................................... 270,480 380 110 .27 .00 .00 13.30 12.46 15.18<br />
Drilling and boring machine tool<br />
setters, operators, and tenders,<br />
metal and pl<strong>as</strong>tic ....................................... 42,550 ( 1 ) ( 1 ) .04 ( 1 ) ( 1 ) 15.20 11.49 ( 1 )<br />
Grinding, lapping, polishing,<br />
and buffing machine tool setters,<br />
See notes at end <strong>of</strong> table.<br />
38 Monthly Labor Review • November 2008<br />
Govern-<br />
For-pr<strong>of</strong>it Not-for-pr<strong>of</strong>it ment<br />
employ- employment<br />
ment employ-<br />
ment<br />
Percentage<br />
<strong>of</strong> forpr<strong>of</strong>itemployment<br />
Percentage<br />
<strong>of</strong> not-forpr<strong>of</strong>itemployment<br />
Percentage<br />
<strong>of</strong><br />
governmentemployment<br />
For-pr<strong>of</strong>it Not-forwage<br />
pr<strong>of</strong>it wage<br />
Government<br />
wage
Table A–1. Continued—For-pr<strong>of</strong>it, not-for-pr<strong>of</strong>it, and government employment and wages, by detailed occupation, 2006<br />
Occupation<br />
operators, and tenders, metal<br />
and pl<strong>as</strong>tic .................................................... 99,920 ( 1 ) ( 1 ) 0.00 ( 1 ) ( 1 ) $14.30 ( 1 ) ( 1 )<br />
Lathe and turning machine tool<br />
setters, operators, and tenders,<br />
metal and pl<strong>as</strong>tic ....................................... 65,910 ( 1 ) ( 1 ) .00 ( 1 ) ( 1 ) 15.97 ( 1 ) ( 1 )<br />
Milling and planing machine setters,<br />
operators, and tenders, metal<br />
and pl<strong>as</strong>tic .................................................... 29,050 ( 1 ) ( 1 ) .00 ( 1 ) ( 1 ) 15.51 ( 1 ) ( 1 )<br />
Machinists ......................................................... 379,640 1,230 5,140 .37 0.01 0.02 17.12 $20.00 $23.03<br />
Metal–refining furnace operators<br />
and tenders ................................................. 18,330 ( 1 ) ( 1 ) .00 ( 1 ) ( 1 ) 16.12 ( 1 ) ( 1 )<br />
Pourers and c<strong>as</strong>ters, metal .......................... 14,850 ( 1 ) ( 1 ) .00 ( 1 ) ( 1 ) 14.87 ( 1 ) ( 1 )<br />
Model makers, metal and pl<strong>as</strong>tic .............. 8,260 60 60 .01 .00 .00 21.19 21.03 22.31<br />
Patternmakers, metal and pl<strong>as</strong>tic ............. 7,060 ( 1 ) ( 1 ) .00 ( 1 ) ( 1 ) 18.31 ( 1 ) ( 1 )<br />
Foundry mold and coremakers ................. 14,430 ( 1 ) ( 1 ) .00 ( 1 ) ( 1 ) 14.38 ( 1 ) 25.43<br />
Molding, coremaking, and c<strong>as</strong>ting<br />
machine setters, operators,<br />
and tenders, metal and pl<strong>as</strong>tic ............. 156,290 50 490 .00 .00 .00 13.08 17.30 22.71<br />
Multiple machine tool setters,<br />
operators, and tenders, metal<br />
and pl<strong>as</strong>tic .................................................... 97,530 170 70 .10 .00 .00 15.38 11.01 19.33<br />
Tool and die makers ...................................... 96,970 50 440 .10 .00 .00 21.88 21.09 26.13<br />
Welders, cutters, solderers,<br />
and brazers .................................................. 373,220 470 5,280 .37 .00 .02 15.69 18.00 21.31<br />
Welding, soldering, and brazing<br />
machine setters, operators,<br />
and tenders ................................................. 48,810 ( 1 ) ( 1 ) .00 ( 1 ) ( 1 ) 16.05 ( 1 ) 19.97<br />
Heat treating equipment setters,<br />
operators, and tenders, metal<br />
and pl<strong>as</strong>tic .................................................... 26,830 ( 1 ) ( 1 ) .00 ( 1 ) ( 1 ) 15.21 ( 1 ) 22.40<br />
Lay-out workers, metal and pl<strong>as</strong>tic .......... 9,110 ( 1 ) ( 1 ) .00 ( 1 ) ( 1 ) 16.30 ( 1 ) 22.96<br />
Plating and coating machine setters,<br />
operators, and tenders, metal<br />
and pl<strong>as</strong>tic .................................................... 41,060 ( 1 ) ( 1 ) .00 ( 1 ) ( 1 ) 13.98 ( 1 ) 21.27<br />
Tool grinders, filers, and sharpeners........ 17,510 ( 1 ) 120 .02 ( 1 ) .00 15.43 14.63 21.77<br />
Metal workers and pl<strong>as</strong>tic workers,<br />
all other ......................................................... 46,710 190 1,040 .05 .00 .00 18.06 13.50 20.78<br />
Bindery workers .............................................. 61,840 ( 1 ) ( 1 ) .00 ( 1 ) ( 1 ) 12.99 ( 1 ) 17.78<br />
Bookbinders ..................................................... 6,620 ( 1 ) ( 1 ) .00 ( 1 ) ( 1 ) 15.01 ( 1 ) 23.99<br />
Job printers....................................................... 43,670 1,390 1,370 .04 .01 .01 16.29 17.06 16.78<br />
Prepress technicians and workers ............ 68,910 ( 1 ) ( 1 ) .00 ( 1 ) ( 1 ) 16.60 ( 1 ) 19.29<br />
Printing machine operators ....................... 184,310 ( 1 ) ( 1 ) .00 ( 1 ) ( 1 ) 15.63 ( 1 ) 19.02<br />
Laundry and dry–cleaning workers......... 188,040 22,770 8,540 .19 .21 .04 8.90 9.77 10.93<br />
Pressers, textile, garment, and related<br />
materials ....................................................... 74,890 690 110 .00 .00 .00 8.86 8.83 12.40<br />
Sewing machine operators ......................... 223,660 2,370 370 .22 .02 .00 9.67 8.60 14.22<br />
Shoe and leather workers<br />
and repairers ............................................... 8,160 ( 1 ) ( 1 ) .00 ( 1 ) ( 1 ) 10.40 ( 1 ) ( 1 )<br />
Sewers, hand .................................................... 9,430 290 60 .01 .00 .00 10.46 8.35 12.90<br />
Tailors, dressmakers, and custom<br />
sewers ............................................................ 29,560 440 140 .03 .00 .00 11.85 15.13 12.38<br />
Textile bleaching and dyeing machine<br />
operators and tenders ............................. 20,180 ( 1 ) ( 1 ) .00 ( 1 ) ( 1 ) 11.48 12.60 ( 1 )<br />
Textile cutting machine setters,<br />
operators, and tenders ............................ 19,350 190 ( 1 ) .02 .00 ( 1 ) 10.86 9.55 ( 1 )<br />
Textile knitting and weaving machine<br />
setters, operators, and tenders ............. 38,790 ( 1 ) ( 1 ) .00 ( 1 ) ( 1 ) 11.75 ( 1 ) (1)<br />
Textile winding, twisting, and drawing<br />
out machine setters, operators,<br />
and tenders ................................................. 44,120 ( 1 ) ( 1 ) .00 ( 1 ) ( 1 ) 11.32 ( 1 ) ( 1 )<br />
See notes at end <strong>of</strong> table.<br />
For-pr<strong>of</strong>it Not-for-pr<strong>of</strong>it Govern-<br />
employ- employ- ment<br />
ment ment employ-<br />
ment<br />
Percentage<br />
<strong>of</strong> forpr<strong>of</strong>itemployment<br />
Percentage<br />
<strong>of</strong> not-forpr<strong>of</strong>itemployment<br />
Percentage<br />
<strong>of</strong><br />
governmentemployment<br />
For-pr<strong>of</strong>it Not-for-<br />
Governwage<br />
pr<strong>of</strong>it wage<br />
ment<br />
wage<br />
Monthly Labor Review • November 2008 39
Not-For-Pr<strong>of</strong>it Sector<br />
Table A–1. Continued—For-pr<strong>of</strong>it, not-for-pr<strong>of</strong>it, and government employment and wages, by detailed occupation, 2006<br />
Occupation<br />
Extruding and forming machine<br />
setters, operators, and tenders,<br />
synthetic and gl<strong>as</strong>s fibers ....................... 17,890 ( 1 ) ( 1 ) 0.00 ( 1 ) ( 1 ) $14.38 ( 1 ) ( 1 )<br />
Fabric and apparel patternmakers ........... 8,780 ( 1 ) ( 1 ) .00 ( 1 ) ( 1 ) 18.49 $11.36 ( 1 )<br />
Upholsterers ..................................................... 40,180 100 190 .04 .00 .00 13.66 15.16 $17.77<br />
Textile, apparel, and furnishings<br />
workers, all other ....................................... 21,560 420 950 .02 .00 .00 11.54 10.37 20.81<br />
Cabinetmakers and bench carpenters ... 127,970 130 530 .13 .00 .00 13.75 16.38 20.14<br />
Furniture finishers .......................................... 25,040 30 ( 1 ) .02 .00 ( 1 ) 12.79 11.86 ( 1 )<br />
Sawing machine setters, operators,<br />
and tenders, wood .................................... 60,210 30 30 .06 .00 .00 12.20 9.64 16.59<br />
Woodworking machine setters,<br />
operators, and tenders, except<br />
sawing ........................................................... 97,580 100 140 .10 .00 .00 12.06 11.39 14.13<br />
Woodworkers, all other ................................ 10,600 180 600 .01 .00 .00 11.59 8.58 20.78<br />
Nuclear power reactor operators ............. 3,550 ( 1 ) ( 1 ) .00 ( 1 ) ( 1 ) 34.25 ( 1 ) 30.71<br />
Power distributors and dispatchers ......... 6,200 450 1,780 .01 .00 .01 30.20 28.37 30.27<br />
Power plant operators .................................. 26,520 1,700 6,020 .03 .02 .03 27.51 25.10 22.95<br />
Stationary engineers and boiler<br />
operators ...................................................... 20,760 6,630 15,780 .02 .06 .07 22.12 22.92 22.88<br />
Water and liquid w<strong>as</strong>te treatment<br />
plant and system operators ................... 17,260 2,050 88,980 .02 .02 .41 17.69 16.66 17.83<br />
Chemical plant and system operators .... 53,470 ( 1 ) ( 1 ) .00 ( 1 ) ( 1 ) 23.44 ( 1 ) 20.24<br />
G<strong>as</strong> plant operators ....................................... 11,800 ( 1 ) ( 1 ) .00 ( 1 ) ( 1 ) 26.05 ( 1 ) 19.02<br />
Petroleum pump system operators,<br />
refinery operators, and gaugers........... 40,760 ( 1 ) ( 1 ) .00 ( 1 ) ( 1 ) 25.21 ( 1 ) 21.43<br />
Plant and system operators, all other ..... 10,030 280 3,810 .01 .00 .02 22.29 20.54 21.84<br />
Chemical equipment operators<br />
and tenders ................................................. 51,530 ( 1 ) ( 1 ) .05 ( 1 ) ( 1 ) 19.79 19.52 ( 1 )<br />
Separating, filtering, clarifying,<br />
precipitating, and still machine<br />
setters, operators, and tenders ............. 43,400 70 270 .04 .00 .00 17.36 17.86 16.86<br />
Crushing, grinding, and polishing<br />
machine setters, operators,<br />
and tenders ................................................. 41,600 ( 1 ) ( 1 ) .00 ( 1 ) ( 1 ) 14.14 ( 1 ) 18.60<br />
Grinding and polishing workers, hand ... 44,010 ( 1 ) ( 1 ) .00 ( 1 ) ( 1 ) 12.22 ( 1 ) 22.47<br />
Mixing and blending machine setters,<br />
operators, and tenders ............................ 142,030 330 ( 1 ) .14 .00 ( 1 ) 14.76 15.32 19.45<br />
Cutters and trimmers, hand ....................... 28,830 ( 1 ) ( 1 ) .00 ( 1 ) ( 1 ) 11.67 ( 1 ) ( 1 )<br />
Cutting and slicing machine setters,<br />
operators, and tenders ............................ 78,240 160 40 .08 .00 .00 14.20 12.45 11.19<br />
Extruding, forming, pressing,<br />
and compacting machine setters,<br />
operators, and tenders ............................ 81,590 70 70 .08 .00 .00 13.99 13.98 14.95<br />
Furnace, kiln, oven, drier, and kettle<br />
operators and tenders ............................. 26,940 110 60 .03 .00 .00 15.24 15.66 18.38<br />
Inspectors, testers, sorters, samplers,<br />
and weighers .............................................. 476,950 4,640 5,500 .47 .04 .03 15.41 13.28 21.38<br />
Jewelers and precious stone and metal<br />
workers .......................................................... 26,480 ( 1 ) ( 1 ) .00 ( 1 ) ( 1 ) 15.97 ( 1 ) ( 1 )<br />
Dental laboratory technicians ................... 45,110 90 700 .04 .00 .00 16.69 18.28 22.01<br />
Medical appliance technicians .................. 9,850 600 210 .01 .01 .00 16.52 16.00 19.01<br />
Ophthalmic laboratory technicians ......... 29,220 460 160 .03 .00 .00 13.17 16.48 19.87<br />
Packaging and filling machine<br />
operators and tenders ............................. 387,480 1,710 550 .38 .02 .00 11.97 12.23 14.81<br />
Coating, painting, and spraying<br />
machine setters, operators,<br />
and tenders ................................................. 102,170 180 260 .10 .00 .00 13.54 14.82 16.59<br />
Painters, transportation equipment ........ 51,860 ( 1 ) 320 .00 ( 1 ) .00 18.54 ( 1 ) 21.24<br />
Painting, coating, and decorating<br />
workers .......................................................... 29,580 150 320 .03 .00 .00 12.05 12.50 19.80<br />
See notes at end <strong>of</strong> table.<br />
40 Monthly Labor Review • November 2008<br />
For-pr<strong>of</strong>it Not-for-pr<strong>of</strong>it Govern-<br />
employ- employ- ment<br />
ment ment employ-<br />
ment<br />
Percentage<br />
<strong>of</strong> forpr<strong>of</strong>itemployment<br />
Percentage<br />
<strong>of</strong> not-forpr<strong>of</strong>itemployment<br />
Percentage<br />
<strong>of</strong><br />
governmentemployment<br />
For-pr<strong>of</strong>it Not-for-<br />
Governwage<br />
pr<strong>of</strong>it wage<br />
ment<br />
wage
Table A–1. Continued—For-pr<strong>of</strong>it, not-for-pr<strong>of</strong>it, and government employment and wages, by detailed occupation, 2006<br />
Occupation<br />
Photographic process workers .................. 23,560 380 310 0.02 0.00 0.00 $12.79 $12.56 $15.95<br />
Photographic processing machine<br />
operators ...................................................... 49,930 220 100 .05 .00 .00 10.33 13.31 14.10<br />
Semiconductor processors ......................... 41,390 ( 1 ) ( 1 ) .00 ( 1 ) ( 1 ) 16.70 ( 1 ) ( 1 )<br />
Cementing and gluing machine<br />
operators and tenders ............................. 23,630 ( 1 ) ( 1 ) .00 ( 1 ) ( 1 ) 12.89 ( 1 ) ( 1 )<br />
Cleaning, w<strong>as</strong>hing, and metal pickling<br />
equipment operators and tenders ...... 15,530 ( 1 ) ( 1 ) .00 ( 1 ) ( 1 ) 12.20 ( 1 ) ( 1 )<br />
Cooling and freezing equipment<br />
operators and tenders ............................. 10,100 ( 1 ) ( 1 ) .01 ( 1 ) ( 1 ) 12.42 13.12 ( 1 )<br />
Etchers and engravers .................................. 11,290 ( 1 ) ( 1 ) .00 ( 1 ) ( 1 ) 13.21 ( 1 ) 34.77<br />
Molders, shapers, and c<strong>as</strong>ters, except<br />
metal and pl<strong>as</strong>tic ....................................... 42,580 ( 1 ) 290 .04 ( 1 ) .00 12.80 16.17 16.75<br />
Paper goods machine setters,<br />
operators, and tenders ............................ 114,320 120 ( 1 ) .11 .00 ( 1 ) 15.66 14.46 ( 1 )<br />
Helpers—production workers ................... 537,470 3,610 1,700 .53 .03 .01 10.61 10.33 12.26<br />
Production workers, all other .................... 291,380 6,000 2,890 .29 .06 .01 13.72 9.85 17.22<br />
Aircraft cargo handling supervisors ........ 5,440 ( 1 ) 230 .01 ( 1 ) .00 21.55 21.34 28.50<br />
First–line supervisors/managers<br />
<strong>of</strong> helpers, laborers, and material<br />
movers, hand .............................................. 174,310 2,040 4,240 .17 .02 .02 20.12 17.73 20.08<br />
First–line supervisors/managers<br />
<strong>of</strong> transportation and material–<br />
moving machine and <strong>vehicle</strong><br />
operators ...................................................... 189,100 2,580 30,580 .19 .02 .14 24.16 20.08 26.47<br />
Airline pilots, copilots, and flight<br />
engineers ...................................................... 72,750 340 2,850 .00 .00 .00 ( 1 ) ( 1 ) ( 1 )<br />
Commercial pilots .......................................... 25,250 980 1,030 .02 .01 .00 67,570 52,800 56,180<br />
Airfield operations specialists .................... 3,060 60 1,660 .00 .00 .01 18.67 17.03 22.30<br />
Ambulance drivers and attendants,<br />
except emergency medical<br />
technicians ................................................... 13,960 3,640 3,800 .01 .03 .02 10.30 10.12 11.53<br />
Bus drivers, transit and intercity ............... 73,090 3,950 115,360 .07 .04 .54 13.40 11.45 17.55<br />
Bus drivers, school ......................................... 166,340 26,030 265,490 .16 .24 1.23 12.54 10.61 11.91<br />
Driver/sales workers ...................................... 397,090 1,580 250 .39 .01 .00 11.71 10.81 12.29<br />
Truck drivers, heavy and tractor–<br />
trailer .............................................................. 1,651,430 2,430 32,990 1.63 .02 .15 17.42 15.84 16.04<br />
Truck drivers, light or delivery<br />
services .......................................................... 917,570 12,550 19,130 .91 .12 .09 13.18 11.64 14.30<br />
Taxi drivers and chauffeurs ......................... 128,130 19,720 8,110 .13 .18 .04 10.60 10.04 11.74<br />
Motor <strong>vehicle</strong> operators, all other ............ 53,630 2,170 16,320 .05 .02 .08 11.48 12.38 17.05<br />
Locomotive engineers .................................. 35,260 30 1,580 .03 .00 .01 29.93 14.04 25.69<br />
Railroad brake, signal, and switch<br />
operators ...................................................... 22,200 ( 1 ) ( 1 ) .00 ( 1 ) ( 1 ) 25.06 ( 1 ) ( 1 )<br />
Railroad conductors and yardm<strong>as</strong>ters .... 35,670 ( 1 ) ( 1 ) .00 ( 1 ) ( 1 ) 28.33 ( 1 ) ( 1 )<br />
Subway and streetcar operators ............... ( 1 ) ( 1 ) 6,180 ( 1 ) ( 1 ) .00 20.65 ( 1 ) 22.34<br />
Rail transportation workers, all other ..... 5,630 ( 1 ) ( 1 ) .00 ( 1 ) (1) 18.15 ( 1 ) 20.66<br />
Sailors and marine oilers ............................. 28,360 250 3,380 .03 .00 .02 15.51 15.30 17.16<br />
Captains, mates, and pilots <strong>of</strong> water<br />
vessels............................................................ 26,720 820 1,960 .00 .00 .00 27.43 24.12 27.81<br />
Motorboat operators .................................... 1,830 80 560 .00 .00 .00 15.25 13.77 21.78<br />
Ship engineers ................................................ 12,640 100 1,500 .01 .00 .01 28.70 23.14 27.31<br />
Bridge and lock tenders ............................... 670 50 2,980 .00 .00 .01 14.33 13.50 18.01<br />
Parking lot attendants .................................. 122,730 4,320 6,260 .12 .04 .03 8.77 9.26 10.04<br />
Service station attendants .......................... 93,340 110 2,690 .09 .00 .01 8.99 12.27 15.21<br />
Traffic technicians .......................................... ( 1 ) ( 1 ) 5,820 ( 1 ) ( 1 ) .00 17.57 ( 1 ) 18.77<br />
Transportation inspectors ........................... 13,190 80 10,600 .01 .00 .05 23.18 25.29 30.86<br />
Transportation workers, all other ............. 37,740 320 4,390 .04 .00 .02 15.40 14.71 16.40<br />
Conveyor operators and tenders .............. 50,150 ( 1 ) ( 1 ) .05 ( 1 ) ( 1 ) 13.43 17.93 ( 1 )<br />
Crane and tower operators ......................... 44,630 100 1,280 .04 .00 .01 19.85 19.58 20.74<br />
See notes at end <strong>of</strong> table.<br />
For-pr<strong>of</strong>it Not-for-pr<strong>of</strong>it Govern-<br />
employ- employ- ment<br />
ment ment employ-<br />
ment<br />
Percentage<br />
<strong>of</strong> forpr<strong>of</strong>itemployment<br />
Percentage<br />
<strong>of</strong> not-forpr<strong>of</strong>itemployment<br />
Percentage<br />
<strong>of</strong><br />
governmentemployment<br />
For-pr<strong>of</strong>it Not-for-<br />
Governwage<br />
pr<strong>of</strong>it wage<br />
ment<br />
wage<br />
Monthly Labor Review • November 2008 41
Not-For-Pr<strong>of</strong>it Sector<br />
Table A–1. Continued—For-pr<strong>of</strong>it, not-for-pr<strong>of</strong>it, and government employment and wages, by detailed occupation, 2006<br />
Occupation<br />
Dredge operators ........................................... 1,650 ( 1 ) ( 1 ) 0.00 ( 1 ) ( 1 ) $17.62 ( 1 ) $20.44<br />
Excavating and loading machine<br />
and dragline operators ............................ 65,670 290 2,410 .06 .00 .01 17.12 $21.26 15.86<br />
Hoist and winch operators ......................... 2,670 (1) (1) .00 (1) (1) 17.94 ( 1 ) 20.37<br />
Industrial truck and tractor operators .... 620,160 2,340 9,180 .61 .02 .04 13.89 13.87 18.63<br />
Cleaners <strong>of</strong> <strong>vehicle</strong>s and equipment ....... 329,580 ( 1 ) ( 1 ) .33 ( 1 ) ( 1 ) 9.55 11.56 ( 1 )<br />
Laborers and freight, <strong>stock</strong>,<br />
and material movers, hand .................... 2,296,910 31,760 66,790 2.27 .29 .31 11.04 10.62 11.62<br />
Machine feeders and <strong>of</strong>fbearers ............... 148,740 ( 1 ) ( 1 ) .00 ( 1 ) ( 1 ) 11.57 ( 1 ) 11.34<br />
Packers and packagers, hand..................... 826,770 6,860 1,130 .82 .06 .01 9.27 8.26 17.12<br />
G<strong>as</strong> compressor and g<strong>as</strong> pumping<br />
station operators ....................................... 3,860 ( 1 ) ( 1 ) .00 ( 1 ) ( 1 ) 21.53 ( 1 ) ( 1 )<br />
Pump operators, except wellhead<br />
pumpers ....................................................... 9,580 ( 1 ) 550 .00 ( 1 ) .00 19.65 ( 1 ) 16.66<br />
Refuse and recyclable material<br />
collectors ...................................................... 78,320 340 49,880 .08 .00 .23 14.86 11.82 14.73<br />
Shuttle car operators .................................... 2,800 50 ( 1 ) .00 .00 ( 1 ) 18.98 16.24 ( 1 )<br />
Tank car, truck, and ship loaders ............... 15,440 ( 1 ) ( 1 ) .00 ( 1 ) ( 1 ) 16.40 ( 1 ) ( 1 )<br />
Material moving workers, all other .......... 47,140 650 4,450 .05 .01 .02 15.89 13.77 15.71<br />
Bailiffs ................................................................. ( 1 ) ( 1 ) 18,800 ( 1 ) ( 1 ) .00 ( 1 ) ( 1 ) 17.21<br />
Postal service clerks ....................................... 120 ( 1 ) 82,410 .00 ( 1 ) .00 7.50 ( 1 ) 21.15<br />
Postal service mail sorters, processors,<br />
and processing machine operators .... 80 ( 1 ) 203,900 .00 ( 1 ) .00 16.66 ( 1 ) 19.74<br />
Hunters and trappers .................................... ( 1 ) ( 1 ) 30 ( 1 ) ( 1 ) .00 ( 1 ) ( 1 ) 15.24<br />
Terrazzo workers and finishers .................. 6,640 ( 1 ) ( 1 ) .00 ( 1 ) ( 1 ) 16.72 ( 1 ) ( 1 )<br />
Tapers ................................................................. 40,090 ( 1 ) ( 1 ) .00 ( 1 ) ( 1 ) 20.48 ( 1 ) ( 1 )<br />
Structural iron and steel workers ............. 68,100 ( 1 ) 500 .00 ( 1 ) .00 20.89 ( 1 ) 26.08<br />
Helpers––ro<strong>of</strong>ers ............................................ 21,140 ( 1 ) ( 1 ) .00 ( 1 ) ( 1 ) 10.92 ( 1 ) ( 1 )<br />
Septic tank servicers and sewer<br />
pipe cleaners ............................................... 17,390 ( 1 ) 4,960 .00 ( 1 ) .00 15.12 ( 1 ) 17.26<br />
Segmental pavers .......................................... 880 ( 1 ) ( 1 ) .00 ( 1 ) ( 1 ) 13.80 ( 1 ) ( 1 )<br />
Service unit operators, oil, g<strong>as</strong>,<br />
and mining .................................................. 25,360 ( 1 ) ( 1 ) .00 ( 1 ) ( 1 ) 17.37 ( 1 ) ( 1 )<br />
Continuous mining machine operators . 9,610 ( 1 ) ( 1 ) .00 ( 1 ) ( 1 ) 19.38 ( 1 ) ( 1 )<br />
Mining machine operators, all other ....... 2,880 ( 1 ) ( 1 ) .00 ( 1 ) ( 1 ) 18.49 ( 1 ) ( 1 )<br />
Ro<strong>of</strong> bolters, mining ...................................... 4,240 ( 1 ) ( 1 ) .00 ( 1 ) ( 1 ) 20.29 ( 1 ) ( 1 )<br />
Roustabouts, oil and g<strong>as</strong> ............................. 41,120 ( 1 ) ( 1 ) .00 ( 1 ) ( 1 ) 12.93 ( 1 ) ( 1 )<br />
Motorcycle mechanics ................................. 16,720 ( 1 ) ( 1 ) .00 ( 1 ) ( 1 ) 15.37 ( 1 ) 23.09<br />
Refractory materials repairers,<br />
except brickm<strong>as</strong>ons.................................. 3,340 ( 1 ) ( 1 ) .00 ( 1 ) ( 1 ) 19.61 ( 1 ) ( 1 )<br />
Watch repairers ............................................... 3,100 ( 1 ) ( 1 ) .00 ( 1 ) ( 1 ) 15.64 ( 1 ) ( 1 )<br />
Fibergl<strong>as</strong>s laminators and fabricators ..... 32,520 ( 1 ) ( 1 ) .00 ( 1 ) ( 1 ) 12.96 ( 1 ) ( 1 )<br />
Shoe machine operators and tenders .... 4,210 ( 1 ) ( 1 ) .00 ( 1 ) ( 1 ) 10.83 ( 1 ) ( 1 )<br />
Model makers, wood .................................... 1,870 ( 1 ) 50 .00 ( 1 ) .00 15.62 ( 1 ) 23.70<br />
Patternmakers, wood .................................... 2,240 ( 1 ) 40 .00 ( 1 ) .00 16.03 ( 1 ) 25.51<br />
Tire builders ...................................................... 23,240 ( 1 ) ( 1 ) .00 ( 1 ) ( 1 ) 18.36 ( 1 ) ( 1 )<br />
Air traffic controllers ...................................... 2,540 ( 1 ) 20,850 .00 ( 1 ) .00 32.55 ( 1 ) 55.39<br />
Locomotive firers ............................................ 530 ( 1 ) ( 1 ) .00 ( 1 ) ( 1 ) 22.08 ( 1 ) ( 1 )<br />
Rail yard engineers, dinkey operators,<br />
and hostlers ................................................. 5,710 ( 1 ) 100 .00 ( 1 ) .00 19.15 ( 1 ) 24.17<br />
Loading machine operators,<br />
underground mining ............................... 2,490 ( 1 ) ( 1 ) .00 ( 1 ) ( 1 ) 19.35 ( 1 ) ( 1 )<br />
Wellhead pumpers ........................................ 13,270 ( 1 ) ( 1 ) .00 ( 1 ) ( 1 ) 17.67 ( 1 ) ( 1 )<br />
Legislators ......................................................... ( 1 ) ( 1 ) 62,150 ( 1 ) ( 1 ) .00 ( 1 ) ( 1 ) 32,780.00<br />
Postm<strong>as</strong>ters and mail superintendents . ( 1 ) ( 1 ) 26,670 ( 1 ) ( 1 ) .00 ( 1 ) ( 1 ) 26.76<br />
Tax examiners, collectors, and revenue<br />
agents ............................................................ ( 1 ) ( 1 ) 75,980 ( 1 ) ( 1 ) .00 ( 1 ) ( 1 ) 23.81<br />
Administrative law judges,<br />
adjudicators, and hearing <strong>of</strong>ficers ....... ( 1 ) ( 1 ) 14,540 ( 1 ) ( 1 ) .00 ( 1 ) ( 1 ) 37.36<br />
See notes at end <strong>of</strong> table.<br />
42 Monthly Labor Review • November 2008<br />
For-pr<strong>of</strong>it Not-for-pr<strong>of</strong>it Govern-<br />
employ- employ- ment<br />
ment ment employ-<br />
ment<br />
Percentage<br />
<strong>of</strong> forpr<strong>of</strong>itemployment<br />
Percentage<br />
<strong>of</strong> not-forpr<strong>of</strong>itemployment<br />
Percentage<br />
<strong>of</strong><br />
governmentemployment<br />
For-pr<strong>of</strong>it Not-for-<br />
Governwage<br />
pr<strong>of</strong>it wage<br />
ment<br />
wage
Table A–1. Continued—For-pr<strong>of</strong>it, not-for-pr<strong>of</strong>it, and government employment and wages, by detailed occupation, 2006<br />
Occupation<br />
Judges, magistrate judges,<br />
and magistrates ......................................... ( 1 ) ( 1 ) 26,320 ( 1 ) ( 1 ) .00 ( 1 ) ( 1 ) $45.92<br />
Detectives and criminal investigators .... ( 1 ) ( 1 ) 100,890 ( 1 ) ( 1 ) .00 ( 1 ) ( 1 ) 28.99<br />
Fish and game wardens ............................... ( 1 ) ( 1 ) 7,560 ( 1 ) ( 1 ) .00 ( 1 ) ( 1 ) 21.21<br />
Postal service mail carriers .......................... ( 1 ) ( 1 ) 348,170 ( 1 ) ( 1 ) .00 ( 1 ) ( 1 ) 21.03<br />
1 Data not available.<br />
For-pr<strong>of</strong>it Not-for-pr<strong>of</strong>it Govern-<br />
employ- employ- ment<br />
ment ment employ-<br />
ment<br />
NOTE: <strong>The</strong> teaching occupations, athletes, coaches, umpires, athletic train-<br />
Percentage<br />
<strong>of</strong> forpr<strong>of</strong>itemployment<br />
Percentage<br />
<strong>of</strong> not-forpr<strong>of</strong>itemployment<br />
Percentage<br />
<strong>of</strong><br />
governmentemployment<br />
For-pr<strong>of</strong>it Not-for-<br />
Governwage<br />
pr<strong>of</strong>it wage<br />
ment<br />
- wage<br />
ers, legislators, flight attendants, and pilots show annual wages instead <strong>of</strong><br />
hourly wages, because these occupations generally do not work full time<br />
year round.<br />
Monthly Labor Review • November 2008 43
Employment and Disability<br />
Burt S. Barnow<br />
Burt S. Barnow is <strong>as</strong>sociate<br />
director for<br />
research and principal<br />
research scientist,<br />
Institute for Policy<br />
Studies, Johns Hopkins<br />
University, Baltimore,<br />
Maryland. This article<br />
w<strong>as</strong> prepared for the<br />
Interagency Committee<br />
on Disability Research,<br />
2006 National<br />
Disability Employment<br />
Research Summit. Email:<br />
barnow@jhu.edu<br />
<strong>The</strong> employment rate<br />
<strong>of</strong> people with disabilities<br />
Critical issues in evaluating employment policies<br />
for the disabled are the me<strong>as</strong>urement <strong>of</strong> employment status,<br />
the me<strong>as</strong>urement <strong>of</strong> disability status, and the question <strong>of</strong> which<br />
subpopulations <strong>of</strong> the disabled should be included; no clear<br />
consensus h<strong>as</strong> emerged regarding the outcome <strong>of</strong> these issues,<br />
except that surveys must provide more comprehensive coverage<br />
Promoting employment for people<br />
with disabilities h<strong>as</strong> long been an important<br />
policy objective in the United<br />
States. Some examples <strong>of</strong> Federal policies<br />
whose goal is to incre<strong>as</strong>e employment for<br />
people with disabilities are the vocational<br />
rehabilitation system, funded by grants from<br />
the U.S. Rehabilitation Services Administration<br />
to the States; the Ticket to Work<br />
program; the Work Opportunity Tax Credit;<br />
and the Americans with Disabilities Act<br />
(ADA). Many <strong>of</strong> these policies are relatively<br />
new; yet analysts have noted a <strong>decline</strong> in the<br />
employment rate <strong>of</strong> people with disabilities<br />
in recent years, 1 and some evaluations <strong>of</strong> the<br />
ADA indicate that, rather than incre<strong>as</strong>ing<br />
employment, the Act may have reduced employment<br />
for those with disabilities. <strong>The</strong>se<br />
surprising findings have led some observers<br />
to take a closer look at employment statistics<br />
for such individuals. Perhaps, they argue, it<br />
is not that the programs and policies have<br />
failed to aid disabled individuals in finding<br />
employment; rather, the statistics themselves<br />
are misleading and inappropriate.<br />
This article examines three issues that are<br />
critical in <strong>as</strong>sessing the success <strong>of</strong> employment<br />
policies for the disabled: the me<strong>as</strong>ure-<br />
44 Monthly Labor Review • November 2008<br />
ment <strong>of</strong> employment status, the me<strong>as</strong>urement<br />
<strong>of</strong> disability status, and the decision regarding<br />
whom to include in the analyses. Because the<br />
empirical studies reviewed herein made use<br />
<strong>of</strong> three specific surveys—the 2000 Decennial<br />
Census, the Current Population Survey<br />
(CPS), and the Survey <strong>of</strong> Income and Program<br />
Participation (SIPP)—the focus <strong>of</strong> the<br />
article is the definitions and me<strong>as</strong>urement<br />
<strong>of</strong> employment and disability status in those<br />
three surveys. <strong>The</strong> me<strong>as</strong>urement <strong>of</strong> employment<br />
status h<strong>as</strong> not been an issue <strong>of</strong> dispute<br />
in the literature, so it is discussed first. Next,<br />
the definitions <strong>of</strong> disability status are examined,<br />
followed by a review <strong>of</strong> the definitions<br />
used and analyses undertaken in evaluations<br />
<strong>of</strong> the ADA. <strong>The</strong> article concludes with suggestions<br />
about future research on me<strong>as</strong>uring<br />
disability status.<br />
Employment status<br />
Employment status is the le<strong>as</strong>t controversial<br />
<strong>of</strong> the aforementioned three issues. Definitions<br />
<strong>of</strong> employment and other labor force<br />
statuses generally follow those used for the<br />
CPS, a monthly survey <strong>of</strong> approximately<br />
60,000 households that is used to develop
the Nation’s <strong>of</strong>ficial employment statistics. <strong>The</strong> CPS defines<br />
employment (actually, employed persons, but the two<br />
terms may be taken to be identical for the purposes <strong>of</strong> this<br />
article) <strong>as</strong> follows:<br />
Persons 16 years and over in the civilian noninstitutional<br />
population who, during the reference week, (a)<br />
did any work at all (at le<strong>as</strong>t 1 hour) <strong>as</strong> paid employees;<br />
worked in their own business, pr<strong>of</strong>ession, or on<br />
their own farm, or worked 15 hours or more <strong>as</strong> unpaid<br />
workers in an enterprise operated by a member<br />
<strong>of</strong> the family; and (b) all those who were not working<br />
but who had jobs or businesses from which they<br />
were temporarily absent because <strong>of</strong> vacation, illness,<br />
bad weather, childcare problems, maternity or paternity<br />
leave, labor-management dispute, job training,<br />
or other family or personal re<strong>as</strong>ons, whether or not<br />
they were paid for the time <strong>of</strong>f or were seeking other<br />
jobs. 2<br />
People who are not employed are cl<strong>as</strong>sified <strong>as</strong> being either<br />
unemployed or not in the labor force. To be considered unemployed,<br />
a person must not have worked during the reference<br />
week, must have been available for work except for a<br />
temporary illness, and must have actively searched for work<br />
during the 4-week period ending in the reference week. Individuals<br />
who do not meet the criteria for being employed<br />
or unemployed are categorized <strong>as</strong> “not in the labor force.”<br />
<strong>The</strong> 2000 census uses the same concept <strong>of</strong> employment<br />
<strong>as</strong> the CPS, but because the purpose <strong>of</strong> the census is broader<br />
than that <strong>of</strong> the CPS, the census is structured differently<br />
and does not do <strong>as</strong> good a job <strong>of</strong> capturing labor force<br />
status <strong>as</strong> does the CPS:<br />
Census 2000 w<strong>as</strong> designed to collect general information<br />
about the labor force for very small geographic<br />
are<strong>as</strong> on a one-time b<strong>as</strong>is. It w<strong>as</strong> primarily a<br />
mail-out/mail-back data collection that <strong>as</strong>ked fewer<br />
and less precise questions than the CPS on employment<br />
and unemployment. 3<br />
<strong>The</strong> Census Bureau notes, “at the national level, Census<br />
2000 estimates <strong>of</strong> employment were considerably below,<br />
and estimates <strong>of</strong> unemployment above, the corresponding<br />
CPS estimates.” 4<br />
<strong>The</strong> SIPP is a federally sponsored longitudinal data collection<br />
effort whose purpose is<br />
To collect source and amount <strong>of</strong> income, labor force<br />
information, program participation and eligibility<br />
data, and general demographic characteristics to<br />
me<strong>as</strong>ure the effectiveness <strong>of</strong> existing Federal, State,<br />
and local programs; to estimate future costs and<br />
coverage for government programs, such <strong>as</strong> food<br />
stamps; and to provide improved statistics on the<br />
distribution <strong>of</strong> income and me<strong>as</strong>ures <strong>of</strong> economic<br />
well-being in the country. 5<br />
<strong>The</strong> SIPP operates by having national panels that include<br />
between 14,000 and 36,700 members who are followed<br />
for a period that varies from 2½ to 4 years. Labor force<br />
questions are included in the “core” module <strong>of</strong> the questionnaire,<br />
along with other key income and program participation<br />
questions. Topics covered in the topical modules<br />
(though not during each interview) include personal<br />
history, childcare, wealth, program eligibility, child support,<br />
utilization and cost <strong>of</strong> health care, disability, school<br />
enrollment, taxes, and annual income. 6<br />
<strong>The</strong> SIPP questions on employment are somewhat different<br />
from the ones <strong>as</strong>ked in the CPS or the 2000 census.<br />
To illustrate, first, the SIPP <strong>as</strong>ks about employment during<br />
a particular month, rather than during a particular week, <strong>as</strong><br />
the CPS and 2000 census do. Second, although the SIPP<br />
<strong>as</strong>ks questions dealing with unpaid work in a family business,<br />
they are not <strong>as</strong> specific <strong>as</strong> the questions used in the<br />
CPS. Third, the SIPP questions about temporary absence<br />
from work are not the same <strong>as</strong> the questions in the CPS<br />
and the 2000 census. Because <strong>of</strong> these significant differences,<br />
one would not expect to find consistent responses<br />
across the surveys.<br />
Although the three surveys produce somewhat different<br />
results, the literature does not appear to have major<br />
criticisms <strong>of</strong> the standard me<strong>as</strong>ures <strong>of</strong> employment. However,<br />
one author h<strong>as</strong> written several articles on how simply<br />
knowing the employment status <strong>of</strong> people with disabilities<br />
does not tell us the complete story. Lisa Schur’s 2002<br />
and 2003 studies7 used the CPS and SIPP to analyze the<br />
extent to which people with disabilities are more likely<br />
to participate in what she refers to <strong>as</strong> “nonstandard jobs”:<br />
part-time, temporary, and independent contractor positions.<br />
It h<strong>as</strong> long been established that such positions<br />
pay lower wages and <strong>of</strong>fer less generous fringe benefits<br />
than full-time positions, so accepting a position <strong>of</strong> that<br />
nature can be deleterious to workers with disabilities if<br />
they do not voluntarily choose such work. Schur found<br />
that more than 40 percent <strong>of</strong> workers with disabilities are<br />
in some form <strong>of</strong> nonstandard work, nearly twice the rate<br />
for their nondisabled counterparts. Schur also found that<br />
these arrangements are likely to be voluntary and that the<br />
primary explanation appears to be health problems. Thus,<br />
on the one hand, incre<strong>as</strong>ing nonstandard work opportunities<br />
may be an appropriate way to draw more people with<br />
disabilities into employment. On the other hand, noted<br />
Schur, <strong>employer</strong>s may be reluctant to pay for the cost <strong>of</strong><br />
Monthly Labor Review • November 2008 45
Employment and Disability<br />
accommodations for workers who are on the job for a<br />
limited time or for limited hours, and health insurance is<br />
a higher proportion <strong>of</strong> pay for part-time workers. Schur<br />
concluded that nonstandard work is an important option<br />
for people with disabilities, but further research is needed<br />
to determine whether such jobs provide the benefits and<br />
support that those people require and whether appropriate<br />
accommodations and benefits are in fact provided.<br />
One particular <strong>as</strong>pect <strong>of</strong> CPS labor force statistics deserves<br />
mention here, in that it may prove useful in the<br />
discussion which follows on the appropriate population<br />
to consider in determining the employment rate <strong>of</strong> people<br />
with disabilities. In the CPS, individuals who are neither<br />
employed nor unemployed are categorized <strong>as</strong> “not in the<br />
labor force,” and the survey includes questions aimed at<br />
identifying these workers’ interests and actions in seeking<br />
employment. Individuals who are not in the labor force are<br />
<strong>as</strong>ked if they would like to work. If so, they are <strong>as</strong>ked questions<br />
to determine whether they are marginally attached to<br />
the labor force, which means that they want work, are able<br />
to work, are available for work, and have looked for work<br />
during the p<strong>as</strong>t 12 months, but not in the p<strong>as</strong>t 4 weeks;<br />
or whether they are discouraged workers, which means that<br />
they satisfy the aforementioned conditions, but, in addition,<br />
they are not currently looking for work because they<br />
believe that there are no jobs available or there are none<br />
for which they would qualify.<br />
Defining disability status<br />
Disability is a more complex concept than employment,<br />
and there are a number <strong>of</strong> definitions there<strong>of</strong>. According<br />
to Andrew J. Houtenville and Richard B. Burkhauser,<br />
“Disability is a controversial concept to define and me<strong>as</strong>ure.”<br />
8 Michele Adler showed that Federal programs use<br />
a wide range <strong>of</strong> definitions <strong>of</strong> disability, and Burt S. Barnow<br />
showed how one Federal program, the Job Training<br />
Partnership Act, defined disabilities differently for eligibility<br />
and reporting purposes. 9 Burkhauser, Houtenville,<br />
and David C. Wittenburg noted that the most common<br />
conceptualizations <strong>of</strong> disability are b<strong>as</strong>ed on the models<br />
<strong>of</strong> Saad Nagi and the World Health Organization. 10<br />
Burkhauser, Houtenville, and Wittenburg observed that a<br />
population may be characterized <strong>as</strong> consisting <strong>of</strong> a set <strong>of</strong><br />
four concentric circles, with the outermost circle consisting<br />
<strong>of</strong> all working-age people, the next circle including<br />
those with impairments, the third circle comprising those<br />
with activity limitations, and the innermost circle consisting<br />
<strong>of</strong> people with longer term activity limitations. Note,<br />
importantly, that disability is not usually defined <strong>as</strong> being<br />
46 Monthly Labor Review • November 2008<br />
synonymous with activity limitations. Rather, most analysts<br />
define a disability <strong>as</strong> a combination <strong>of</strong> an impairment<br />
and some type <strong>of</strong> activity limitation.<br />
<strong>The</strong> March CPS Supplement includes a question on<br />
characteristics that limit work activities, namely, “(Do<br />
you/Does anyone in this household) have a health problem<br />
or disability which prevents (you/them) from working<br />
or which limits the kind or amount <strong>of</strong> work (you/they)<br />
can do?” the responses to which many economists and<br />
other social scientists have used to analyze disabilities. 11<br />
In addition, the Census Bureau h<strong>as</strong> developed an algorithm<br />
that cl<strong>as</strong>sifies a person <strong>as</strong> being disabled or having<br />
a “work disability” in response to a series <strong>of</strong> questions in<br />
the b<strong>as</strong>ic CPS monthly instrument, <strong>as</strong> well <strong>as</strong> the March<br />
Supplement; these other responses used to cl<strong>as</strong>sify someone<br />
<strong>as</strong> having a disability include “retired or left a job for<br />
health re<strong>as</strong>ons,” “not in the labor force because <strong>of</strong> a health<br />
re<strong>as</strong>on,” “currently not in the labor force because <strong>of</strong> a disability,”<br />
“did not work in the previous year because <strong>of</strong> illness<br />
or a disability,” “under age 65 and received Medicare<br />
or Supplemental Security Income in the previous year,”<br />
and “received Veterans’ Administration disability income<br />
in the previous year.” 12 <strong>The</strong> Census Bureau warns that the<br />
CPS questions are not designed to capture any particular<br />
concept <strong>of</strong> disability and that the questions on disability<br />
may or may not be appropriate for any particular research<br />
issue. 13<br />
<strong>The</strong> long form <strong>of</strong> the 2000 census included six questions<br />
on disability that were developed by a Federal interagency<br />
workgroup. 14 <strong>The</strong> first two questions <strong>as</strong>ked about<br />
impairments in vision or hearing and limitations in b<strong>as</strong>ic<br />
activities such <strong>as</strong> walking, climbing stairs, reaching, lifting,<br />
and carrying. <strong>The</strong> next four questions <strong>as</strong>ked whether<br />
the person had a physical, mental, or emotional condition<br />
l<strong>as</strong>ting 6 months or longer that resulted in difficulty<br />
in doing any <strong>of</strong> the following: learning, remembering, or<br />
concentrating; dressing, bathing, or getting around the<br />
house; going outside the home alone to shop or visit a<br />
doctor’s <strong>of</strong>fice; and working at a job or business. 15 <strong>The</strong><br />
Census Bureau notes that the 2000 census captures only<br />
a few dimensions <strong>of</strong> disability. Concern h<strong>as</strong> been raised<br />
by some Census Bureau staff that there w<strong>as</strong> a problem in<br />
the length and complexity <strong>of</strong> some <strong>of</strong> the disability questions,<br />
likely leading to undercounts <strong>of</strong> the population with<br />
employment disabilities and the population with stay-athome<br />
disabilities (which may overlap). 16<br />
Of the three surveys discussed in this article, the SIPP<br />
h<strong>as</strong> the most complete set <strong>of</strong> questions on disability. <strong>The</strong><br />
SIPP questions capture limits in functional activities (for<br />
example, seeing, hearing, and speaking); activities <strong>of</strong> daily
living (such <strong>as</strong> getting around the home, getting in and<br />
out <strong>of</strong> bed, and eating); instrumental activities <strong>of</strong> daily<br />
living (for instance, going outside <strong>of</strong> the home, keeping<br />
track <strong>of</strong> money, and preparing meals); the use <strong>of</strong> <strong>as</strong>sistive<br />
devices; the presence <strong>of</strong> conditions related to mental<br />
functioning; and the presence <strong>of</strong> a work disability. 17 In<br />
addition to collecting comprehensive information on disabilities,<br />
the SIPP <strong>as</strong>ks some <strong>of</strong> the questions more than<br />
once over the period that panel members are interviewed<br />
(generally, 2½ years), thereby <strong>of</strong>fering the opportunity to<br />
look for changes in disability status and consistency <strong>of</strong> responses<br />
over time.<br />
<strong>The</strong> ADA and employment trends<br />
In recent years, two series <strong>of</strong> studies have focused respectively<br />
on employment trends <strong>of</strong> people with disabilities<br />
and evaluations <strong>of</strong> the ADA. In both c<strong>as</strong>es, the studies concluded<br />
that a downward trend in employment for people<br />
with disabilities began in the 1990s and h<strong>as</strong> continued<br />
on to the present, with some researchers attributing at<br />
le<strong>as</strong>t part <strong>of</strong> the trend to the ADA. Critics <strong>of</strong> these studies<br />
generally have argued that the findings are spurious and<br />
are due to the researchers using the wrong definition <strong>of</strong><br />
disability or the wrong subset <strong>of</strong> the disabled population<br />
in their analysis.<br />
Although the ADA w<strong>as</strong> intended to incre<strong>as</strong>e employment<br />
opportunities for people with disabilities by prohibiting<br />
discrimination in the workplace and by requiring<br />
<strong>employer</strong>s to accommodate the needs <strong>of</strong> workers with<br />
disabilities, economic theory is more ambiguous. <strong>The</strong> major<br />
argument economists have made is that if <strong>employer</strong>s<br />
perceive the costs <strong>of</strong> accommodation to be high, they will<br />
refrain from hiring workers with disabilities. A more general<br />
point is one that h<strong>as</strong> been made in studying age discrimination:<br />
workers who lose their jobs are more likely<br />
to bring a discrimination suit than an applicant is, because<br />
the worker who is laid <strong>of</strong>f knows the relevant pool <strong>of</strong> labor,<br />
where<strong>as</strong> the applicant <strong>of</strong>ten h<strong>as</strong> no idea whom the<br />
<strong>employer</strong> hires or what the qualifications <strong>of</strong> those who are<br />
hired are. Thus, <strong>employer</strong>s must weigh the costs <strong>of</strong> possibly<br />
violating the discrimination law against the costs <strong>of</strong><br />
providing accommodations to workers with disabilities.<br />
In the latter regard, note that because the ADA uses the<br />
vague term “re<strong>as</strong>onable accommodation,” <strong>employer</strong>s face<br />
uncertainty <strong>as</strong> to what level <strong>of</strong> accommodation would be<br />
considered re<strong>as</strong>onable. Of course, <strong>as</strong> c<strong>as</strong>e law develops, it<br />
may be that the term “re<strong>as</strong>onable accommodation” will be<br />
fleshed out, thereby alleviating or even eliminating <strong>employer</strong>s’<br />
concerns.<br />
<strong>The</strong> most <strong>of</strong>ten cited study <strong>of</strong> the ADA w<strong>as</strong> conducted<br />
by Daren Acemoglu and Joshua D. Angrist. 18 Using<br />
March CPS data, they estimated employment trends from<br />
1988 through 1996 for workers with disabilities. Acemoglu<br />
and Angrist used regression analysis to statistically<br />
control for other factors that might have influenced employment<br />
rates for workers with disabilities, such <strong>as</strong> receipt<br />
<strong>of</strong> income transfer payments through Social Security<br />
Disability Insurance and Supplemental Security Income.<br />
After controlling for other relevant factors, the authors<br />
concluded that the ADA led to <strong>decline</strong>s in employment for<br />
workers aged 21 to 39 years with disabilities, but they did<br />
not find evidence <strong>of</strong> any employment impact for similar<br />
workers between the ages <strong>of</strong> 40 and 58 years. Acemoglu<br />
and Angrist tested a variety <strong>of</strong> specifications for their<br />
empirical work, and they consistently found a <strong>decline</strong> in<br />
the number <strong>of</strong> weeks <strong>of</strong> employment for younger workers<br />
with disabilities after the ADA became effective.<br />
In a series <strong>of</strong> articles, Thom<strong>as</strong> DeLeire used the SIPP<br />
to estimate the employment effects <strong>of</strong> the ADA. 19 With<br />
data from 1986 through 1995, DeLeire performed a probit<br />
analysis to estimate how the enactment <strong>of</strong> the ADA<br />
affected the probability <strong>of</strong> employment and wage rates for<br />
men aged 18 to 64 years with disabilities. In his simplest<br />
model, in which he controlled only for the presence <strong>of</strong> the<br />
ADA, DeLeire found that the Act reduced employment<br />
by a statistically significant 7.2 percentage points. When<br />
demographic characteristics, industry, and occupation<br />
were held constant, the impact <strong>decline</strong>d to 4.1 percentage<br />
points, again statistically significant. Next, DeLeire<br />
allowed the impact <strong>of</strong> the ADA to vary by year, and he<br />
found that employment effects began in 1990, when the<br />
ADA w<strong>as</strong> p<strong>as</strong>sed, and incre<strong>as</strong>ed in magnitude every year<br />
thereafter. He then found that the effects were greater for<br />
workers in manufacturing, blue-collar, and managerial occupations;<br />
workers with physical and mental disabilities;<br />
and workers whose disabilities were not due to work-related<br />
injuries. He found no evidence that the ADA affected<br />
the wage rates <strong>of</strong> disabled workers.<br />
Kathleen Beegle and Wendy A. Stock analyzed the impact<br />
<strong>of</strong> State disability discrimination laws on the employment<br />
and wage rates <strong>of</strong> people with disabilities. 20 <strong>The</strong>y<br />
noted that, prior to the enactment <strong>of</strong> the ADA, most States<br />
already had laws prohibiting employment discrimination<br />
against people with disabilities. Using decennial census<br />
data from 1970, 1980, and 1990, they performed a series<br />
<strong>of</strong> ordinary le<strong>as</strong>t squares regressions to determine the impacts<br />
<strong>of</strong> discrimination laws on the earnings, labor force<br />
participation rates, and employment <strong>of</strong> disabled individuals.<br />
In contr<strong>as</strong>t to DeLeire (who considered the effects <strong>of</strong><br />
Monthly Labor Review • November 2008 47
Employment and Disability<br />
the ADA rather than State laws), Beegle and Stock found<br />
that the discrimination laws were <strong>as</strong>sociated with lower<br />
relative earnings for the disabled and slightly lower labor<br />
force participation rates, but that they had no effect on<br />
employment rates.<br />
A number <strong>of</strong> articles have been critical <strong>of</strong> the literature<br />
on the impact <strong>of</strong> the ADA; the major arguments relating<br />
to the definition <strong>of</strong> disability and the relevant population<br />
to analyze are discussed next. Because the ADA w<strong>as</strong> not<br />
implemented <strong>as</strong> a cl<strong>as</strong>sical experiment with random <strong>as</strong>signment<br />
<strong>of</strong> <strong>employer</strong>s and disabled people to treatment<br />
status, the evaluations are subject to the usual challenges to<br />
nonexperimental evaluations; these issues are not covered<br />
in detail here, because the main purpose <strong>of</strong> this article is<br />
to explore definitions <strong>of</strong> employment and disability status<br />
and not to discuss the impact <strong>of</strong> the ADA. 21<br />
An important issue raised by all the critics is the definition<br />
<strong>of</strong> people with disabilities. <strong>The</strong> critics argue that the<br />
article by Acemoglu and Angrist and the articles by De-<br />
Leire suffer from two problems in their definitions <strong>of</strong> the<br />
disabled population <strong>of</strong> interest. First, they argue that, because<br />
the questions in the CPS and SIPP which are used to<br />
identify people with disabilities do not correspond well to<br />
the population covered by the ADA, those authors’ analyses<br />
cannot be used to determine the impact <strong>of</strong> the ADA on the<br />
covered population. 22 Second, the critics argue that, by using<br />
a definition <strong>of</strong> disability b<strong>as</strong>ed on the ability to work,<br />
the ADA can be a victim <strong>of</strong> its own success: to the extent<br />
that <strong>employer</strong>s make appropriate accommodations, some<br />
people with impairments will no longer consider themselves<br />
<strong>as</strong> having a disability, and those people, who were<br />
helped by the ADA, will no longer be counted <strong>as</strong> disabled.<br />
<strong>The</strong> first argument—that evaluations should examine<br />
the impact <strong>of</strong> the ADA only on the population covered<br />
by the Act—appears to be misguided. As all researchers<br />
on people with disabilities stress, the population with<br />
disabilities is not homogeneous. It is possible that the<br />
ADA might help one subgroup while hurting another. For<br />
example, much <strong>of</strong> the research on raising the minimum<br />
wage looks beyond the impact on those making less than<br />
the new minimum wage: there could be ripple effects that<br />
lead to wage incre<strong>as</strong>es for workers earning more than the<br />
new minimum, and if there is a sector that is not covered<br />
by the Act, workers in that sector may suffer a decre<strong>as</strong>e<br />
in their wages while those in the covered sector gain. 23<br />
If one believes that the only problem with the article by<br />
Acemoglu and Angrist and the articles by DeLeire is that<br />
they look at the “wrong” population <strong>of</strong> people with disabilities,<br />
one should still be very concerned with the findings,<br />
which imply that some individuals with disabilities<br />
48 Monthly Labor Review • November 2008<br />
are made worse <strong>of</strong>f because <strong>of</strong> the ADA. Alternatively, the<br />
findings that some groups are helped and some are hurt<br />
might be due to specification errors in the analyses: me<strong>as</strong>urement<br />
error and omitted variables can lead to bi<strong>as</strong>ed<br />
estimates <strong>of</strong> the impact <strong>of</strong> the Act.<br />
<strong>The</strong> second argument is more problematic. On the one<br />
hand, studies that use work limitations to define the population<br />
<strong>of</strong> interest are likely to develop bi<strong>as</strong>ed estimates<br />
to the extent that <strong>employer</strong>s implement accommodations<br />
which remove workers from the ranks <strong>of</strong> the disabled. On<br />
the other hand, to the extent that researchers use a more<br />
general activity limitation me<strong>as</strong>ure, individuals who have<br />
<strong>employer</strong>s accommodate their work limitations are still<br />
likely to have limitations on other activities.<br />
Research by Kruse and Schur and by Houtenville and<br />
Burkhauser show how important the definition <strong>of</strong> the pool<br />
<strong>of</strong> those with disabilities is in estimating the impact <strong>of</strong> the<br />
ADA. 24 Kruse and Schur developed 14 disability me<strong>as</strong>ures<br />
b<strong>as</strong>ed on activity limitation, receipt <strong>of</strong> disability income,<br />
and ability to work. <strong>The</strong>y found that the employment <strong>of</strong><br />
people with disabilities after the ADA w<strong>as</strong> p<strong>as</strong>sed differed<br />
by disability me<strong>as</strong>ure: employment <strong>decline</strong>d for those<br />
reporting work disabilities, but improved among those<br />
reporting any or severe functional limitations or limitations<br />
<strong>as</strong>sociated with activities <strong>of</strong> daily living who do not<br />
report a work disability. 25 Houtenville and Burkhauser<br />
found that, by considering only individuals with a disability<br />
l<strong>as</strong>ting for 2 consecutive years instead <strong>of</strong> a single<br />
year, the employment <strong>decline</strong> estimated by Acemoglu and<br />
Angrist to have resulted from the p<strong>as</strong>sage <strong>of</strong> the ADA did<br />
not in fact exist. What are we to make <strong>of</strong> the findings by<br />
these two studies? Either (1) the ADA h<strong>as</strong> affected different<br />
subpopulations <strong>of</strong> people with disabilities differently<br />
or (2) the results vary because <strong>of</strong> specification errors—for<br />
example, omitted explanatory variables or me<strong>as</strong>urement<br />
error. <strong>The</strong> sensitivity <strong>of</strong> the findings with regard to the<br />
population analyzed should give pause to the notion <strong>of</strong><br />
declaring the ADA ineffective, at le<strong>as</strong>t until these matters<br />
are resolved.<br />
Similar issues arise in research on recent employment<br />
trends <strong>of</strong> people with disabilities. A series <strong>of</strong> articles by<br />
Burkhauser and his colleagues points to a steady <strong>decline</strong><br />
in the employment rate for people with disabilities, beginning<br />
prior to the enactment <strong>of</strong> the ADA. 26 Some observers,<br />
such <strong>as</strong> Thom<strong>as</strong> W. Hale, argue that the data on the population<br />
is so poor in capturing the magnitude <strong>of</strong> the disabled<br />
population that we should refrain from <strong>as</strong>king even<br />
simple trend questions until we obtain improved data. 27<br />
Stapleton, Burkhauser, and Houtenville concur that there<br />
are problems with the data sources now available on the
employment <strong>of</strong> people with disabilities, but they argue<br />
that the major data sources (from the CPS, the SIPP, and<br />
the National Health Insurance Survey) all produce highly<br />
correlated employment series, so we can in fact identify<br />
trends in the overall employment level <strong>of</strong> people with disabilities.<br />
28 Although their re<strong>as</strong>oning is quite convincing,<br />
sometimes specific numbers, rather than trends, are needed,<br />
and sometimes also specific subgroups <strong>of</strong> the disabled<br />
population need to be identified.<br />
Implications for research and policy<br />
All the studies reviewed in this article expressed some<br />
concern with the data that are available to analyze employment<br />
status for people with disabilities. <strong>The</strong> primary<br />
issue is me<strong>as</strong>uring disability status appropriately, rather<br />
than me<strong>as</strong>uring employment status. However, additional<br />
insights might be gained by paying more attention to what<br />
Schur refers to <strong>as</strong> “nonstandard jobs” (part-time jobs, temporary<br />
situations, and independent-contractor work), <strong>as</strong><br />
well <strong>as</strong> by focusing more on the situation <strong>of</strong> people who are<br />
not in the labor force (for example, whether such people<br />
want to work, whether they are available to work, whether<br />
they have searched for work in the p<strong>as</strong>t 12 months, and<br />
the re<strong>as</strong>ons they have not searched for work).<br />
<strong>The</strong> data that are available appear to be adequate for<br />
identifying trends in employment patterns for people<br />
with disabilities, but they are clearly inadequate for <strong>as</strong>sessing<br />
the impact <strong>of</strong> acts such <strong>as</strong> the ADA. Because the<br />
consensus definitions <strong>of</strong> disability go beyond impairments<br />
and include activity limitations, such <strong>as</strong> work limitations,<br />
research is needed to better show how various impair-<br />
Notes<br />
1 See Richard V. Burkhauser, Andrew J. Houtenville, and David C. Wittenburg,<br />
“A User’s Guide to Current Statistics on the Employment <strong>of</strong> People<br />
with Disabilities,” in David C. Stapleton and Richard V. Burkhauser (eds.), <strong>The</strong><br />
Decline in Employment <strong>of</strong> People with Disabilities: A Policy Puzzle (Kalamazoo,<br />
MI, Upjohn Institute for Employment Research, 2003), pp. 23–86.<br />
2 Definition cited from the glossary at the BLS Internet site www.bls.gov/bls/<br />
glossary.htm (visited June 5, 2008). <strong>The</strong> reference week is the week for which<br />
respondents are <strong>as</strong>ked to report their activities.<br />
3 “Employment Status: 2000” (U.S. Census Bureau, August 2003), on the<br />
Internet at www.census.gov/prod/2003pubs/c2kbr-18.pdf (visited June 3,<br />
2008).<br />
4 Ibid.<br />
5 “Survey <strong>of</strong> Income and Program Participation” (U.S. Census Bureau, Feb.<br />
14, 2002; l<strong>as</strong>t updated Jan. 2, 2008), on the Internet at www.census.gov/sipp/<br />
overview.html (visited June 3, 2008).<br />
6 Ibid.<br />
ments limit major activities and how the trends have<br />
changed over time. Because the ADA is intended to affect<br />
the target population’s work limitations through <strong>employer</strong><br />
accommodations, it is inappropriate to <strong>as</strong>sess the impact<br />
<strong>of</strong> that Act by analyzing only the work-disabled population;<br />
the fact that studies using alternative definitions <strong>of</strong><br />
disability in <strong>as</strong>sessing the impact <strong>of</strong> the ADA reach quite<br />
different conclusions means that further work is needed<br />
to discover the impact <strong>of</strong> the ADA on various subpopulations.<br />
Research that explores the use <strong>of</strong> the impaired<br />
population and various definitions <strong>of</strong> activity limitations,<br />
including the ability to work at all, also must be pursued.<br />
In addition, studies indicate that the length and degree <strong>of</strong><br />
impairment can affect estimates <strong>of</strong> the impact <strong>of</strong> the Act,<br />
so further exploration <strong>of</strong> how and why that occurs would<br />
be valuable.<br />
Clearly, to truly understand the relationships that exist<br />
among impairments, disability, and work, major surveys<br />
must provide more comprehensive coverage <strong>of</strong> these issues.<br />
Unfortunately, space on the periodic surveys is expensive<br />
and scarce, so it would be naïve simply to call for<br />
more and better data. What may be more fe<strong>as</strong>ible is to<br />
periodically expand the samples <strong>of</strong> disabled individuals in<br />
some <strong>of</strong> these surveys and to <strong>as</strong>k more detailed questions<br />
about impairment, activity limitations, and disability.<br />
Finally, we should not be surprised that researchers<br />
cannot yet agree on the impact <strong>of</strong> the ADA or even how to<br />
me<strong>as</strong>ure the impact. <strong>The</strong> United States h<strong>as</strong> had minimumwage<br />
legislation since 1938, and economists still disagree<br />
on whether such legislation helps or hurts workers. It<br />
would truly be surprising if a consensus on the impact <strong>of</strong><br />
the ADA could be reached in less than 20 years.<br />
7 Lisa A. Schur, “Dead End Jobs or a Path to Economic Well Being? <strong>The</strong> Consequences<br />
<strong>of</strong> Non-Standard Work Among People with Disabilities,” Behavioral<br />
Sciences and the Law, November–December 2002, pp. 601–20; and “Barriers or<br />
Opportunities? <strong>The</strong> Causes <strong>of</strong> Contingent and Part-Time Work Among People<br />
with Disabilities,” Industrial Relations, October 2003, pp. 589–622.<br />
8 Andrew J. Houtenville and Richard B. Burkhauser, Did the Employment<br />
<strong>of</strong> People with Disabilities Decline in the 1990s, and W<strong>as</strong> the ADA Responsible? A<br />
Replication and Robustness Check <strong>of</strong> Acemoglu and Angrist (2001), Research Brief<br />
(Ithaca, NY, Cornell University Employment and Disability Institute, 2004).<br />
9 See Michele Adler, Programmatic Definitions <strong>of</strong> Disability: Policy Implications<br />
(U.S. Department <strong>of</strong> Health and Human Services, Office <strong>of</strong> Disability,<br />
Aging, and Long-Term Care Policy, 1991), on the Internet at <strong>as</strong>pe.hhs.<br />
gov/daltcp/reports/prodefes.htm (visited June 5, 2008); and Burt S. Barnow,<br />
“Policies for People with Disabilities in U.S. Employment and Training Programs,”<br />
in Jerry L. M<strong>as</strong>haw, Virginia Reno, Richard Burkhauser, and Monroe<br />
Berkowitz (eds.), Disabilities, C<strong>as</strong>h Benefits, and Work (Kalamazoo, MI, Upjohn<br />
Institute for Employment Research, 1996).<br />
10 See Saad Nagi, “Disability Concepts Revisited: Implications for Preven-<br />
Monthly Labor Review • November 2008 49
Employment and Disability<br />
tion,” in A. M. Pope and A. R. Tarlove (eds.), Disability in America: Toward<br />
a National Agenda for Prevention (W<strong>as</strong>hington, DC, National Academy Press,<br />
1991), pp. 309–27; and Saad Nagi, Towards a Common Language for Functioning,<br />
Disability, and Health (Geneva, World Health Organization, 2002).<br />
11 Richard V. Burkhauser and Andrew J. Houtenville, A Guide to Disability<br />
Statistics from the Current Population Survey—Annual Social and Economic Supplement<br />
(March CPS) (Ithaca, NY, Cornell University, Rehabilitation Research<br />
and Training Center on Disability Demographics and Statistics, 2006).<br />
12 “Uses and limitations <strong>of</strong> CPS data on work disability” (U.S. Census Bureau,<br />
undated), on the Internet at www.census.gov/hhes/www/disability/<br />
cps/cpstableexplanation.pdf (visited June 5, 2008).<br />
13 Ibid.<br />
14 Questions on earlier decennial censuses are not comparable to the ones in<br />
the 2000 census.<br />
15 <strong>The</strong> l<strong>as</strong>t two questions were <strong>as</strong>ked only <strong>of</strong> persons 16 years or older.<br />
16 An employment disability is an impairment that prevents the person from<br />
working; a stay-at-home disability is an impairment that prevents the person<br />
from leaving the home. Both types <strong>of</strong> disability are self-reported on the census<br />
form. (See William A. Erickson and Andrew J. Houtenville, A Guide to Disability<br />
Statistics from the 2000 Decennial Census (Ithaca, NY, Cornell University,<br />
Rehabilitation Research and Training Center on Disability Demographics and<br />
Statistics, 2005). <strong>The</strong> original Census Bureau analyses can be found in Sharon<br />
M. Stern, “Counting People with Disabilities: How Survey Methodology Influences<br />
Estimates in Census 2000 and the Census 2000 Supplementary Survey,”<br />
Census Bureau Staff Research Report (U.S. Census Bureau, Poverty and<br />
Health Statistics Branch, 2003), on the Internet at www.census.gov/acs/www/<br />
Downloads/ACS/finalstern.pdf (visited Apr. 19, 2005). See also Sharon Stern<br />
and Matthew Brault, “Disability Data From the American Community Survey:<br />
A Brief Examination <strong>of</strong> the Effects <strong>of</strong> a Question Redesign in 2003,” Census<br />
Bureau Staff Research Report (U.S. Census Bureau, Housing and Household<br />
Economic Statistics Division, 2005), on the Internet at www.census.gov/hhes/<br />
www/disability/ACS_disability.pdf (visited June 5, 2008).)<br />
17 <strong>The</strong> questions are on the Internet at www.census.gov/hhes/www/disability/<br />
sipp.html (visited June 5, 2008).<br />
18 Daron Acemoglu and Joshua D. Angrist, “Consequences <strong>of</strong> Employment<br />
Protection? <strong>The</strong> C<strong>as</strong>e <strong>of</strong> the Americans with Disabilities Act,” Journal <strong>of</strong> Political<br />
Economy, October 2001, pp. 915–57.<br />
19 Thom<strong>as</strong> DeLeire, “<strong>The</strong> Wage and Employment Effects <strong>of</strong> the Americans<br />
with Disabilities Act,” Journal <strong>of</strong> Human Resources, fall 2000, pp. 693–713;<br />
“Changes in Wage Discrimination Against People with Disabilities: 1984–<br />
1993,” Journal <strong>of</strong> Human Resources, winter 2001, pp. 145–58; and “<strong>The</strong> Americans<br />
with Disabilities Act and the Employment <strong>of</strong> People with Disabilities,”<br />
in Stapleton and Burkhauser (eds.), <strong>The</strong> Decline in Employment <strong>of</strong> People with<br />
Disabilities, pp. 259–77.<br />
20 Kathleen Beegle and Wendy A. Stock, “<strong>The</strong> Labor Market Effects <strong>of</strong><br />
Disability Discrimination Laws,” Journal <strong>of</strong> Human Resources, fall 2003, pp.<br />
807–59.<br />
21 <strong>The</strong> articles in question all used ordinary le<strong>as</strong>t squares regression analysis<br />
for continuous dependent variables and regression analysis, logit analysis, or<br />
probit analysis for discrete dependent variables. Estimates <strong>of</strong> regression coef-<br />
50 Monthly Labor Review • November 2008<br />
ficients are <strong>of</strong>ten bi<strong>as</strong>ed if relevant variables are omitted from the analysis<br />
or if one or more <strong>of</strong> the explanatory variables are me<strong>as</strong>ured in error. (See,<br />
for example, Jeffrey M. Wooldridge, Introductory Econometrics: A Modern Approach,<br />
4th ed. (M<strong>as</strong>on, Ohio, South Western, Cengage Learning, 2009).)<br />
Both Ace-moglu and Angrist, “Consequences <strong>of</strong> Employment Protection?”<br />
and DeLeire, “Changes in Wage Discrimination,” used a variety <strong>of</strong> specifications<br />
to test for the impact <strong>of</strong> the ADA, but they may not have had all <strong>of</strong> the<br />
relevant explanatory variables available to them. In addition, the ADA may<br />
have had an impact prior to the effective date <strong>of</strong> the Act or even prior to<br />
its enactment, and the impact may have changed over time <strong>as</strong> the rules on<br />
re<strong>as</strong>onable accommodation were interpreted by the courts. Articles that note<br />
alleged econometric problems in the analyses <strong>of</strong> Acemoglu and Angrist and<br />
<strong>of</strong> DeLeire include Tom Tolin and Martin Patwell, “A Critique <strong>of</strong> Economic<br />
Analysis <strong>of</strong> the ADA,” Disability Studies Quarterly, winter 2003, pp. 130–42;<br />
Dougl<strong>as</strong> Kruse and Lisa Schur, “Employment <strong>of</strong> People with Disabilities<br />
Following the ADA,” Industrial Relations, January 2003, pp. 31–66; and Robert<br />
Silverstein, George Julnes, and Renee Nolan, “What Policymakers Need<br />
and Must Demand from Research Regarding the Employment Rate <strong>of</strong> Persons<br />
with Disabilities,” Behavioral Sciences and the Law, May–June 2005, pp.<br />
399–448.)<br />
22 See Tolin and Patwell, “A Critique”; Kruse and Schur, “Employment <strong>of</strong><br />
People with Disabilities”; Peter Blanck, Lisa Schur, Dougl<strong>as</strong> Kruse, Susan<br />
Schwochau, and Chen Song, “Calibrating the Impact <strong>of</strong> the ADA’s Employment<br />
Provisions,” Stanford Law and Policy Review, vol. 14, no. 2, 2003, pp. 267–<br />
90; and Silverstein, Julnes, and Nolan, “What Policymakers Need.” Thom<strong>as</strong><br />
W. Hale, “<strong>The</strong> Lack <strong>of</strong> a Disability Me<strong>as</strong>ure in Today’s Current Population<br />
Survey,” Monthly Labor Review, June 2001, pp. 38–40, also makes this point,<br />
though only implicitly.<br />
23 See, for example, Ronald G. Ehrenberg and Robert S. Smith, Modern Labor<br />
Economics: <strong>The</strong>ory and Public Policy, 9th ed. (Boston, Pearson, 2005).<br />
24 See Kruse and Schur, “Employment <strong>of</strong> People with Disabilities”; and<br />
Houtenville and Burkhauser, “Did the Employment <strong>of</strong> People with Disabilities<br />
Decline?”<br />
25 Activities <strong>of</strong> daily living are defined <strong>as</strong> “the t<strong>as</strong>ks <strong>of</strong> everyday life, such <strong>as</strong><br />
eating, bathing, dressing, toileting, and transferring.” (See Joshua M. Wiener,<br />
Raymond J. Hanley, Robert Clark, and Joan F. Van Nostrand, “Me<strong>as</strong>uring the<br />
Activities <strong>of</strong> Daily Living: Comparisons Across National Surveys,” Journal <strong>of</strong><br />
Gerontology: Social Sciences, November 1990, pp. S229–37.)<br />
26 See, for example, Burkhauser, Houtenville, and Wittenberg, “A User’s<br />
Guide to Current Statistics”; Andrew J. Houtenville and Mary C. Daly,<br />
“Employment Declines among People with Disabilities,” in Stapleton and<br />
Burkhauser (eds.), <strong>The</strong> Decline in Employment <strong>of</strong> People with Disabilities, pp. 87–<br />
124; Richard V. Burkhauser and David C. Stapleton, “Review <strong>of</strong> the Evidence<br />
and Its Implications for Policy Change,” in Stapleton and Burkhauser (eds.), <strong>The</strong><br />
Decline in Employment <strong>of</strong> People with Disabilities, pp. 369–405; David C. Stapleton,<br />
Richard V. Burkhauser, and Andrew J. Houtenville, H<strong>as</strong> the Employment<br />
Rate <strong>of</strong> People with Disabilities Declined? Research Brief (Ithaca, NY, Cornell<br />
University, Employment and Disability Institute, 2004); and Elaine M. Maag<br />
and David C. Wittenburg, Real Trends or Me<strong>as</strong>urement Problems? Disability and<br />
Employment Trends from the Survey <strong>of</strong> Income and Program Participation (W<strong>as</strong>hington,<br />
DC, <strong>The</strong> Urban Institute, 2003).<br />
27 Hale, “<strong>The</strong> Lack <strong>of</strong> a Disability Me<strong>as</strong>ure.”<br />
28 Stapleton, Burkhauser, and Houtenville, H<strong>as</strong> the Employment Rate <strong>of</strong> People<br />
with Disabilities Declined?
Visual Essay: High School Students’ Time Use<br />
How high school students use time: a visual essay<br />
High school students have many demands<br />
on their time, and how they choose to<br />
spend that time on any given day depends<br />
on a variety <strong>of</strong> factors, such <strong>as</strong> the age and the sex<br />
<strong>of</strong> the student. Data from the American Time Use<br />
Survey (ATUS) show how much time per day, on<br />
average, high school students devote to leisure activities,<br />
household activities, work, and homework.<br />
ATUS data also reveal differences in students’ use <strong>of</strong><br />
time between weekdays and weekend days.<br />
In the ATUS, which is administered to individuals<br />
age 15 and older, survey respondents are <strong>as</strong>ked<br />
about the activities they performed “yesterday.” <strong>The</strong><br />
survey obtains information about respondents’ pri-<br />
Mary Dorinda Allard<br />
mary (or main) activities. (Information about other<br />
activities they were engaged in during these primary<br />
activities is not collected.) Data were collected<br />
throughout 2003–07; however, for this essay, data are<br />
restricted to months when most high school students<br />
attend school—that is, September through May.<br />
All data in this visual essay refer to students ages 15<br />
to 19 who were enrolled full time in high school. While<br />
most <strong>of</strong> the data used here are for those in grades 9<br />
through 12, a small number <strong>of</strong> eighth-grade students<br />
may be included in the estimates.<br />
This essay w<strong>as</strong> prepared by Mary Dorinda Allard, an<br />
economist in the Division <strong>of</strong> Labor Force Statistics, Bureau<br />
<strong>of</strong> Labor Statistics. E-mail: atusinfo@bls.gov.<br />
Monthly Labor Review • November 2008 51
Visual Essay: High School Students’ Time Use<br />
1. High school students divided the hours <strong>of</strong> an average schoolday among many activities<br />
Sleep<br />
52 Monthly Labor Review • November 2008<br />
Other<br />
Working<br />
Eating<br />
Grooming<br />
Travel<br />
Educational activities<br />
Leisure and sports<br />
NOTE: Estimates are for September through May, 2003–07. Schooldays are nonholiday weekdays on which high school students ages 15 to<br />
19 attended cl<strong>as</strong>s.<br />
�<br />
�<br />
Together, sleeping and engaging in educational activities accounted for almost two-thirds <strong>of</strong> high school students’<br />
time on an average schoolday. On average, students slept for 8.1 hours and performed educational activities,<br />
such <strong>as</strong> attending cl<strong>as</strong>s and doing homework, for 7.5 hours.<br />
Students split the remaining time among a range <strong>of</strong> activities: leisure and sports activities (4.0 hours); travel (1.1<br />
hours); grooming (0.8 hour); eating (0.8 hour); working (0.5 hour); and other activities, such <strong>as</strong> volunteering,<br />
shopping, and doing household activities (1.2 hours).
2. Some activities were more popular among male high school students, and other activities were<br />
more popular among female high school students<br />
�<br />
�<br />
�<br />
Watching TV<br />
Socializing<br />
Games/computer<br />
Homework<br />
Sports/exercise<br />
Household activities<br />
Shopping<br />
Working<br />
Volunteering<br />
Reading<br />
Male high school students<br />
Female high school students<br />
0 10 20 30 40 50 60 70 80 90 100<br />
Percent <strong>of</strong> high school students who did the activity on an average day<br />
NOTE: Estimates are for September through May, 2003–07. Data are averages <strong>of</strong> all days <strong>of</strong> the week for high school students<br />
ages 15 to 19.<br />
Seventy-nine percent <strong>of</strong> male high school students watched TV on an average day, compared with 75 percent <strong>of</strong><br />
female high school students.<br />
Female high school students were more likely than male high school students to do homework on an average<br />
day—50 percent <strong>of</strong> females did so, compared with 37 percent <strong>of</strong> males. Female students also were more likely<br />
than male students to do household activities (such <strong>as</strong> housework, cooking, and lawn care)—54 percent <strong>of</strong> females<br />
did so on an average day, compared with 37 percent <strong>of</strong> males.<br />
Male high school students were more likely than their female counterparts to engage in sports and exercise<br />
activities on an average day: 37 percent <strong>of</strong> males played sports, where<strong>as</strong> 21 percent <strong>of</strong> females did. Forty-three<br />
percent <strong>of</strong> male students and 27 percent <strong>of</strong> female students played games and/or used a computer for leisure on<br />
an average day.<br />
Monthly Labor Review • November 2008 53
Visual Essay: High School Students’ Time Use<br />
3. Male and female high school students spent their leisure time differently<br />
Average hours per day Average hours per day<br />
6.0<br />
5.7 hours per day<br />
6.0<br />
�<br />
�<br />
5.0<br />
4.0<br />
3.0<br />
2.0<br />
1.0<br />
0.0<br />
Other<br />
Games/computer<br />
Socializing<br />
Sports/exercise<br />
Reading/relaxing<br />
Watching TV<br />
54 Monthly Labor Review • November 2008<br />
4.5 hours per day<br />
Other<br />
Games/computer<br />
Socializing<br />
Sports/exercise<br />
Reading/relaxing<br />
Watching TV<br />
Male high school students Female high school students<br />
NOTE: Estimates are for September through May, 2003–07. Data are averages <strong>of</strong> all days <strong>of</strong> the week for high school students ages 15 to 19.<br />
Male high school students spent 1.2 hours more doing leisure activities on an average day than did female high<br />
school students (5.7 hours, compared with 4.5 hours).<br />
Male high school students spent more time than female high school students watching TV (2.2 hours, compared<br />
with 1.9 hours), playing games and/or using a computer for leisure (1.1 hours, compared with 0.5 hour), and<br />
doing sports activities (0.9 hour, compared with 0.4 hour). Female high school students spent slightly more time<br />
socializing (1.0 hour) than did their male counterparts (0.8 hour).<br />
5.0<br />
4.0<br />
3.0<br />
2.0<br />
1.0<br />
0.0
4. High school students slept more on Sundays than on any other day <strong>of</strong> the week<br />
Mondays–Thursdays<br />
NOTE: Estimates are for September through May, 2003–07. Weekday holidays are excluded. All estimates are for high school students ages 15<br />
to 19. A day is defined <strong>as</strong> beginning at 12 a.m. and ending at 11:59 p.m.<br />
�<br />
�<br />
�<br />
Fridays<br />
Saturdays<br />
Sundays<br />
0.0 2.0 4.0 6.0<br />
Average hours per day<br />
8.0 10.0 12.0<br />
High school students slept more on Sundays (10.7 hours) than they did on any other day <strong>of</strong> the week, and<br />
they slept le<strong>as</strong>t on Fridays (8.4 hours). <strong>The</strong>y slept an average <strong>of</strong> 10.0 hours on Saturdays and 8.7 hours per day<br />
Monday through Thursday.<br />
High school students slept later in the morning on weekend days than they did on weekdays. At 7 a.m. on<br />
weekdays, about 25 percent <strong>of</strong> high school students were <strong>as</strong>leep, compared with about 85 percent on Saturdays<br />
and Sundays.<br />
On average, high school students went to sleep later on Friday and Saturday nights than they did Sunday<br />
through Thursday. At 11 p.m. Sunday through Thursday, about 70 percent <strong>of</strong> high school students were <strong>as</strong>leep,<br />
<strong>as</strong> opposed to about 45 percent on Friday and Saturday nights.<br />
Monthly Labor Review • November 2008 55
Visual Essay: High School Students’ Time Use<br />
5. High school students spent different amounts <strong>of</strong> time doing activities on weekdays and weekend days<br />
Average hours spent<br />
doing the activity<br />
6.0<br />
5.0<br />
4.0<br />
3.0<br />
2.0<br />
1.0<br />
Work,<br />
weekend day<br />
Work,<br />
weekday<br />
0.0<br />
0.0<br />
0 10 20 30 40 50 60 70 80 90 100<br />
Percent <strong>of</strong> high school students who did the activity<br />
56 Monthly Labor Review • November 2008<br />
Homework,<br />
weekend day<br />
Homework,<br />
weekday<br />
Watching TV,<br />
weekend day<br />
Watching TV,<br />
weekday<br />
Average hours spent<br />
doing the activity<br />
6.0<br />
NOTE: Estimates are for September through May, 2003–07. Weekday holidays are excluded. All estimates are for high school students ages 15<br />
to 19.<br />
�<br />
�<br />
�<br />
About 15 percent <strong>of</strong> high school students worked on an average weekday and an average weekend day. On days<br />
that students worked, they spent more time doing so on weekend days than on weekdays (5.0 hours, compared<br />
with 3.5 hours).<br />
Forty-nine percent <strong>of</strong> high school students did homework on an average weekday, compared with 30 percent on<br />
an average weekend day. On days that students did homework, they studied for 2.4 hours on weekend days and<br />
1.7 hours per day on weekdays.<br />
Seventy-five percent <strong>of</strong> high school students watched television on an average weekday, compared with 81 percent<br />
on an average weekend day. High school students who watched television did so for almost an hour longer<br />
on weekend days (3.3 hours) than they did on weekdays (2.4 hours).<br />
5.0<br />
4.0<br />
3.0<br />
2.0<br />
1.0
6. High school students with a parent who had a bachelor’s degree or higher were more likely to do homework<br />
on an average day<br />
Percent <strong>of</strong> high school<br />
students<br />
100<br />
90<br />
80<br />
70<br />
60<br />
50<br />
40<br />
30<br />
20<br />
10<br />
0<br />
2 hours or more<br />
Between 1 and 2 hours<br />
Less than 1 hour<br />
Did not do homework<br />
Students whose parent(s) had less than<br />
a bachelor’s degree<br />
39 percent<br />
did<br />
homework<br />
2 hours or more<br />
Between 1 and 2 hours<br />
Less than 1 hour<br />
Did not do homework<br />
Students with a parent who had<br />
a bachelor’s degree or higher<br />
Percent <strong>of</strong> high school<br />
students<br />
52 percent<br />
did<br />
homework<br />
NOTE: Estimates are for September through May, 2003–07, and are for high school students ages 15 to 19 who lived with at le<strong>as</strong>t one parent.<br />
Data are averages <strong>of</strong> all days <strong>of</strong> the week. If the high school student lived with two parents, the educational attainment <strong>of</strong> parents w<strong>as</strong> determined<br />
by the parent with the highest educational attainment.<br />
�<br />
�<br />
On an average day, 39 percent <strong>of</strong> high school students whose parent(s) had less than a bachelor’s degree did<br />
homework, compared with 52 percent <strong>of</strong> those with a parent who had a bachelor’s degree or higher.<br />
In addition to being more likely to do homework on an average day, high school students whose parent(s) had<br />
higher educational attainment spent more time, on average, doing homework. Twenty-four percent <strong>of</strong> students<br />
with a parent holding a bachelor’s degree or higher spent 2 or more hours doing homework, compared with 13<br />
percent <strong>of</strong> those whose parent(s) held less than a bachelor’s degree.<br />
100<br />
90<br />
80<br />
70<br />
60<br />
50<br />
40<br />
30<br />
20<br />
10<br />
Monthly Labor Review • November 2008 57<br />
0
Visual Essay: High School Students’ Time Use<br />
7. <strong>The</strong> activities high school students did varied by age<br />
Driving<br />
Household activities<br />
Shopping<br />
Games/computer<br />
Sports/exercise<br />
Working<br />
Volunteering<br />
58 Monthly Labor Review • November 2008<br />
Ages 17–19<br />
Ages 15–16<br />
0 10 20 30 40 50 60 70 80 90 100<br />
Percent <strong>of</strong> high school students who did the activity on an average day<br />
NOTE: Estimates are for September through May, 2003–07. Estimates are averages <strong>of</strong> all days <strong>of</strong> the week for high school students ages 15<br />
to 19.<br />
�<br />
�<br />
�<br />
Fifty-one percent <strong>of</strong> high school students ages 17 to 19 drove on an average day, compared with 25 percent <strong>of</strong><br />
students ages 15 to 16.<br />
Older high school students were more likely to work, shop, and do volunteer activities on an average day than<br />
were younger high school students. Among students who worked, those ages 17 to 19 worked almost an hour<br />
longer than students ages 15 to 16—4.4 hours, compared with 3.5 hours. Regardless <strong>of</strong> age, high school students<br />
who volunteered spent slightly more than 2 hours doing so, and those who shopped did so for about 1 hour.<br />
High school students ages 15 to 16 were more likely than those ages 17 to 19 to do household activities, play<br />
games and/or use a computer for leisure, and engage in sports and exercise activities.
8. <strong>The</strong>re are many activities that employed high school students were less likely to do on workdays than on<br />
nonworkdays<br />
Watching TV<br />
Socializing<br />
Homework<br />
Household activities<br />
Games/computer<br />
Sports/exercise<br />
Shopping<br />
Not employed<br />
Employed, nonworkday<br />
Employed, workday<br />
0 10 20 30 40 50 60 70 80 90 100<br />
Percent <strong>of</strong> high school students who did the activity on an average day<br />
NOTE: Estimates are for September through May, 2003–07, and are for high school students ages 15 to 19. Workdays are days on which high<br />
school students did some paid work or income-generating activity, such <strong>as</strong> babysitting.<br />
�<br />
�<br />
�<br />
�<br />
Sixty-five percent <strong>of</strong> employed students watched TV on days that they worked. By contr<strong>as</strong>t, 80 percent <strong>of</strong> students<br />
without a job watched TV on an average day. Among those who watched TV, employed students spent about an<br />
hour less doing so on workdays than did students without a job (1.9 hours, compared with 2.8 hours).<br />
On nonworkdays, 29 percent <strong>of</strong> employed high school students participated in sports activities. However, on<br />
workdays, only 19 percent <strong>of</strong> employed students played sports.<br />
Forty-six percent <strong>of</strong> high school students who were not employed did homework on an average day, compared<br />
with about 40 percent <strong>of</strong> those who were employed. Employed high school students were about <strong>as</strong> likely to do<br />
homework on workdays <strong>as</strong> on nonworkdays.<br />
Forty-one percent <strong>of</strong> employed high school students shopped on nonworkdays, where<strong>as</strong> 26 percent shopped on<br />
workdays. Thirty percent <strong>of</strong> students who were not employed shopped on an average day.<br />
Monthly Labor Review • November 2008 59
Visual Essay: High School Students’ Time Use<br />
9. Employed high school students were less likely to eat with one or more parents on weekday workdays<br />
Weekday<br />
Weekend day<br />
60 Monthly Labor Review • November 2008<br />
Not employed<br />
Employed, nonworkday<br />
Employed, workday<br />
0 10 20 30 40 50 60 70 80 90 100<br />
Percent who ate with a parent<br />
NOTE: Estimates are for September through May, 2003–07, and are for high school students ages 15 to 19. Weekday holidays are excluded.<br />
Workdays are those on which high school students did some paid work or income-generating activity, such <strong>as</strong> babysitting.<br />
�<br />
�<br />
Employed high school students were less likely to eat with a parent sometime during the day on weekdays they<br />
worked than on weekdays they did not work. (Thirty-five percent <strong>of</strong> employed high school students ate with a<br />
parent on an average weekday on which the students worked, compared with 60 percent on a weekday they did<br />
not work.) By contr<strong>as</strong>t, 52 percent <strong>of</strong> those who were not employed ate with a parent on an average weekday.<br />
On an average weekend day, more than 50 percent <strong>of</strong> high school students ate with a parent, regardless <strong>of</strong> the<br />
student’s employment status.
10. <strong>The</strong> company that high school students kept varied by activity<br />
Percent <strong>of</strong> time doing activity<br />
that w<strong>as</strong> spent alone<br />
Homework<br />
Games/computer<br />
Household activities<br />
Watching TV<br />
Travel<br />
Eating<br />
Sports/exercise<br />
Shopping<br />
Percent <strong>of</strong> time doing activity<br />
that w<strong>as</strong> spent with others<br />
(excluding family)<br />
Percent <strong>of</strong> time doing activity<br />
that w<strong>as</strong> spent with family<br />
members<br />
0 10 20 30 40 50 60 70 80 90 100<br />
Percent <strong>of</strong> total time spent in the activity on an average day<br />
NOTE: Estimates are for September through May, 2003–07. Estimates are averages <strong>of</strong> all days <strong>of</strong> the week for high school students ages 15 to 19.<br />
Percent spent with “others” includes time spent with friends, neighbors/acquaintances, and other household and non-household members.<br />
�<br />
�<br />
�<br />
Shopping w<strong>as</strong> the activity that high school students were most likely to do with family members. Of the time<br />
that high school students spent shopping, they spent about 61 percent with family members; 26 percent <strong>of</strong> the<br />
time, they were with others. Only 13 percent <strong>of</strong> students’ shopping time w<strong>as</strong> spent alone.<br />
High school students typically ate with others <strong>as</strong> well. Students were alone only 15 percent <strong>of</strong> the time they spent<br />
eating.<br />
Homework w<strong>as</strong> typically done alone. High school students spent 77 percent <strong>of</strong> homework time alone; about 16<br />
percent <strong>of</strong> homework time w<strong>as</strong> spent with family members.<br />
Monthly Labor Review • November 2008 61
Nominations Sought for 2009 Julius Shiskin Award<br />
Nominations are invited for the annual Julius Shiskin Memorial Award for Economic Statistics.<br />
<strong>The</strong> Award is given in recognition <strong>of</strong> unusually original and important contributions<br />
in the development <strong>of</strong> economic statistics or in the use <strong>of</strong> statistics in interpreting the economy.<br />
Contributions are recognized for statistical research, development <strong>of</strong> statistical tools,<br />
application <strong>of</strong> information technology techniques, use <strong>of</strong> economic statistical programs,<br />
management <strong>of</strong> statistical programs, or developing public understanding <strong>of</strong> me<strong>as</strong>urement<br />
issues. <strong>The</strong> Award w<strong>as</strong> established in 1980 by the W<strong>as</strong>hington Statistical Society (WSS) and<br />
is now cosponsored by the WSS, the National Association for Business Economics, and the<br />
Business and Economics Statistics Section <strong>of</strong> the American Statistical Association (ASA).<br />
<strong>The</strong> 2008 award recipients were William R. Bell and Robert M. Groves. Dr. Bell w<strong>as</strong> recognized<br />
for his innovative statistical research that led to improved economic statistics through<br />
important contributions to the theory and practice <strong>of</strong> se<strong>as</strong>onal adjustment, small area estimation,<br />
and time series modeling; Dr. Groves w<strong>as</strong> recognized for his innovative statistical<br />
research that led to improved economic statistics through important contributions to the<br />
theory and practice <strong>of</strong> survey methods for the conduct <strong>of</strong> sample surveys <strong>of</strong> both households<br />
and establishments.<br />
Because the program w<strong>as</strong> initiated many years ago, statisticians and economists <strong>of</strong>ten <strong>as</strong>k,<br />
“Who w<strong>as</strong> Julius Shiskin?” At the time <strong>of</strong> his death in 1978, “Julie” w<strong>as</strong> the Commissioner<br />
<strong>of</strong> the Bureau <strong>of</strong> Labor Statistics (BLS) and earlier served <strong>as</strong> the Chief Statistician at the Office<br />
<strong>of</strong> Management and Budget (OMB), and the Chief Economic Statistician and Assistant<br />
Director <strong>of</strong> the Census Bureau. Throughout his career, he w<strong>as</strong> known <strong>as</strong> an innovator. At<br />
Census he w<strong>as</strong> instrumental in developing an electronic computer method for se<strong>as</strong>onal adjustment.<br />
In 1961, he published Signals <strong>of</strong> Recession and Recovery, which laid the groundwork<br />
for the calculation <strong>of</strong> monthly economic indicators, and he developed the monthly Census<br />
report Business Conditions Digest to disseminate them to the public. In 1969, he w<strong>as</strong> appointed<br />
Chief Statistician at OMB where he developed the policies and procedures that govern the<br />
rele<strong>as</strong>e <strong>of</strong> key economic indicators (Statistical Policy Directive Number 3), and originated a<br />
Social Indicators report. In 1973, he w<strong>as</strong> selected to head BLS where he w<strong>as</strong> instrumental in<br />
preserving the integrity and independence <strong>of</strong> the BLS labor force data and directed the most<br />
comprehensive revision in the history <strong>of</strong> the Consumer Price Index (CPI), which included a<br />
new CPI for all urban consumers.<br />
Nominations for the 2009 award are now being accepted. Individuals and groups in the public<br />
or private sector from any country can be nominated. <strong>The</strong> award will be presented with an<br />
honorarium <strong>of</strong> $750 plus additional recognition from the sponsors. A nomination form and a<br />
list <strong>of</strong> all previous recipients are available on the ASA Website at www.amstat.org/sections/<br />
bus_econ/shiskin.html. For questions or more information, ple<strong>as</strong>e contact Steven Paben,<br />
Julius Shiskin Award Committee Secretary, via e-mail at paben.steven@bls.gov or phone at<br />
202–691–6147.<br />
Completed nominations must be received by April 1, 2009.
Current Labor Statistics<br />
Monthly Labor Review<br />
November 2008<br />
NOTE: Many <strong>of</strong> the statistics in the<br />
following pages were subsequently<br />
revised. <strong>The</strong>se pages have not been<br />
updated to reflect the revisions.<br />
To obtain BLS data that reflect all revisions, see<br />
http://www.bls.gov/data/home.htm<br />
For the latest set <strong>of</strong> "Current Labor Statistics,"<br />
see http://www.bls.gov/opub/mlr/curlabst.htm
Current Labor Statistics<br />
Notes on current labor statistics ............... 64<br />
Comparative indicators<br />
1. Labor market indicators.................................................... 76<br />
2. Annual and quarterly percent changes in<br />
compensation, prices, and productivity.......................... 77<br />
3. Alternative me<strong>as</strong>ures <strong>of</strong> wages and<br />
compensation changes................................................... 77<br />
Labor force data<br />
4. Employment status <strong>of</strong> the population,<br />
se<strong>as</strong>onally adjusted ........................................................ 78<br />
5. Selected employment indicators, se<strong>as</strong>onally adjusted ........ 79<br />
6. Selected unemployment indicators, se<strong>as</strong>onally adjusted.... 80<br />
7. Duration <strong>of</strong> unemployment, se<strong>as</strong>onally adjusted............... 80<br />
8. Unemployed persons by re<strong>as</strong>on for unemployment,<br />
se<strong>as</strong>onally adjusted ........................................................ 81<br />
9. Unemployment rates by sex and age,<br />
se<strong>as</strong>onally adjusted ........................................................ 81<br />
10. Unemployment rates by State, se<strong>as</strong>onally adjusted............ 82<br />
11. Employment <strong>of</strong> workers by State,<br />
se<strong>as</strong>onally adjusted......................................................... 82<br />
12. Employment <strong>of</strong> workers by industry,<br />
se<strong>as</strong>onally adjusted......................................................... 83<br />
13. Average weekly hours by industry, se<strong>as</strong>onally adjusted...... 86<br />
14. Average hourly earnings by industry,<br />
se<strong>as</strong>onally adjusted......................................................... 87<br />
15. Average hourly earnings by industry................................. 88<br />
16. Average weekly earnings by industry ................................ 89<br />
17. Diffusion indexes <strong>of</strong> employment change,<br />
se<strong>as</strong>onally adjusted ..................................................... 90<br />
18. Job openings levels and rates, by industry and regions,<br />
se<strong>as</strong>onally adjusted........................................................ 91<br />
19. Hires levels and rates by industry and region,<br />
se<strong>as</strong>onally adjusted........................................................ 91<br />
20. Separations levels and rates by industry and region,<br />
se<strong>as</strong>onally adjusted......................................................... 92<br />
21. Quits levels and rates by industry and region,<br />
se<strong>as</strong>onally adjusted........................................................ 92<br />
22. Quarterly Census <strong>of</strong> Employment and Wages,<br />
10 largest counties ........................................................ 93<br />
23. Quarterly Census <strong>of</strong> Employment and Wages, by State .. 95<br />
24. Annual data: Quarterly Census <strong>of</strong> Employment<br />
and Wages, by ownership .............................................. 96<br />
25. Annual data: Quarterly Census <strong>of</strong> Employment and Wages,<br />
establishment size and employment, by supersector...... 97<br />
26. Annual data: Quarterly Census <strong>of</strong> Employment and<br />
Wages, by metropolitan area ........................................ 98<br />
27. Annual data: Employment status <strong>of</strong> the population.......... 103<br />
28. Annual data: Employment levels by industry ................. 103<br />
29. Annual data: Average hours and earnings level,<br />
by industry.................................................................... 104<br />
Labor compensation and collective<br />
bargaining data<br />
30. Employment Cost Index, compensation ..........................105<br />
31. Employment Cost Index, wages and salaries .................... 107<br />
32. Employment Cost Index, benefits, private industry ......... 109<br />
33. Employment Cost Index, private industry workers,<br />
by bargaining status, and region .................................... 110<br />
34. National Compensation Survey, retirement benefits,<br />
private industry ............................................................ 111<br />
35. National Compensation Survey, health insurance,<br />
private industry.............................................................. 114<br />
36. National Compensation Survey, selected benefits,<br />
private industry ............................................................. 116<br />
37. Work stoppages involving 1,000 workers or more ............ 116<br />
Price data<br />
38. Consumer Price Index: U.S. city average, by expenditure<br />
category and commodity and service groups................. 117<br />
39. Consumer Price Index: U.S. city average and<br />
local data, all items ....................................................... 120<br />
40. Annual data: Consumer Price Index, all items<br />
and major groups........................................................... 121<br />
41. Producer Price Indexes by stage <strong>of</strong> processing .................. 122<br />
42. Producer Price Indexes for the net output <strong>of</strong> major<br />
industry groups ............................................................. 123<br />
43. Annual data: Producer Price Indexes<br />
by stage <strong>of</strong> processing.................................................... 124<br />
44. U.S. export price indexes by end-use category................... 124<br />
45. U.S. import price indexes by end-use category...................125<br />
46. U.S. international price indexes for selected<br />
categories <strong>of</strong> services ..................................................... 125<br />
Productivity data<br />
47. Indexes <strong>of</strong> productivity, hourly compensation,<br />
and unit costs, data se<strong>as</strong>onally adjusted ......................... 126<br />
48. Annual indexes <strong>of</strong> multifactor productivity....................... 127<br />
Annual indexes <strong>of</strong> productivity, hourly compensation,<br />
unit costs, and prices ..................................................... 128<br />
50. Annual indexes <strong>of</strong> output per hour for select industries.... 129<br />
International comparisons data<br />
51. Unemployment rates in 10 countries,<br />
se<strong>as</strong>onally adjusted ........................................................ 133<br />
52. Annual data: Employment status <strong>of</strong> the civilian<br />
working-age population, 10 countries........................... 134<br />
53. Annual indexes <strong>of</strong> productivity and related me<strong>as</strong>ures,<br />
16 economies................................................................ 135<br />
Injury and Illness data<br />
54. Annual data: Occupational injury and illness.................... 137<br />
55. Fatal occupational injuries by event or exposure ............... 139<br />
Monthly Labor Review • November 2008 63
Current Labor Statistics<br />
Notes on Current Labor Statistics<br />
This section <strong>of</strong> the Review presents the<br />
principal statistical series collected and<br />
calculated by the Bureau <strong>of</strong> Labor Statistics:<br />
series on labor force; employment; unemployment;<br />
labor compensation; consumer,<br />
producer, and international prices; productivity;<br />
international comparisons; and injury<br />
and illness statistics. In the notes that follow,<br />
the data in each group <strong>of</strong> tables are briefly<br />
described; key definitions are given; notes<br />
on the data are set forth; and sources <strong>of</strong> additional<br />
information are cited.<br />
General notes<br />
<strong>The</strong> following notes apply to several tables<br />
in this section:<br />
Se<strong>as</strong>onal adjustment. Certain monthly<br />
and quarterly data are adjusted to eliminate<br />
the effect on the data <strong>of</strong> such factors <strong>as</strong> climatic<br />
conditions, industry production schedules,<br />
opening and closing <strong>of</strong> schools, holiday<br />
buying periods, and vacation practices, which<br />
might prevent short-term evaluation <strong>of</strong> the<br />
statistical series. Tables containing data that<br />
have been adjusted are identified <strong>as</strong> “se<strong>as</strong>onally<br />
adjusted.” (All other data are not se<strong>as</strong>onally<br />
adjusted.) Se<strong>as</strong>onal effects are estimated<br />
on the b<strong>as</strong>is <strong>of</strong> current and p<strong>as</strong>t experiences.<br />
When new se<strong>as</strong>onal factors are computed<br />
each year, revisions may affect se<strong>as</strong>onally<br />
adjusted data for several preceding years.<br />
Se<strong>as</strong>onally adjusted data appear in tables<br />
1–14, 17–21, 48, and 52. Se<strong>as</strong>onally adjusted<br />
labor force data in tables 1 and 4–9 and se<strong>as</strong>onally<br />
adjusted establishment survey data<br />
shown in tables 1, 12–14, and 17 are revised<br />
in the March 2007 Review. A brief explanation<br />
<strong>of</strong> the se<strong>as</strong>onal adjustment methodology<br />
appears in “Notes on the data.”<br />
Revisions in the productivity data in table<br />
54 are usually introduced in the September<br />
issue. Se<strong>as</strong>onally adjusted indexes and percent<br />
changes from month-to-month and<br />
quarter-to-quarter are published for numerous<br />
Consumer and Producer Price Index<br />
series. However, se<strong>as</strong>onally adjusted indexes<br />
are not published for the U.S. average All-<br />
Items CPI. Only se<strong>as</strong>onally adjusted percent<br />
changes are available for this series.<br />
Adjustments for price changes. Some<br />
data—such <strong>as</strong> the “real” earnings shown in<br />
table 14—are adjusted to eliminate the effect<br />
<strong>of</strong> changes in price. <strong>The</strong>se adjustments are<br />
made by dividing current-dollar values by<br />
the Consumer Price Index or the appropriate<br />
component <strong>of</strong> the index, then multiplying<br />
by 100. For example, given a current hourly<br />
wage rate <strong>of</strong> $3 and a current price index<br />
number <strong>of</strong> 150, where 1982 = 100, the hourly<br />
rate expressed in 1982 dollars is $2 ($3/150<br />
x 100 = $2). <strong>The</strong> $2 (or any other resulting<br />
64 Monthly Labor Review • November 2008<br />
values) are described <strong>as</strong> “real,” “constant,” or<br />
“1982” dollars.<br />
Sources <strong>of</strong> information<br />
Data that supplement the tables in this section<br />
are published by the Bureau in a variety<br />
<strong>of</strong> sources. Definitions <strong>of</strong> each series and<br />
notes on the data are contained in later sections<br />
<strong>of</strong> these Notes describing each set <strong>of</strong><br />
data. For detailed descriptions <strong>of</strong> each data<br />
series, see BLS Handbook <strong>of</strong> Methods, Bulletin<br />
2490. Users also may wish to consult Major<br />
Programs <strong>of</strong> the Bureau <strong>of</strong> Labor Statistics,<br />
Report 919. News rele<strong>as</strong>es provide the latest<br />
statistical information published by the<br />
Bureau; the major recurring rele<strong>as</strong>es are<br />
published according to the schedule appearing<br />
on the back cover <strong>of</strong> this issue.<br />
More information about labor force,<br />
employment, and unemployment data and<br />
the household and establishment surveys<br />
underlying the data are available in the<br />
Bureau’s monthly publication, Employment<br />
and Earnings. Historical unadjusted and<br />
se<strong>as</strong>onally adjusted data from the household<br />
survey are available on the Internet:<br />
www.bls.gov/cps/<br />
Historically comparable unadjusted and se<strong>as</strong>onally<br />
adjusted data from the establishment<br />
survey also are available on the Internet:<br />
www.bls.gov/ces/<br />
Additional information on labor force data<br />
for are<strong>as</strong> below the national level are provided<br />
in the BLS annual report, Geographic<br />
Pr<strong>of</strong>ile <strong>of</strong> Employment and Unemployment.<br />
For a comprehensive discussion <strong>of</strong> the<br />
Employment Cost Index, see Employment<br />
Cost Indexes and Levels, 1975–95, BLS Bulletin<br />
2466. <strong>The</strong> most recent data from the<br />
Employee Benefits Survey appear in the following<br />
Bureau <strong>of</strong> Labor Statistics bulletins:<br />
Employee Benefits in Medium and Large Firms;<br />
Employee Benefits in Small Private Establishments;<br />
and Employee Benefits in State and Local<br />
Governments.<br />
More detailed data on consumer and<br />
producer prices are published in the monthly<br />
periodicals, <strong>The</strong> CPI Detailed Report and Producer<br />
Price Indexes. For an overview <strong>of</strong> the<br />
1998 revision <strong>of</strong> the CPI, see the December<br />
1996 issue <strong>of</strong> the Monthly Labor Review. Additional<br />
data on international prices appear<br />
in monthly news rele<strong>as</strong>es.<br />
Listings <strong>of</strong> industries for which productivity<br />
indexes are available may be found on<br />
the Internet:<br />
www.bls.gov/lpc/<br />
For additional information on international<br />
comparisons data, see Interna-<br />
tional Comparisons <strong>of</strong> Unemployment, Bulletin<br />
1979.<br />
Detailed data on the occupational injury<br />
and illness series are published in Occupational<br />
Injuries and Illnesses in the United States,<br />
by Industry, a BLS annual bulletin.<br />
Finally, the Monthly Labor Review carries<br />
analytical articles on annual and longer term<br />
developments in labor force, employment,<br />
and unemployment; employee compensation<br />
and collective bargaining; prices; productivity;<br />
international comparisons; and injury<br />
and illness data.<br />
Symbols<br />
n.e.c. = not elsewhere cl<strong>as</strong>sified.<br />
n.e.s. = not elsewhere specified.<br />
p = preliminary. To incre<strong>as</strong>e<br />
the timeliness <strong>of</strong> some series,<br />
preliminary figures are issued<br />
b<strong>as</strong>ed on representative but<br />
incomplete returns.<br />
r = revised. Generally, this revision<br />
reflects the availability <strong>of</strong> later<br />
data, but also may reflect other<br />
adjustments.<br />
Comparative Indicators<br />
(Tables 1–3)<br />
Comparative indicators tables provide an<br />
overview and comparison <strong>of</strong> major bls statistical<br />
series. Consequently, although many<br />
<strong>of</strong> the included series are available monthly,<br />
all me<strong>as</strong>ures in these comparative tables are<br />
presented quarterly and annually.<br />
Labor market indicators include employment<br />
me<strong>as</strong>ures from two major surveys<br />
and information on rates <strong>of</strong> change in<br />
compensation provided by the Employment<br />
Cost Index (ECI) program. <strong>The</strong> labor force<br />
participation rate, the employment-population<br />
ratio, and unemployment rates for major<br />
demographic groups b<strong>as</strong>ed on the Current<br />
Population (“household”) Survey are presented,<br />
while me<strong>as</strong>ures <strong>of</strong> employment and<br />
average weekly hours by major industry sector<br />
are given using nonfarm payroll data. <strong>The</strong><br />
Employment Cost Index (compensation),<br />
by major sector and by bargaining status, is<br />
chosen from a variety <strong>of</strong> BLS compensation<br />
and wage me<strong>as</strong>ures because it provides a<br />
comprehensive me<strong>as</strong>ure <strong>of</strong> <strong>employer</strong> costs for<br />
hiring labor, not just outlays for wages, and it<br />
is not affected by employment shifts among<br />
occupations and industries.<br />
Data on changes in compensation, prices,<br />
and productivity are presented in table 2.<br />
Me<strong>as</strong>ures <strong>of</strong> rates <strong>of</strong> change <strong>of</strong> compensation
and wages from the Employment Cost Index<br />
program are provided for all civilian nonfarm<br />
workers (excluding Federal and household<br />
workers) and for all private nonfarm workers.<br />
Me<strong>as</strong>ures <strong>of</strong> changes in consumer prices for<br />
all urban consumers; producer prices by stage<br />
<strong>of</strong> processing; overall prices by stage <strong>of</strong> processing;<br />
and overall export and import price<br />
indexes are given. Me<strong>as</strong>ures <strong>of</strong> productivity<br />
(output per hour <strong>of</strong> all persons) are provided<br />
for major sectors.<br />
Alternative me<strong>as</strong>ures <strong>of</strong> wage and compensation<br />
rates <strong>of</strong> change, which reflect the<br />
overall trend in labor costs, are summarized<br />
in table 3. Differences in concepts and scope,<br />
related to the specific purposes <strong>of</strong> the series,<br />
contribute to the variation in changes among<br />
the individual me<strong>as</strong>ures.<br />
Notes on the data<br />
Definitions <strong>of</strong> each series and notes on the<br />
data are contained in later sections <strong>of</strong> these<br />
notes describing each set <strong>of</strong> data.<br />
Employment and<br />
Unemployment Data<br />
(Tables 1; 4–29)<br />
Household survey data<br />
Description <strong>of</strong> the series<br />
Employment data in this section are obtained<br />
from the Current Population Survey,<br />
a program <strong>of</strong> personal interviews conducted<br />
monthly by the Bureau <strong>of</strong> the Census for<br />
the Bureau <strong>of</strong> Labor Statistics. <strong>The</strong> sample<br />
consists <strong>of</strong> about 60,000 households selected<br />
to represent the U.S. population 16 years <strong>of</strong><br />
age and older. Households are interviewed<br />
on a rotating b<strong>as</strong>is, so that three-fourths <strong>of</strong><br />
the sample is the same for any 2 consecutive<br />
months.<br />
Definitions<br />
Employed persons include (1) all those who<br />
worked for pay any time during the week<br />
which includes the 12th day <strong>of</strong> the month or<br />
who worked unpaid for 15 hours or more in a<br />
family-operated enterprise and (2) those who<br />
were temporarily absent from their regular<br />
jobs because <strong>of</strong> illness, vacation, industrial<br />
dispute, or similar re<strong>as</strong>ons. A person working<br />
at more than one job is counted only in the<br />
job at which he or she worked the greatest<br />
number <strong>of</strong> hours.<br />
Unemployed persons are those who did<br />
not work during the survey week, but were<br />
available for work except for temporary illness<br />
and had looked for jobs within the preceding<br />
4 weeks. Persons who did not look for work<br />
because they were on lay<strong>of</strong>f are also counted<br />
among the unemployed. <strong>The</strong> unemployment<br />
rate represents the number unemployed <strong>as</strong> a<br />
percent <strong>of</strong> the civilian labor force.<br />
<strong>The</strong> civilian labor force consists <strong>of</strong> all<br />
employed or unemployed persons in the civilian<br />
noninstitutional population. Persons not<br />
in the labor force are those not cl<strong>as</strong>sified <strong>as</strong><br />
employed or unemployed. This group includes<br />
discouraged workers, defined <strong>as</strong> persons who<br />
want and are available for a job and who<br />
have looked for work sometime in the p<strong>as</strong>t<br />
12 months (or since the end <strong>of</strong> their l<strong>as</strong>t job<br />
if they held one within the p<strong>as</strong>t 12 months),<br />
but are not currently looking, because they<br />
believe there are no jobs available or there are<br />
none for which they would qualify. <strong>The</strong> civilian<br />
noninstitutional population comprises<br />
all persons 16 years <strong>of</strong> age and older who are<br />
not inmates <strong>of</strong> penal or mental institutions,<br />
sanitariums, or homes for the aged, infirm,<br />
or needy. <strong>The</strong> civilian labor force participation<br />
rate is the proportion <strong>of</strong> the civilian<br />
noninstitutional population that is in the<br />
labor force. <strong>The</strong> employment-population<br />
ratio is employment <strong>as</strong> a percent <strong>of</strong> the civilian<br />
noninstitutional population.<br />
Notes on the data<br />
From time to time, and especially after a decennial<br />
census, adjustments are made in the<br />
Current Population Survey figures to correct<br />
for estimating errors during the intercensal<br />
years. <strong>The</strong>se adjustments affect the comparability<br />
<strong>of</strong> historical data. A description <strong>of</strong><br />
these adjustments and their effect on the<br />
various data series appears in the Explanatory<br />
Notes <strong>of</strong> Employment and Earnings. For<br />
a discussion <strong>of</strong> changes introduced in January<br />
2003, see “Revisions to the Current Population<br />
Survey Effective in January 2003” in<br />
the February 2003 issue <strong>of</strong> Employment and<br />
Earnings (available on the BLS Web site at<br />
www.bls.gov/cps/rvcps03.pdf).<br />
Effective in January 2003, BLS began<br />
using the X-12 ARIMA se<strong>as</strong>onal adjustment<br />
program to se<strong>as</strong>onally adjust national labor<br />
force data. This program replaced the X-11<br />
ARIMA program which had been used since<br />
January 1980. See “Revision <strong>of</strong> Se<strong>as</strong>onally<br />
Adjusted Labor Force Series in 2003,” in<br />
the February 2003 issue <strong>of</strong> Employment and<br />
Earnings (available on the BLS Web site at<br />
www.bls.gov/cps/cpsrs.pdf) for a discussion<br />
<strong>of</strong> the introduction <strong>of</strong> the use <strong>of</strong> X-12 ARIMA<br />
for se<strong>as</strong>onal adjustment <strong>of</strong> the labor force<br />
data and the effects that it had on the data.<br />
At the beginning <strong>of</strong> each calendar year,<br />
historical se<strong>as</strong>onally adjusted data usually<br />
are revised, and projected se<strong>as</strong>onal adjustment<br />
factors are calculated for use during the<br />
January–June period. <strong>The</strong> historical se<strong>as</strong>onally<br />
adjusted data usually are revised for only<br />
the most recent 5 years. In July, new se<strong>as</strong>onal<br />
adjustment factors, which incorporate the<br />
experience through June, are produced for<br />
the July–December period, but no revisions<br />
are made in the historical data.<br />
FOR ADDITIONAL INFORMATION on<br />
national household survey data, contact the<br />
Division <strong>of</strong> Labor Force Statistics: (202)<br />
691–6378.<br />
Establishment survey data<br />
Description <strong>of</strong> the series<br />
Employment, hours, and earnings data in this<br />
section are compiled from payroll records<br />
reported monthly on a voluntary b<strong>as</strong>is to<br />
the Bureau <strong>of</strong> Labor Statistics and its cooperating<br />
State agencies by about 160,000<br />
businesses and government agencies, which<br />
represent approximately 400,000 individual<br />
worksites and represent all industries except<br />
agriculture. <strong>The</strong> active CES sample covers<br />
approximately one-third <strong>of</strong> all nonfarm<br />
payroll workers. Industries are cl<strong>as</strong>sified in<br />
accordance with the 2002 North American<br />
Industry Cl<strong>as</strong>sification System. In most<br />
industries, the sampling probabilities are<br />
b<strong>as</strong>ed on the size <strong>of</strong> the establishment; most<br />
large establishments are therefore in the<br />
sample. (An establishment is not necessarily<br />
a firm; it may be a branch plant, for example,<br />
or warehouse.) Self-employed persons and<br />
others not on a regular civilian payroll are<br />
outside the scope <strong>of</strong> the survey because they<br />
are excluded from establishment records.<br />
This largely accounts for the difference in<br />
employment figures between the household<br />
and establishment surveys.<br />
Definitions<br />
An establishment is an economic unit which<br />
produces goods or services (such <strong>as</strong> a factory<br />
or store) at a single location and is engaged<br />
in one type <strong>of</strong> economic activity.<br />
Employed persons are all persons who<br />
received pay (including holiday and sick pay)<br />
for any part <strong>of</strong> the payroll period including<br />
the 12th day <strong>of</strong> the month. Persons holding<br />
more than one job (about 5 percent <strong>of</strong> all<br />
persons in the labor force) are counted in<br />
each establishment which reports them.<br />
Production workers in the goods-producing<br />
industries cover employees, up through<br />
the level <strong>of</strong> working supervisors, who engage<br />
directly in the manufacture or construction <strong>of</strong><br />
the establishment’s product. In private service-providing<br />
industries, data are collected<br />
for nonsupervisory workers, which include<br />
most employees except those in executive,<br />
Monthly Labor Review • November 2008 65
Current Labor Statistics<br />
managerial, and supervisory positions. Those<br />
workers mentioned in tables 11–16 include<br />
production workers in manufacturing and<br />
natural resources and mining; construction<br />
workers in construction; and nonsupervisory<br />
workers in all private service-providing<br />
industries. Production and nonsupervisory<br />
workers account for about four-fifths <strong>of</strong> the<br />
total employment on private nonagricultural<br />
payrolls.<br />
Earnings are the payments production<br />
or nonsupervisory workers receive during<br />
the survey period, including premium pay<br />
for overtime or late-shift work but excluding<br />
irregular bonuses and other special<br />
payments. Real earnings are earnings<br />
adjusted to reflect the effects <strong>of</strong> changes<br />
in consumer prices. <strong>The</strong> deflator for this<br />
series is derived from the Consumer Price<br />
Index for Urban Wage Earners and Clerical<br />
Workers (CPI-W).<br />
Hours represent the average weekly<br />
hours <strong>of</strong> production or nonsupervisory<br />
workers for which pay w<strong>as</strong> received, and are<br />
different from standard or scheduled hours.<br />
Overtime hours represent the portion <strong>of</strong><br />
average weekly hours which w<strong>as</strong> in excess<br />
<strong>of</strong> regular hours and for which overtime<br />
premiums were paid.<br />
<strong>The</strong> Diffusion Index represents the<br />
percent <strong>of</strong> industries in which employment<br />
w<strong>as</strong> rising over the indicated period, plus<br />
one-half <strong>of</strong> the industries with unchanged<br />
employment; 50 percent indicates an equal<br />
balance between industries with incre<strong>as</strong>ing<br />
and decre<strong>as</strong>ing employment. In line with<br />
Bureau practice, data for the 1-, 3-, and 6month<br />
spans are se<strong>as</strong>onally adjusted, while<br />
those for the 12-month span are unadjusted.<br />
Table 17 provides an index on private nonfarm<br />
employment b<strong>as</strong>ed on 278 industries,<br />
and a manufacturing index b<strong>as</strong>ed on 84<br />
industries. <strong>The</strong>se indexes are useful for me<strong>as</strong>uring<br />
the dispersion <strong>of</strong> economic gains or<br />
losses and are also economic indicators.<br />
Notes on the data<br />
Establishment survey data are annually<br />
adjusted to comprehensive counts <strong>of</strong> employment<br />
(called “benchmarks”). <strong>The</strong> March<br />
2003 benchmark w<strong>as</strong> introduced in February<br />
2004 with the rele<strong>as</strong>e <strong>of</strong> data for January<br />
2004, published in the March 2004 issue <strong>of</strong><br />
the Review. With the rele<strong>as</strong>e in June 2003,<br />
CES completed a conversion from the Standard<br />
Industrial Cl<strong>as</strong>sification (SIC) system to<br />
the North American Industry Cl<strong>as</strong>sification<br />
System (naics) and completed the transition<br />
from its original quota sample design to a<br />
probability-b<strong>as</strong>ed sample design. <strong>The</strong> industry-coding<br />
update included reconstruction<br />
<strong>of</strong> historical estimates in order to preserve<br />
66 Monthly Labor Review • November 2008<br />
time series for data users. Normally 5 years<br />
<strong>of</strong> se<strong>as</strong>onally adjusted data are revised with<br />
each benchmark revision. However, with this<br />
rele<strong>as</strong>e, the entire new time series history for<br />
all CES data series were re-se<strong>as</strong>onally adjusted<br />
due to the NAICS conversion, which resulted<br />
in the revision <strong>of</strong> all CES time series.<br />
Also in June 2003, the CES program introduced<br />
concurrent se<strong>as</strong>onal adjustment for<br />
the national establishment data. Under this<br />
methodology, the first preliminary estimates<br />
for the current reference month and the<br />
revised estimates for the 2 prior months will<br />
be updated with concurrent factors with each<br />
new rele<strong>as</strong>e <strong>of</strong> data. Concurrent se<strong>as</strong>onal<br />
adjustment incorporates all available data,<br />
including first preliminary estimates for<br />
the most current month, in the adjustment<br />
process. For additional information on all <strong>of</strong><br />
the changes introduced in June 2003, see the<br />
June 2003 issue <strong>of</strong> Employment and Earnings<br />
and “Recent changes in the national Current<br />
Employment Statistics survey,” Monthly Labor<br />
Review, June 2003, pp. 3–13.<br />
Revisions in State data (table 11) occurred<br />
with the publication <strong>of</strong> January 2003<br />
data. For information on the revisions for<br />
the State data, see the March and May 2003<br />
issues <strong>of</strong> Employment and Earnings, and “Recent<br />
changes in the State and Metropolitan<br />
Area CES survey,” Monthly Labor Review,<br />
June 2003, pp. 14–19.<br />
Beginning in June 1996, the BLS uses<br />
the X-12-ARIMA methodology to se<strong>as</strong>onally<br />
adjust establishment survey data. This<br />
procedure, developed by the Bureau <strong>of</strong> the<br />
Census, controls for the effect <strong>of</strong> varying<br />
survey intervals (also known <strong>as</strong> the 4- versus<br />
5-week effect), thereby providing improved<br />
me<strong>as</strong>urement <strong>of</strong> over-the-month changes<br />
and underlying economic trends. Revisions<br />
<strong>of</strong> data, usually for the most recent 5-year<br />
period, are made once a year coincident with<br />
the benchmark revisions.<br />
In the establishment survey, estimates<br />
for the most recent 2 months are b<strong>as</strong>ed on<br />
incomplete returns and are published <strong>as</strong> preliminary<br />
in the tables (12–17 in the Review).<br />
When all returns have been received, the<br />
estimates are revised and published <strong>as</strong> “final”<br />
(prior to any benchmark revisions) in the<br />
third month <strong>of</strong> their appearance. Thus, December<br />
data are published <strong>as</strong> preliminary in<br />
January and February and <strong>as</strong> final in March.<br />
For the same re<strong>as</strong>ons, quarterly establishment<br />
data (table 1) are preliminary for the<br />
first 2 months <strong>of</strong> publication and final in the<br />
third month. Fourth-quarter data are published<br />
<strong>as</strong> preliminary in January and February<br />
and <strong>as</strong> final in March.<br />
FOR ADDITIONAL INFORMATION on<br />
establishment survey data, contact the Division<br />
<strong>of</strong> Current Employment Statistics:<br />
(202) 691–6555.<br />
Unemployment data by State<br />
Description <strong>of</strong> the series<br />
Data presented in this section are obtained<br />
from the Local Area Unemployment Statistics<br />
(LAUS) program, which is conducted in<br />
cooperation with State employment security<br />
agencies.<br />
Monthly estimates <strong>of</strong> the labor force,<br />
employment, and unemployment for States<br />
and sub-State are<strong>as</strong> are a key indicator <strong>of</strong> local<br />
economic conditions, and form the b<strong>as</strong>is<br />
for determining the eligibility <strong>of</strong> an area for<br />
benefits under Federal economic <strong>as</strong>sistance<br />
programs such <strong>as</strong> the Job Training Partnership<br />
Act. Se<strong>as</strong>onally adjusted unemployment<br />
rates are presented in table 10. Ins<strong>of</strong>ar <strong>as</strong> possible,<br />
the concepts and definitions underlying<br />
these data are those used in the national<br />
estimates obtained from the CPS.<br />
Notes on the data<br />
Data refer to State <strong>of</strong> residence. Monthly<br />
data for all States and the District <strong>of</strong> Columbia<br />
are derived using standardized procedures<br />
established by BLS. Once a year, estimates are<br />
revised to new population controls, usually<br />
with publication <strong>of</strong> January estimates, and<br />
benchmarked to annual average CPS levels.<br />
FOR ADDITIONAL INFORMATION on data<br />
in this series, call (202) 691–6392 (table 10)<br />
or (202) 691–6559 (table 11).<br />
Quarterly Census <strong>of</strong><br />
Employment and Wages<br />
Description <strong>of</strong> the series<br />
Employment, wage, and establishment data<br />
in this section are derived from the quarterly<br />
tax reports submitted to State employment<br />
security agencies by private and State and<br />
local government <strong>employer</strong>s subject to State<br />
unemployment insurance (ui) laws and from<br />
Federal, agencies subject to the Unemployment<br />
Compensation for Federal Employees<br />
(ucfe) program. Each quarter, State agencies<br />
edit and process the data and send the<br />
information to the Bureau <strong>of</strong> Labor Statistics.<br />
<strong>The</strong> Quarterly Census <strong>of</strong> Employment<br />
and Wages (QCEW) data, also referred <strong>as</strong> ES-<br />
202 data, are the most complete enumeration<br />
<strong>of</strong> employment and wage information by<br />
industry at the national, State, metropolitan<br />
area, and county levels. <strong>The</strong>y have broad<br />
economic significance in evaluating labor
market trends and major industry developments.<br />
Definitions<br />
In general, the Quarterly Census <strong>of</strong> Employment<br />
and Wages monthly employment data<br />
represent the number <strong>of</strong> covered workers<br />
who worked during, or received pay for, the<br />
pay period that included the 12th day <strong>of</strong><br />
the month. Covered private industry employment<br />
includes most corporate <strong>of</strong>ficials,<br />
executives, supervisory personnel, pr<strong>of</strong>essionals,<br />
clerical workers, wage earners, piece<br />
workers, and part-time workers. It excludes<br />
proprietors, the unincorporated self-employed,<br />
unpaid family members, and certain<br />
farm and domestic workers. Certain types<br />
<strong>of</strong> nonpr<strong>of</strong>it <strong>employer</strong>s, such <strong>as</strong> religious<br />
organizations, are given a choice <strong>of</strong> coverage<br />
or exclusion in a number <strong>of</strong> States. Workers<br />
in these organizations are, therefore, reported<br />
to a limited degree.<br />
Persons on paid sick leave, paid holiday,<br />
paid vacation, and the like, are included.<br />
Persons on the payroll <strong>of</strong> more than one<br />
firm during the period are counted by each<br />
ui-subject <strong>employer</strong> if they meet the employment<br />
definition noted earlier. <strong>The</strong> employment<br />
count excludes workers who earned no<br />
wages during the entire applicable pay period<br />
because <strong>of</strong> work stoppages, temporary lay<strong>of</strong>fs,<br />
illness, or unpaid vacations.<br />
Federal employment data are b<strong>as</strong>ed on<br />
reports <strong>of</strong> monthly employment and quarterly<br />
wages submitted each quarter to State<br />
agencies for all Federal installations with<br />
employees covered by the Unemployment<br />
Compensation for Federal Employees (ucfe)<br />
program, except for certain national security<br />
agencies, which are omitted for security re<strong>as</strong>ons.<br />
Employment for all Federal agencies<br />
for any given month is b<strong>as</strong>ed on the number<br />
<strong>of</strong> persons who worked during or received<br />
pay for the pay period that included the 12th<br />
<strong>of</strong> the month.<br />
An establishment is an economic unit,<br />
such <strong>as</strong> a farm, mine, factory, or store, that<br />
produces goods or provides services. It is<br />
typically at a single physical location and<br />
engaged in one, or predominantly one, type<br />
<strong>of</strong> economic activity for which a single industrial<br />
cl<strong>as</strong>sification may be applied. Occ<strong>as</strong>ionally,<br />
a single physical location encomp<strong>as</strong>ses<br />
two or more distinct and significant activities.<br />
Each activity should be reported <strong>as</strong> a separate<br />
establishment if separate records are kept<br />
and the various activities are cl<strong>as</strong>sified under<br />
different NAICS industries.<br />
Most <strong>employer</strong>s have only one establishment;<br />
thus, the establishment is the<br />
predominant reporting unit or statistical<br />
entity for reporting employment and wages<br />
data. Most <strong>employer</strong>s, including State and<br />
local governments who operate more than<br />
one establishment in a State, file a Multiple<br />
Worksite Report each quarter, in addition<br />
to their quarterly ui report. <strong>The</strong> Multiple<br />
Worksite Report is used to collect separate<br />
employment and wage data for each <strong>of</strong> the<br />
<strong>employer</strong>’s establishments, which are not<br />
detailed on the ui report. Some very small<br />
multi-establishment <strong>employer</strong>s do not file a<br />
Multiple Worksite Report. When the total<br />
employment in an <strong>employer</strong>’s secondary<br />
establishments (all establishments other<br />
than the largest) is 10 or fewer, the <strong>employer</strong><br />
generally will file a consolidated report for all<br />
establishments. Also, some <strong>employer</strong>s either<br />
cannot or will not report at the establishment<br />
level and thus aggregate establishments into<br />
one consolidated unit, or possibly several<br />
units, though not at the establishment level.<br />
For the Federal Government, the reporting<br />
unit is the installation: a single location<br />
at which a department, agency, or other government<br />
body h<strong>as</strong> civilian employees. Federal<br />
agencies follow slightly different criteria than<br />
do private <strong>employer</strong>s when breaking down<br />
their reports by installation. <strong>The</strong>y are permitted<br />
to combine <strong>as</strong> a single statewide unit: 1)<br />
all installations with 10 or fewer workers,<br />
and 2) all installations that have a combined<br />
total in the State <strong>of</strong> fewer than 50 workers.<br />
Also, when there are fewer than 25 workers<br />
in all secondary installations in a State, the<br />
secondary installations may be combined and<br />
reported with the major installation. L<strong>as</strong>t, if a<br />
Federal agency h<strong>as</strong> fewer than five employees<br />
in a State, the agency headquarters <strong>of</strong>fice<br />
(regional <strong>of</strong>fice, district <strong>of</strong>fice) serving each<br />
State may consolidate the employment and<br />
wages data for that State with the data reported<br />
to the State in which the headquarters<br />
is located. As a result <strong>of</strong> these reporting rules,<br />
the number <strong>of</strong> reporting units is always larger<br />
than the number <strong>of</strong> <strong>employer</strong>s (or government<br />
agencies) but smaller than the number<br />
<strong>of</strong> actual establishments (or installations).<br />
Data reported for the first quarter are<br />
tabulated into size categories ranging from<br />
worksites <strong>of</strong> very small size to those with<br />
1,000 employees or more. <strong>The</strong> size category<br />
is determined by the establishment’s March<br />
employment level. It is important to note that<br />
each establishment <strong>of</strong> a multi-establishment<br />
firm is tabulated separately into the appropriate<br />
size category. <strong>The</strong> total employment level<br />
<strong>of</strong> the reporting multi-establishment firm is<br />
not used in the size tabulation.<br />
Covered <strong>employer</strong>s in most States report<br />
total wages paid during the calendar quarter,<br />
regardless <strong>of</strong> when the services were performed.<br />
A few State laws, however, specify<br />
that wages be reported for, or b<strong>as</strong>ed on the<br />
period during which services are performed<br />
rather than the period during which compensation<br />
is paid. Under most State laws or<br />
regulations, wages include bonuses, <strong>stock</strong><br />
options, the c<strong>as</strong>h value <strong>of</strong> meals and lodging,<br />
tips and other gratuities, and, in some States,<br />
<strong>employer</strong> contributions to certain deferred<br />
compensation plans such <strong>as</strong> <strong>401</strong>(k) plans.<br />
Covered <strong>employer</strong> contributions for<br />
old-age, survivors, and disability insurance<br />
(o<strong>as</strong>di), health insurance, unemployment insurance,<br />
workers’ compensation, and private<br />
pension and welfare funds are not reported <strong>as</strong><br />
wages. Employee contributions for the same<br />
purposes, however, <strong>as</strong> well <strong>as</strong> money withheld<br />
for income taxes, union dues, and so forth, are<br />
reported even though they are deducted from<br />
the worker’s gross pay.<br />
Wages <strong>of</strong> covered Federal workers represent<br />
the gross amount <strong>of</strong> all payrolls for all<br />
pay periods ending within the quarter. This<br />
includes c<strong>as</strong>h allowances, the c<strong>as</strong>h equivalent<br />
<strong>of</strong> any type <strong>of</strong> remuneration, severance pay,<br />
withholding taxes, and retirement deductions.<br />
Federal employee remuneration generally<br />
covers the same types <strong>of</strong> services <strong>as</strong> for<br />
workers in private industry.<br />
Average annual wage per employee for<br />
any given industry are computed by dividing<br />
total annual wages by annual average<br />
employment. A further division by 52 yields<br />
average weekly wages per employee. Annual<br />
pay data only approximate annual earnings<br />
because an individual may not be employed<br />
by the same <strong>employer</strong> all year or may work for<br />
more than one <strong>employer</strong> at a time.<br />
Average weekly or annual wage is affected<br />
by the ratio <strong>of</strong> full-time to part-time<br />
workers <strong>as</strong> well <strong>as</strong> the number <strong>of</strong> individuals<br />
in high-paying and low-paying occupations.<br />
When average pay levels between States and<br />
industries are compared, these factors should<br />
be taken into consideration. For example,<br />
industries characterized by high proportions<br />
<strong>of</strong> part-time workers will show average wage<br />
levels appreciably less than the weekly pay<br />
levels <strong>of</strong> regular full-time employees in these<br />
industries. <strong>The</strong> opposite effect characterizes<br />
industries with low proportions <strong>of</strong> part-time<br />
workers, or industries that typically schedule<br />
heavy weekend and overtime work. Average<br />
wage data also may be influenced by work<br />
stoppages, labor turnover rates, retroactive<br />
payments, se<strong>as</strong>onal factors, bonus payments,<br />
and so on.<br />
Notes on the data<br />
Beginning with the rele<strong>as</strong>e <strong>of</strong> data for 2001,<br />
publications presenting data from the Covered<br />
Employment and Wages program have<br />
switched to the 2002 version <strong>of</strong> the North<br />
Monthly Labor Review • November 2008 67
Current Labor Statistics<br />
American Industry Cl<strong>as</strong>sification System<br />
(NAICS) <strong>as</strong> the b<strong>as</strong>is for the <strong>as</strong>signment and<br />
tabulation <strong>of</strong> economic data by industry.<br />
NAICS is the product <strong>of</strong> a cooperative effort<br />
on the part <strong>of</strong> the statistical agencies<br />
<strong>of</strong> the United States, Canada, and Mexico.<br />
Due to difference in NAICS and Standard<br />
Industrial Cl<strong>as</strong>sification (SIC) structures,<br />
industry data for 2001 is not comparable<br />
to the SIC-b<strong>as</strong>ed data for earlier years.<br />
Effective January 2001, the program<br />
began <strong>as</strong>signing Indian Tribal Councils and<br />
related establishments to local government<br />
ownership. This BLS action w<strong>as</strong> in response to<br />
a change in Federal law dealing with the way<br />
Indian Tribes are treated under the Federal<br />
Unemployment Tax Act. This law requires<br />
federally recognized Indian Tribes to be treated<br />
similarly to State and local governments.<br />
In the p<strong>as</strong>t, the Covered Employment and<br />
Wage (CEW) program coded Indian Tribal<br />
Councils and related establishments in the<br />
private sector. As a result <strong>of</strong> the new law, CEW<br />
data reflects significant shifts in employment<br />
and wages between the private sector and<br />
local government from 2000 to 2001. Data<br />
also reflect industry changes. Those accounts<br />
previously <strong>as</strong>signed to civic and social organizations<br />
were <strong>as</strong>signed to tribal governments.<br />
<strong>The</strong>re were no required industry changes for<br />
related establishments owned by these Tribal<br />
Councils. <strong>The</strong>se tribal business establishments<br />
continued to be coded according to the economic<br />
activity <strong>of</strong> that entity.<br />
To insure the highest possible quality<br />
<strong>of</strong> data, State employment security agencies<br />
verify with <strong>employer</strong>s and update, if necessary,<br />
the industry, location, and ownership<br />
cl<strong>as</strong>sification <strong>of</strong> all establishments on a 3-year<br />
cycle. Changes in establishment cl<strong>as</strong>sification<br />
codes resulting from the verification<br />
process are introduced with the data reported<br />
for the first quarter <strong>of</strong> the year. Changes<br />
resulting from improved <strong>employer</strong> reporting<br />
also are introduced in the first quarter. For<br />
these re<strong>as</strong>ons, some data, especially at more<br />
detailed geographic levels, may not be strictly<br />
comparable with earlier years.<br />
County definitions are <strong>as</strong>signed according<br />
to Federal Information Processing Standards<br />
Publications <strong>as</strong> issued by the National Institute<br />
<strong>of</strong> Standards and Technology. Are<strong>as</strong><br />
shown <strong>as</strong> counties include those designated<br />
<strong>as</strong> independent cities in some jurisdictions<br />
and, in Al<strong>as</strong>ka, those are<strong>as</strong> designated by the<br />
Census Bureau where counties have not been<br />
created. County data also are presented for<br />
the New England States for comparative<br />
purposes, even though townships are the<br />
more common designation used in New<br />
England (and New Jersey).<br />
<strong>The</strong> Office <strong>of</strong> Management and Budget<br />
68 Monthly Labor Review • November 2008<br />
(OMB) defines metropolitan are<strong>as</strong> for use<br />
in Federal statistical activities and updates<br />
these definitions <strong>as</strong> needed. Data in this table<br />
use metropolitan area criteria established<br />
by OMB in definitions issued June 30, 1999<br />
(OMB Bulletin No. 99-04). <strong>The</strong>se definitions<br />
reflect information obtained from the 1990<br />
Decennial Census and the 1998 U.S. Census<br />
Bureau population estimate. A complete list<br />
<strong>of</strong> metropolitan area definitions is available<br />
from the National Technical Information<br />
Service (NTIS), Document Sales, 5205 Port<br />
Royal Road, Springfield, Va. 22161, telephone<br />
1-800-553-6847.<br />
OMB defines metropolitan are<strong>as</strong> in terms<br />
<strong>of</strong> entire counties, except in the six New England<br />
States where they are defined in terms <strong>of</strong><br />
cities and towns. New England data in this<br />
table, however, are b<strong>as</strong>ed on a county concept<br />
defined by OMB <strong>as</strong> New England County<br />
Metropolitan Are<strong>as</strong> (NECMA) because county-level<br />
data are the most detailed available<br />
from the Quarterly Census <strong>of</strong> Employment<br />
and Wages. <strong>The</strong> NECMA is a county-b<strong>as</strong>ed<br />
alternative to the city- and town-b<strong>as</strong>ed metropolitan<br />
are<strong>as</strong> in New England. <strong>The</strong> NECMA for<br />
a Metropolitan Statistical Area (MSA) include:<br />
(1) the county containing the first-named city<br />
in that MSA title (this county may include<br />
the first-named cities <strong>of</strong> other MSA, and (2)<br />
each additional county having at le<strong>as</strong>t half its<br />
population in the MSA in which first-named<br />
cities are in the county identified in step 1.<br />
<strong>The</strong> NECMA is <strong>of</strong>ficially defined are<strong>as</strong> that<br />
are meant to be used by statistical programs<br />
that cannot use the regular metropolitan area<br />
definitions in New England.<br />
For additional information on the<br />
covered employment and wage data, contact<br />
the Division <strong>of</strong> Administrative Statistics and<br />
Labor Turnover at (202) 691–6567.<br />
Job Openings and Labor<br />
Turnover Survey<br />
Description <strong>of</strong> the series<br />
Data for the Job Openings and Labor<br />
Turnover Survey (JOLTS) are collected and<br />
compiled from a sample <strong>of</strong> 16,000 business<br />
establishments. Each month, data are collected<br />
for total employment, job openings,<br />
hires, quits, lay<strong>of</strong>fs and discharges, and other<br />
separations. <strong>The</strong> JOLTS program covers all<br />
private nonfarm establishments such <strong>as</strong> factories,<br />
<strong>of</strong>fices, and stores, <strong>as</strong> well <strong>as</strong> Federal,<br />
State, and local government entities in the<br />
50 States and the District <strong>of</strong> Columbia. <strong>The</strong><br />
JOLTS sample design is a random sample<br />
drawn from a universe <strong>of</strong> more than eight<br />
million establishments compiled <strong>as</strong> part <strong>of</strong> the<br />
operations <strong>of</strong> the Quarterly Census <strong>of</strong> Employment<br />
and Wages, or QCEW, program. This<br />
program includes all <strong>employer</strong>s subject to<br />
State unemployment insurance (UI) laws and<br />
Federal agencies subject to Unemployment<br />
Compensation for Federal Employees (UCFE).<br />
<strong>The</strong> sampling frame is stratified by ownership,<br />
region, industry sector, and size cl<strong>as</strong>s.<br />
Large firms fall into the sample with virtual<br />
certainty. JOLTS total employment estimates<br />
are controlled to the employment estimates<br />
<strong>of</strong> the Current Employment Statistics (CES)<br />
survey. A ratio <strong>of</strong> CES to JOLTS employment<br />
is used to adjust the levels for all other JOLTS<br />
data elements. Rates then are computed from<br />
the adjusted levels.<br />
<strong>The</strong> monthly JOLTS data series begin with<br />
December 2000. Not se<strong>as</strong>onally adjusted<br />
data on job openings, hires, total separations,<br />
quits, lay<strong>of</strong>fs and discharges, and other<br />
separations levels and rates are available for<br />
the total nonfarm sector, 16 private industry<br />
divisions and 2 government divisions b<strong>as</strong>ed<br />
on the North American Industry Cl<strong>as</strong>sification<br />
System (NAICS), and four geographic<br />
regions. Se<strong>as</strong>onally adjusted data on job<br />
openings, hires, total separations, and quits<br />
levels and rates are available for the total<br />
nonfarm sector, selected industry sectors, and<br />
four geographic regions.<br />
Definitions<br />
Establishments submit job openings infor-mation<br />
for the l<strong>as</strong>t business day <strong>of</strong> the<br />
reference month. A job opening requires<br />
that (1) a specific position exists and there<br />
is work available for that position; and (2)<br />
work could start within 30 days regardless<br />
<strong>of</strong> whether a suitable candidate is found;<br />
and (3) the <strong>employer</strong> is actively recruiting<br />
from outside the establishment to fill the<br />
position. Included are full-time, part-time,<br />
permanent, short-term, and se<strong>as</strong>onal openings.<br />
Active recruiting means that the establishment<br />
is taking steps to fill a position by<br />
advertising in newspapers or on the Internet,<br />
posting help-wanted signs, accepting applications,<br />
or using other similar methods.<br />
Jobs to be filled only by internal transfers,<br />
promotions, demotions, or recall from lay<strong>of</strong>fs<br />
are excluded. Also excluded are jobs with<br />
start dates more than 30 days in the future,<br />
jobs for which employees have been hired but<br />
have not yet reported for work, and jobs to be<br />
filled by employees <strong>of</strong> temporary help agencies,<br />
employee le<strong>as</strong>ing companies, outside<br />
contractors, or consultants. <strong>The</strong> job openings<br />
rate is computed by dividing the number <strong>of</strong><br />
job openings by the sum <strong>of</strong> employment and<br />
job openings, and multiplying that quotient<br />
by 100.
Hires are the total number <strong>of</strong> additions<br />
to the payroll occurring at any time during<br />
the reference month, including both new and<br />
rehired employees and full-time and parttime,<br />
permanent, short-term and se<strong>as</strong>onal<br />
employees, employees recalled to the location<br />
after a lay<strong>of</strong>f l<strong>as</strong>ting more than 7 days, on-call<br />
or intermittent employees who returned to<br />
work after having been formally separated,<br />
and transfers from other locations. <strong>The</strong> hires<br />
count does not include transfers or promotions<br />
within the reporting site, employees<br />
returning from strike, employees <strong>of</strong> temporary<br />
help agencies or employee le<strong>as</strong>ing companies,<br />
outside contractors, or consultants. <strong>The</strong> hires<br />
rate is computed by dividing the number <strong>of</strong><br />
hires by employment, and multiplying that<br />
quotient by 100.<br />
Separations are the total number <strong>of</strong><br />
terminations <strong>of</strong> employment occurring at<br />
any time during the reference month, and<br />
are reported by type <strong>of</strong> separation—quits,<br />
lay<strong>of</strong>fs and discharges, and other separations.<br />
Quits are voluntary separations by employees<br />
(except for retirements, which are reported<br />
<strong>as</strong> other separations). Lay<strong>of</strong>fs and discharges<br />
are involuntary separations initiated by the<br />
<strong>employer</strong> and include lay<strong>of</strong>fs with no intent<br />
to rehire, formal lay<strong>of</strong>fs l<strong>as</strong>ting or expected<br />
to l<strong>as</strong>t more than 7 days, discharges resulting<br />
from mergers, downsizing, or closings, firings<br />
or other discharges for cause, terminations<br />
<strong>of</strong> permanent or short-term employees, and<br />
terminations <strong>of</strong> se<strong>as</strong>onal employees. Other<br />
separations include retirements, transfers to<br />
other locations, deaths, and separations due to<br />
disability. Separations do not include transfers<br />
within the same location or employees on<br />
strike.<br />
<strong>The</strong> separations rate is computed by dividing<br />
the number <strong>of</strong> separations by employment,<br />
and multiplying that quotient by 100.<br />
<strong>The</strong> quits, lay<strong>of</strong>fs and discharges, and other<br />
separations rates are computed similarly,<br />
dividing the number by employment and<br />
multiplying by 100.<br />
Notes on the data<br />
<strong>The</strong> JOLTS data series on job openings, hires,<br />
and separations are relatively new. <strong>The</strong> full<br />
sample is divided into panels, with one panel<br />
enrolled each month. A full complement <strong>of</strong><br />
panels for the original data series b<strong>as</strong>ed on the<br />
1987 Standard Industrial Cl<strong>as</strong>sification (SIC)<br />
system w<strong>as</strong> not completely enrolled in the<br />
survey until January 2002. <strong>The</strong> supple-mental<br />
panels <strong>of</strong> establishments needed to create NA-<br />
ICS estimates were not completely enrolled<br />
until May 2003. <strong>The</strong> data collected up until<br />
those points are from less than a full sample.<br />
<strong>The</strong>refore, estimates from earlier months<br />
should be used with caution, <strong>as</strong> fewer sampled<br />
units were reporting data at that time.<br />
In March 2002, BLS procedures for collecting<br />
hires and separations data were revised to<br />
address possible underreporting. As a result,<br />
JOLTS hires and separations estimates for<br />
months prior to March 2002 may not be<br />
comparable with estimates for March 2002<br />
and later.<br />
<strong>The</strong> Federal Government reorganization<br />
that involved transferring approximately<br />
180,000 employees to the new Department<br />
<strong>of</strong> Homeland Security is not reflected in<br />
the JOLTS hires and separations estimates<br />
for the Federal Government. <strong>The</strong> Office <strong>of</strong><br />
Personnel Management’s record shows these<br />
transfers were completed in March 2003. <strong>The</strong><br />
inclusion <strong>of</strong> transfers in the JOLTS definitions<br />
<strong>of</strong> hires and separations is intended to cover<br />
ongoing movements <strong>of</strong> workers between<br />
establishments. <strong>The</strong> Department <strong>of</strong> Homeland<br />
Security reorganization w<strong>as</strong> a m<strong>as</strong>sive<br />
one-time event, and the inclusion <strong>of</strong> these<br />
intergovernmental transfers would distort<br />
the Federal Government time series.<br />
Data users should note that se<strong>as</strong>onal<br />
adjustment <strong>of</strong> the JOLTS series is conducted<br />
with fewer data observations than is customary.<br />
<strong>The</strong> historical data, therefore, may<br />
be subject to larger than normal revisions.<br />
Because the se<strong>as</strong>onal patterns in economic<br />
data series typically emerge over time, the<br />
standard use <strong>of</strong> moving averages <strong>as</strong> se<strong>as</strong>onal<br />
filters to capture these effects requires longer<br />
series than are currently available. As a result,<br />
the stable se<strong>as</strong>onal filter option is used in the<br />
se<strong>as</strong>onal adjustment <strong>of</strong> the JOLTS data. When<br />
calculating se<strong>as</strong>onal factors, this filter takes<br />
an average for each calendar month after<br />
detrending the series. <strong>The</strong> stable se<strong>as</strong>onal<br />
filter <strong>as</strong>sumes that the se<strong>as</strong>onal factors are<br />
fixed; a necessary <strong>as</strong>sumption until sufficient<br />
data are available. When the stable se<strong>as</strong>onal<br />
filter is no longer needed, other program features<br />
also may be introduced, such <strong>as</strong> outlier<br />
adjustment and extended diagnostic testing.<br />
Additionally, it is expected that more series,<br />
such <strong>as</strong> lay<strong>of</strong>fs and discharges and additional<br />
industries, may be se<strong>as</strong>onally adjusted when<br />
more data are available.<br />
JOLTS hires and separations estimates<br />
cannot be used to exactly explain net changes<br />
in payroll employment. Some re<strong>as</strong>ons why it<br />
is problematic to compare changes in payroll<br />
employment with JOLTS hires and separations,<br />
especially on a monthly b<strong>as</strong>is, are: (1)<br />
the reference period for payroll employment<br />
is the pay period including the 12th <strong>of</strong> the<br />
month, while the reference period for hires<br />
and separations is the calendar month; and<br />
(2) payroll employment can vary from month<br />
to month simply because part-time and oncall<br />
workers may not always work during<br />
the pay period that includes the 12th <strong>of</strong> the<br />
month. Additionally, research h<strong>as</strong> found that<br />
some reporters systematically underreport<br />
separations relative to hires due to a number<br />
<strong>of</strong> factors, including the nature <strong>of</strong> their<br />
payroll systems and practices. <strong>The</strong> shortfall<br />
appears to be about 2 percent or less over a<br />
12-month period.<br />
FOR ADDITIONAL INFORMATION on<br />
the Job Openings and Labor Turnover<br />
Survey, contact the Division <strong>of</strong> Administrative<br />
Statistics and Labor Turnover at (202)<br />
961–5870.<br />
Compensation and<br />
Wage Data<br />
(Tables 1–3; 30–37)<br />
<strong>The</strong> National Compensation Survey (NCS)<br />
produces a variety <strong>of</strong> compensation data. <strong>The</strong>se<br />
include: <strong>The</strong> Employment Cost Index (ECI)<br />
and NCS benefit me<strong>as</strong>ures <strong>of</strong> the incidence and<br />
provisions <strong>of</strong> selected employee benefit plans.<br />
Selected samples <strong>of</strong> these me<strong>as</strong>ures appear in<br />
the following tables. NCS also compiles data on<br />
occupational wages and the Employer Costs<br />
for Employee Compensation (ECEC).<br />
Employment Cost Index<br />
Description <strong>of</strong> the series<br />
<strong>The</strong> Employment Cost Index (ECI) is a<br />
quarterly me<strong>as</strong>ure <strong>of</strong> the rate <strong>of</strong> change in<br />
compensation per hour worked and includes<br />
wages, salaries, and <strong>employer</strong> costs <strong>of</strong> employee<br />
benefits. It is a L<strong>as</strong>peyres Index that<br />
uses fixed employment weights to me<strong>as</strong>ure<br />
change in labor costs free from the influence<br />
<strong>of</strong> employment shifts among occupations<br />
and industries.<br />
<strong>The</strong> ECI provides data for the civilian<br />
economy, which includes the total private<br />
nonfarm economy excluding private households,<br />
and the public sector excluding the<br />
Federal government. Data are collected each<br />
quarter for the pay period including the<br />
12th day <strong>of</strong> March, June, September, and<br />
December.<br />
Sample establishments are cl<strong>as</strong>sified by<br />
industry categories b<strong>as</strong>ed on the 2002 North<br />
American Cl<strong>as</strong>sification System (NAICS).<br />
Within a sample establishment, specific job<br />
categories are selected and cl<strong>as</strong>sified into<br />
about 800 occupations according to the 2000<br />
Standard Occupational Cl<strong>as</strong>sification (SOC)<br />
System. Individual occupations are com-<br />
Monthly Labor Review • November 2008 69
Current Labor Statistics<br />
bined to represent one <strong>of</strong> ten intermediate<br />
aggregations, such <strong>as</strong> pr<strong>of</strong>essional and related<br />
occupations, or one <strong>of</strong> five higher level aggregations,<br />
such <strong>as</strong> management, pr<strong>of</strong>essional,<br />
and related occupations.<br />
Fixed employment weights are used<br />
each quarter to calculate the most aggregate<br />
series—civilian, private, and State and local<br />
government. <strong>The</strong>se fixed weights are also used<br />
to derive all <strong>of</strong> the industry and occupational<br />
series indexes. Beginning with the March<br />
2006 estimates, 2002 fixed employment<br />
weights from the Bureau’s Occupational<br />
Employment Statistics survey were introduced.<br />
From March 1995 to December 2005,<br />
1990 employment counts were used. <strong>The</strong>se<br />
fixed weights ensure that changes in these<br />
indexes reflect only changes in compensation,<br />
not employment shifts among industries or<br />
occupations with different levels <strong>of</strong> wages<br />
and compensation. For the series b<strong>as</strong>ed on<br />
bargaining status, census region and division,<br />
and metropolitan area status, fixed employment<br />
data are not available. <strong>The</strong> employment<br />
weights are reallocated within these series<br />
each quarter b<strong>as</strong>ed on the current eci sample.<br />
<strong>The</strong> indexes for these series, consequently, are<br />
not strictly comparable with those for aggregate,<br />
occupational, and industry series.<br />
Definitions<br />
Total compensation costs include wages,<br />
salaries, and the <strong>employer</strong>’s costs for employee<br />
benefits.<br />
Wages and salaries consist <strong>of</strong> earnings<br />
before payroll deductions, including production<br />
bonuses, incentive earnings, commissions,<br />
and cost-<strong>of</strong>-living adjustments.<br />
Benefits include the cost to <strong>employer</strong>s<br />
for paid leave, supplemental pay (including<br />
nonproduction bonuses), insurance,<br />
retirement and savings plans, and legally<br />
required benefits (such <strong>as</strong> Social Security,<br />
workers’ compensation, and unemployment<br />
insurance).<br />
Excluded from wages and salaries and<br />
employee benefits are such items <strong>as</strong> paymentin-kind,<br />
free room and board, and tips.<br />
Notes on the data<br />
<strong>The</strong> ECI data in these tables reflect the<br />
con-version to the 2002 North American<br />
Industry Cl<strong>as</strong>sification System (NAICS) and<br />
the 2000 Standard Occupational Cl<strong>as</strong>sification<br />
(SOC) system. <strong>The</strong> NAICS and SOC data<br />
shown prior to 2006 are for informational<br />
purposes only. ECI series b<strong>as</strong>ed on NAICS<br />
and SOC became the <strong>of</strong>ficial BLS estimates<br />
starting in March 2006.<br />
<strong>The</strong> ECI for changes in wages and salaries<br />
70 Monthly Labor Review • November 2008<br />
in the private nonfarm economy w<strong>as</strong> published<br />
beginning in 1975. Changes in total<br />
compensation cost—wages and salaries and<br />
benefits combined—were published beginning<br />
in 1980. <strong>The</strong> series <strong>of</strong> changes in wages<br />
and salaries and for total compensation in<br />
the State and local government sector and<br />
in the civilian nonfarm economy (excluding<br />
Federal employees) were published beginning<br />
in 1981. Historical indexes (December<br />
2005=100) are available on the Internet:<br />
www.bls.gov/ect/<br />
ADDITIONAL INFORMATION on the<br />
Employment Cost Index is available at www.<br />
bls.gov/ncs/ect/home.htm or by telephone<br />
at (202) 691–6199.<br />
National Compensation Survey<br />
Benefit Me<strong>as</strong>ures<br />
Description <strong>of</strong> the series<br />
NCS benefit me<strong>as</strong>ures <strong>of</strong> employee benefits<br />
are published in two separate reports. <strong>The</strong><br />
annual summary provides data on the incidence<br />
<strong>of</strong> (access to and participation in)<br />
selected benefits and provisions <strong>of</strong> paid<br />
holidays and vacations, life insurance plans,<br />
and other selected benefit programs. Data on<br />
percentages <strong>of</strong> establishments <strong>of</strong>fering major<br />
employee benefits, and on the <strong>employer</strong> and<br />
employee shares <strong>of</strong> contributions to medical<br />
care premiums also are presented. Selected<br />
benefit data appear in the following tables. A<br />
second publication, published later, contains<br />
more detailed information about health and<br />
retirement plans.<br />
Definitions<br />
Employer-provided benefits are benefits<br />
that are financed either wholly or partly by<br />
the <strong>employer</strong>. <strong>The</strong>y may be sponsored by a<br />
union or other third party, <strong>as</strong> long <strong>as</strong> there<br />
is some <strong>employer</strong> financing. However, some<br />
benefits that are fully paid for by the employee<br />
also are included. For example, long-term<br />
care insurance paid entirely by the employee<br />
are included because the guarantee <strong>of</strong> insurability<br />
and availability at group premium<br />
rates are considered a benefit.<br />
Employees are considered <strong>as</strong> having access<br />
to a benefit plan if it is available for their<br />
use. For example, if an employee is permitted<br />
to participate in a medical care plan <strong>of</strong>fered<br />
by the <strong>employer</strong>, but the employee <strong>decline</strong>s to<br />
do so, he or she is placed in the category with<br />
those having access to medical care.<br />
Employees in contributory plans are<br />
considered <strong>as</strong> participating in an insurance<br />
or retirement plan if they have paid required<br />
contributions and fulfilled any applicable<br />
service requirement. Employees in noncontributory<br />
plans are counted <strong>as</strong> participating<br />
regardless <strong>of</strong> whether they have fulfilled the<br />
service requirements.<br />
Defined benefit pension plans use predetermined<br />
formul<strong>as</strong> to calculate a retirement<br />
benefit (if any), and obligate the <strong>employer</strong> to<br />
provide those benefits. Benefits are generally<br />
b<strong>as</strong>ed on salary, years <strong>of</strong> service, or both.<br />
Defined contribution plans generally<br />
specify the level <strong>of</strong> <strong>employer</strong> and employee<br />
contributions to a plan, but not the formula<br />
for determining eventual benefits. Instead,<br />
individual accounts are set up for participants,<br />
and benefits are b<strong>as</strong>ed on amounts<br />
credited to these accounts.<br />
Tax-deferred savings plans are a type <strong>of</strong><br />
defined contribution plan that allow participants<br />
to contribute a portion <strong>of</strong> their salary<br />
to an <strong>employer</strong>-sponsored plan and defer<br />
income taxes until withdrawal.<br />
Flexible benefit plans allow employees<br />
to choose among several benefits, such <strong>as</strong> life<br />
insurance, medical care, and vacation days,<br />
and among several levels <strong>of</strong> coverage within<br />
a given benefit.<br />
Notes on the data<br />
ADDITIONAL INFORMATION ON THE NCS<br />
benefit me<strong>as</strong>ures is available at www.bls.<br />
gov/ncs/ebs/home.htm or by telephone at<br />
(202) 691–6199.<br />
Work stoppages<br />
Description <strong>of</strong> the series<br />
Data on work stoppages me<strong>as</strong>ure the number<br />
and duration <strong>of</strong> major strikes or lockouts<br />
(involving 1,000 workers or more) occurring<br />
during the month (or year), the number <strong>of</strong><br />
workers involved, and the amount <strong>of</strong> work<br />
time lost because <strong>of</strong> stoppage. <strong>The</strong>se data are<br />
presented in table 37.<br />
Data are largely from a variety <strong>of</strong> published<br />
sources and cover only establishments<br />
directly involved in a stoppage. <strong>The</strong>y do not<br />
me<strong>as</strong>ure the indirect or secondary effect <strong>of</strong><br />
stoppages on other establishments whose<br />
employees are idle owing to material shortages<br />
or lack <strong>of</strong> service.<br />
Definitions<br />
Number <strong>of</strong> stoppages: <strong>The</strong> number <strong>of</strong><br />
strikes and lockouts involving 1,000 workers<br />
or more and l<strong>as</strong>ting a full shift or longer.<br />
Workers involved: <strong>The</strong> number <strong>of</strong> workers<br />
directly involved in the stoppage.<br />
Number <strong>of</strong> days idle: <strong>The</strong> aggregate
number <strong>of</strong> workdays lost by workers involved<br />
in the stoppages.<br />
Days <strong>of</strong> idleness <strong>as</strong> a percent <strong>of</strong> estimated<br />
working time: Aggregate workdays<br />
lost <strong>as</strong> a percent <strong>of</strong> the aggregate number <strong>of</strong><br />
standard workdays in the period multiplied<br />
by total employment in the period.<br />
Notes on the data<br />
This series is not comparable with the one<br />
terminated in 1981 that covered strikes involving<br />
six workers or more.<br />
ADDITIONAL INFORMATION on work<br />
stop-pages data is available at www. bls.<br />
gov/cba/home.htm or by telephone at (202)<br />
691–6199.<br />
Price Data<br />
(Tables 2; 38–46)<br />
Price data are gathered by the Bureau<br />
<strong>of</strong> Labor Statistics from retail and primary<br />
markets in the United States. Price<br />
indexes are given in relation to a b<strong>as</strong>e period—December<br />
2003 = 100 for many Producer<br />
Price Indexes (unless otherwise noted),<br />
1982–84 = 100 for many Consumer Price<br />
Indexes (unless otherwise noted), and 1990<br />
= 100 for International Price Indexes.<br />
Consumer Price Indexes<br />
Description <strong>of</strong> the series<br />
<strong>The</strong> Consumer Price Index (CPI) is a me<strong>as</strong>ure<br />
<strong>of</strong> the average change in the prices paid by<br />
urban consumers for a fixed market b<strong>as</strong>ket<br />
<strong>of</strong> goods and services. <strong>The</strong> CPI is calculated<br />
monthly for two population groups, one<br />
consisting only <strong>of</strong> urban households whose<br />
primary source <strong>of</strong> income is derived from<br />
the employment <strong>of</strong> wage earners and clerical<br />
workers, and the other consisting <strong>of</strong> all urban<br />
households. <strong>The</strong> wage earner index (CPI-W) is<br />
a continuation <strong>of</strong> the historic index that w<strong>as</strong><br />
introduced well over a half-century ago for<br />
use in wage negotiations. As new uses were<br />
developed for the CPI in recent years, the need<br />
for a broader and more representative index<br />
became apparent. <strong>The</strong> all-urban consumer<br />
index (CPI-U), introduced in 1978, is representative<br />
<strong>of</strong> the 1993–95 buying habits <strong>of</strong> about<br />
87 percent <strong>of</strong> the noninstitutional population<br />
<strong>of</strong> the United States at that time, compared<br />
with 32 percent represented in the CPI-W. In<br />
addition to wage earners and clerical workers,<br />
the CPI-U covers pr<strong>of</strong>essional, managerial, and<br />
technical workers, the self-employed, shortterm<br />
workers, the unemployed, retirees, and<br />
others not in the labor force.<br />
<strong>The</strong> CPI is b<strong>as</strong>ed on prices <strong>of</strong> food, clothing,<br />
shelter, fuel, drugs, transportation fares, doctors’<br />
and dentists’ fees, and other goods and services<br />
that people buy for day-to-day living. <strong>The</strong><br />
quantity and quality <strong>of</strong> these items are kept<br />
essentially unchanged between major revisions<br />
so that only price changes will be me<strong>as</strong>ured. All<br />
taxes directly <strong>as</strong>sociated with the purch<strong>as</strong>e and<br />
use <strong>of</strong> items are included in the index.<br />
Data collected from more than 23,000 retail<br />
establishments and 5,800 housing units in 87<br />
urban are<strong>as</strong> across the country are used to develop<br />
the “U.S. city average.” Separate estimates<br />
for 14 major urban centers are presented in table<br />
39. <strong>The</strong> are<strong>as</strong> listed are <strong>as</strong> indicated in footnote 1<br />
to the table. <strong>The</strong> area indexes me<strong>as</strong>ure only the<br />
average change in prices for each area since the<br />
b<strong>as</strong>e period, and do not indicate differences in<br />
the level <strong>of</strong> prices among cities.<br />
Notes on the data<br />
In January 1983, the Bureau changed the way<br />
in which homeownership costs are meaured<br />
for the CPI-U. A rental equivalence method<br />
replaced the <strong>as</strong>set-price approach to homeownership<br />
costs for that series. In January 1985,<br />
the same change w<strong>as</strong> made in the CPI-W. <strong>The</strong><br />
central purpose <strong>of</strong> the change w<strong>as</strong> to separate<br />
shelter costs from the <strong>investment</strong> component<br />
<strong>of</strong> homeownership so that the index would<br />
reflect only the cost <strong>of</strong> shelter services provided<br />
by owner-occupied homes. An updated CPI-U<br />
and CPI-W were introduced with rele<strong>as</strong>e <strong>of</strong> the<br />
January 1987 and January 1998 data.<br />
FOR ADDITIONAL INFORMATION, contact<br />
the Division <strong>of</strong> Prices and Price Indexes:<br />
(202) 691–7000.<br />
Producer Price Indexes<br />
Description <strong>of</strong> the series<br />
Producer Price Indexes (PPI) me<strong>as</strong>ure average<br />
changes in prices received by domestic<br />
producers <strong>of</strong> commodities in all stages <strong>of</strong><br />
processing. <strong>The</strong> sample used for calculating<br />
these indexes currently contains about 3,200<br />
commodities and about 80,000 quotations<br />
per month, selected to represent the movement<br />
<strong>of</strong> prices <strong>of</strong> all commodities produced<br />
in the manufacturing; agriculture, forestry,<br />
and fishing; mining; and g<strong>as</strong> and electricity<br />
and public utilities sectors. <strong>The</strong> stage-<strong>of</strong>-processing<br />
structure <strong>of</strong> PPI organizes products by<br />
cl<strong>as</strong>s <strong>of</strong> buyer and degree <strong>of</strong> fabrication (that is,<br />
finished goods, intermediate goods, and crude<br />
materials). <strong>The</strong> traditional commodity structure<br />
<strong>of</strong> PPI organizes products by similarity <strong>of</strong><br />
end use or material composition. <strong>The</strong> industry<br />
and product structure <strong>of</strong> PPI organizes data in<br />
accordance with the 2002 North American<br />
Industry Cl<strong>as</strong>sification System and product<br />
codes developed by the U.S. Census Bureau.<br />
To the extent possible, prices used in<br />
calculating Producer Price Indexes apply to<br />
the first significant commercial transaction<br />
in the United States from the production<br />
or central marketing point. Price data are<br />
generally collected monthly, primarily by<br />
mail questionnaire. Most prices are obtained<br />
directly from producing companies on a voluntary<br />
and confidential b<strong>as</strong>is. Prices generally<br />
are reported for the Tuesday <strong>of</strong> the week<br />
containing the 13th day <strong>of</strong> the month.<br />
Since January 1992, price changes for<br />
the various commodities have been averaged<br />
together with implicit quantity weights representing<br />
their importance in the total net<br />
selling value <strong>of</strong> all commodities <strong>as</strong> <strong>of</strong> 1987. <strong>The</strong><br />
detailed data are aggregated to obtain indexes<br />
for stage-<strong>of</strong>-processing groupings, commodity<br />
groupings, durability-<strong>of</strong>-product groupings,<br />
and a number <strong>of</strong> special composite groups. All<br />
Producer Price Index data are subject to revision<br />
4 months after original publication.<br />
FOR ADDITIONAL INFORMATION, contact<br />
the Division <strong>of</strong> Industrial Prices and<br />
Price Indexes: (202) 691–7705.<br />
International Price Indexes<br />
Description <strong>of</strong> the series<br />
<strong>The</strong> International Price Program produces<br />
monthly and quarterly export and import<br />
price indexes for nonmilitary goods and<br />
services traded between the United States<br />
and the rest <strong>of</strong> the world. <strong>The</strong> export price<br />
index provides a me<strong>as</strong>ure <strong>of</strong> price change<br />
for all products sold by U.S. residents to<br />
foreign buyers. (“Residents” is defined <strong>as</strong> in<br />
the national income accounts; it includes<br />
corporations, businesses, and individuals, but<br />
does not require the organizations to be U.S.<br />
owned nor the individuals to have U.S. citizenship.)<br />
<strong>The</strong> import price index provides a<br />
me<strong>as</strong>ure <strong>of</strong> price change for goods purch<strong>as</strong>ed<br />
from other countries by U.S. residents.<br />
<strong>The</strong> product universe for both the import<br />
and export indexes includes raw materials,<br />
agricultural products, semifinished manufactures,<br />
and finished manufactures, including<br />
both capital and consumer goods. Price<br />
data for these items are collected primarily<br />
by mail questionnaire. In nearly all c<strong>as</strong>es,<br />
the data are collected directly from the exporter<br />
or importer, although in a few c<strong>as</strong>es,<br />
prices are obtained from other sources.<br />
To the extent possible, the data gathered<br />
refer to prices at the U.S. border for exports<br />
and at either the foreign border or the U.S.<br />
Monthly Labor Review • November 2008 71
Current Labor Statistics<br />
border for imports. For nearly all products, the<br />
prices refer to transactions completed during<br />
the first week <strong>of</strong> the month. Survey respondents<br />
are <strong>as</strong>ked to indicate all discounts, allowances,<br />
and rebates applicable to the reported<br />
prices, so that the price used in the calculation<br />
<strong>of</strong> the indexes is the actual price for which the<br />
product w<strong>as</strong> bought or sold.<br />
In addition to general indexes <strong>of</strong> prices<br />
for U.S. exports and imports, indexes are also<br />
published for detailed product categories <strong>of</strong> exports<br />
and imports. <strong>The</strong>se categories are defined<br />
according to the five-digit level <strong>of</strong> detail for the<br />
Bureau <strong>of</strong> Economic Analysis End-use Cl<strong>as</strong>sification,<br />
the three-digit level for the Standard<br />
International Trade Cl<strong>as</strong>sification (SITC), and<br />
the four-digit level <strong>of</strong> detail for the Harmonized<br />
System. Aggregate import indexes by<br />
country or region <strong>of</strong> origin are also available.<br />
BLS publishes indexes for selected categories<br />
<strong>of</strong> internationally traded services,<br />
calculated on an international b<strong>as</strong>is and on a<br />
balance-<strong>of</strong>-payments b<strong>as</strong>is.<br />
Notes on the data<br />
<strong>The</strong> export and import price indexes are<br />
weighted indexes <strong>of</strong> the L<strong>as</strong>peyres type. <strong>The</strong><br />
trade weights currently used to compute both<br />
indexes relate to 2000.<br />
Because a price index depends on the same<br />
items being priced from period to period, it<br />
is necessary to recognize when a product’s<br />
specifications or terms <strong>of</strong> transaction have<br />
been modified. For this re<strong>as</strong>on, the Bureau’s<br />
questionnaire requests detailed descriptions <strong>of</strong><br />
the physical and functional characteristics <strong>of</strong><br />
the products being priced, <strong>as</strong> well <strong>as</strong> information<br />
on the number <strong>of</strong> units bought or sold,<br />
discounts, credit terms, packaging, cl<strong>as</strong>s <strong>of</strong><br />
buyer or seller, and so forth. When there are<br />
changes in either the specifications or terms<br />
<strong>of</strong> transaction <strong>of</strong> a product, the dollar value<br />
<strong>of</strong> each change is deleted from the total price<br />
change to obtain the “pure” change. Once<br />
this value is determined, a linking procedure<br />
is employed which allows for the continued<br />
repricing <strong>of</strong> the item.<br />
FOR ADDITIONAL INFORMATION, contact<br />
the Division <strong>of</strong> International Prices:<br />
(202) 691–7155.<br />
Productivity Data<br />
(Tables 2; 47–50)<br />
Business and major sectors<br />
Description <strong>of</strong> the series<br />
<strong>The</strong> productivity me<strong>as</strong>ures relate real output<br />
to real input. As such, they encomp<strong>as</strong>s a fam-<br />
72 Monthly Labor Review • November 2008<br />
ily <strong>of</strong> me<strong>as</strong>ures which include single-factor<br />
input me<strong>as</strong>ures, such <strong>as</strong> output per hour,<br />
output per unit <strong>of</strong> labor input, or output per<br />
unit <strong>of</strong> capital input, <strong>as</strong> well <strong>as</strong> me<strong>as</strong>ures <strong>of</strong><br />
multifactor productivity (output per unit<br />
<strong>of</strong> combined labor and capital inputs). <strong>The</strong><br />
Bureau indexes show the change in output<br />
relative to changes in the various inputs.<br />
<strong>The</strong> me<strong>as</strong>ures cover the business, nonfarm<br />
business, manufacturing, and nonfinancial<br />
corporate sectors.<br />
Corresponding indexes <strong>of</strong> hourly compensation,<br />
unit labor costs, unit nonlabor<br />
payments, and prices are also provided.<br />
Definitions<br />
Output per hour <strong>of</strong> all persons (labor<br />
productivity) is the quantity <strong>of</strong> goods and<br />
services produced per hour <strong>of</strong> labor input.<br />
Output per unit <strong>of</strong> capital services (capital<br />
productivity) is the quantity <strong>of</strong> goods and<br />
services produced per unit <strong>of</strong> capital services<br />
input. Multifactor productivity is the<br />
quantity <strong>of</strong> goods and services produced per<br />
combined inputs. For private business and<br />
private nonfarm business, inputs include<br />
labor and capital units. For manufacturing,<br />
inputs include labor, capital, energy, nonenergy<br />
materials, and purch<strong>as</strong>ed business services.<br />
Compensation per hour is total compensation<br />
divided by hours at work. Total<br />
compensation equals the wages and salaries<br />
<strong>of</strong> employees plus <strong>employer</strong>s’ contributions for<br />
social insurance and private benefit plans, plus<br />
an estimate <strong>of</strong> these payments for the self-employed<br />
(except for nonfinancial corporations<br />
in which there are no self-employed). Real<br />
compensation per hour is compensation per<br />
hour deflated by the change in the Consumer<br />
Price Index for All Urban Consumers.<br />
Unit labor costs are the labor compensation<br />
costs expended in the production <strong>of</strong> a<br />
unit <strong>of</strong> output and are derived by dividing<br />
compensation by output. Unit nonlabor<br />
payments include pr<strong>of</strong>its, depreciation,<br />
interest, and indirect taxes per unit <strong>of</strong> output.<br />
<strong>The</strong>y are computed by subtracting compensation<br />
<strong>of</strong> all persons from current-dollar value<br />
<strong>of</strong> output and dividing by output.<br />
Unit nonlabor costs contain all the components<br />
<strong>of</strong> unit nonlabor payments except<br />
unit pr<strong>of</strong>its.<br />
Unit pr<strong>of</strong>its include corporate pr<strong>of</strong>its<br />
with inventory valuation and capital consumption<br />
adjustments per unit <strong>of</strong> output.<br />
Hours <strong>of</strong> all persons are the total hours<br />
at work <strong>of</strong> payroll workers, self-employed<br />
persons, and unpaid family workers.<br />
Labor inputs are hours <strong>of</strong> all persons<br />
adjusted for the effects <strong>of</strong> changes in the<br />
education and experience <strong>of</strong> the labor force.<br />
Capital services are the flow <strong>of</strong> services<br />
from the capital <strong>stock</strong> used in production. It<br />
is developed from me<strong>as</strong>ures <strong>of</strong> the net <strong>stock</strong><br />
<strong>of</strong> physical <strong>as</strong>sets—equipment, structures,<br />
land, and inventories—weighted by rental<br />
prices for each type <strong>of</strong> <strong>as</strong>set.<br />
Combined units <strong>of</strong> labor and capital<br />
inputs are derived by combining changes in<br />
labor and capital input with weights which<br />
represent each component’s share <strong>of</strong> total<br />
cost. Combined units <strong>of</strong> labor, capital, energy,<br />
materials, and purch<strong>as</strong>ed business services are<br />
similarly derived by combining changes in<br />
each input with weights that represent each<br />
input’s share <strong>of</strong> total costs. <strong>The</strong> indexes for<br />
each input and for combined units are b<strong>as</strong>ed<br />
on changing weights which are averages <strong>of</strong><br />
the shares in the current and preceding year<br />
(the Tornquist index-number formula).<br />
Notes on the data<br />
Business sector output is an annually-weighted<br />
index constructed by excluding from real<br />
gross domestic product (GDP) the following<br />
outputs: general government, nonpr<strong>of</strong>it<br />
institutions, paid employees <strong>of</strong> private households,<br />
and the rental value <strong>of</strong> owner-occupied<br />
dwellings. Nonfarm business also excludes<br />
farming. Private business and private nonfarm<br />
business further exclude government<br />
enterprises. <strong>The</strong> me<strong>as</strong>ures are supplied by<br />
the U.S. Department <strong>of</strong> Commerce’s Bureau<br />
<strong>of</strong> Economic Analysis. Annual estimates <strong>of</strong><br />
manufacturing sectoral output are produced<br />
by the Bureau <strong>of</strong> Labor Statistics. Quarterly<br />
manufacturing output indexes from the<br />
Federal Reserve Board are adjusted to these<br />
annual output me<strong>as</strong>ures by the BLS. Compensation<br />
data are developed from data <strong>of</strong> the<br />
Bureau <strong>of</strong> Economic Analysis and the Bureau<br />
<strong>of</strong> Labor Statistics. Hours data are developed<br />
from data <strong>of</strong> the Bureau <strong>of</strong> Labor Statistics.<br />
<strong>The</strong> productivity and <strong>as</strong>sociated cost<br />
me<strong>as</strong>ures in tables 47–50 describe the relationship<br />
between output in real terms and<br />
the labor and capital inputs involved in its<br />
production. <strong>The</strong>y show the changes from<br />
period to period in the amount <strong>of</strong> goods and<br />
services produced per unit <strong>of</strong> input.<br />
Although these me<strong>as</strong>ures relate output<br />
to hours and capital services, they do not<br />
me<strong>as</strong>ure the contributions <strong>of</strong> labor, capital,<br />
or any other specific factor <strong>of</strong> production.<br />
Rather, they reflect the joint effect <strong>of</strong> many<br />
influences, including changes in technology;<br />
shifts in the composition <strong>of</strong> the labor force;<br />
capital <strong>investment</strong>; level <strong>of</strong> output; changes<br />
in the utilization <strong>of</strong> capacity, energy, material,<br />
and research and development; the organi-
zation <strong>of</strong> production; managerial skill; and<br />
characteristics and efforts <strong>of</strong> the work force.<br />
FOR ADDITIONAL INFORMATION on this<br />
productivity series, contact the Division <strong>of</strong><br />
Productivity Research: (202) 691–5606.<br />
Industry productivity me<strong>as</strong>ures<br />
Description <strong>of</strong> the series<br />
<strong>The</strong> BLS industry productivity indexes me<strong>as</strong>ure<br />
the relationship between output and<br />
inputs for selected industries and industry<br />
groups, and thus reflect trends in industry efficiency<br />
over time. Industry me<strong>as</strong>ures include<br />
labor productivity, multifactor productivity,<br />
compensation, and unit labor costs.<br />
<strong>The</strong> industry me<strong>as</strong>ures differ in methodology<br />
and data sources from the productivity<br />
me<strong>as</strong>ures for the major sectors because the<br />
industry me<strong>as</strong>ures are developed independently<br />
<strong>of</strong> the National Income and Product<br />
Accounts framework used for the major<br />
sector me<strong>as</strong>ures.<br />
Definitions<br />
Output per hour is derived by dividing an<br />
index <strong>of</strong> industry output by an index <strong>of</strong> labor<br />
input. For most industries, output indexes<br />
are derived from data on the value <strong>of</strong> industry<br />
output adjusted for price change. For<br />
the remaining industries, output indexes are<br />
derived from data on the physical quantity<br />
<strong>of</strong> production.<br />
<strong>The</strong> labor input series is b<strong>as</strong>ed on the<br />
hours <strong>of</strong> all workers or, in the c<strong>as</strong>e <strong>of</strong> some<br />
transportation industries, on the number <strong>of</strong><br />
employees. For most industries, the series<br />
consists <strong>of</strong> the hours <strong>of</strong> all employees. For<br />
some trade and services industries, the series<br />
also includes the hours <strong>of</strong> partners, proprietors,<br />
and unpaid family workers.<br />
Unit labor costs represent the labor compensation<br />
costs per unit <strong>of</strong> output produced,<br />
and are derived by dividing an index <strong>of</strong> labor<br />
compensation by an index <strong>of</strong> output. Labor<br />
compensation includes payroll <strong>as</strong> well <strong>as</strong><br />
supplemental payments, including both<br />
legally required expenditures and payments<br />
for voluntary programs.<br />
Multifactor productivity is derived by<br />
dividing an index <strong>of</strong> industry output by an index<br />
<strong>of</strong> combined inputs consumed in producing<br />
that output. Combined inputs include<br />
capital, labor, and intermediate purch<strong>as</strong>es.<br />
<strong>The</strong> me<strong>as</strong>ure <strong>of</strong> capital input represents the<br />
flow <strong>of</strong> services from the capital <strong>stock</strong> used<br />
in production. It is developed from me<strong>as</strong>ures<br />
<strong>of</strong> the net <strong>stock</strong> <strong>of</strong> physical <strong>as</strong>sets—equipment,<br />
structures, land, and inventories. <strong>The</strong><br />
me<strong>as</strong>ure <strong>of</strong> intermediate purch<strong>as</strong>es is a<br />
combination <strong>of</strong> purch<strong>as</strong>ed materials, services,<br />
fuels, and electricity.<br />
Notes on the data<br />
<strong>The</strong> industry me<strong>as</strong>ures are compiled from<br />
data produced by the Bureau <strong>of</strong> Labor Statistics<br />
and the Census Bureau, with additional<br />
data supplied by other government agencies,<br />
trade <strong>as</strong>sociations, and other sources.<br />
FOR ADDITIONAL INFORMATION on this<br />
series, contact the Division <strong>of</strong> Industry Productivity<br />
Studies: (202) 691–5618, or visit the<br />
Web site at: www.bls.gov/lpc/home.htm<br />
International Comparisons<br />
(Tables 51–53)<br />
Labor force and unemployment<br />
Description <strong>of</strong> the series<br />
Tables 51 and 52 present comparative<br />
me<strong>as</strong>ures <strong>of</strong> the labor force, employment,<br />
and unemployment approximating U.S.<br />
concepts for the United States, Canada,<br />
Australia, Japan, and six European countries.<br />
<strong>The</strong> Bureau adjusts the figures for these<br />
selected countries, for all known major<br />
definitional differences, to the extent that<br />
data to prepare adjustments are available.<br />
Although precise comparability may not<br />
be achieved, these adjusted figures provide<br />
a better b<strong>as</strong>is for international comparisons<br />
than the figures regularly published<br />
by each country. For further information<br />
on adjustments and comparability issues,<br />
see Constance Sorrentino, “International<br />
unemployment rates: how comparable are<br />
they?” Monthly Labor Review, June 2000,<br />
pp. 3–20, available on the Internet at www.<br />
bls.gov/opub/mlr/2000/06/art1full.pdf.<br />
Definitions<br />
For the principal U.S. definitions <strong>of</strong> the labor<br />
force, employment, and unemployment, see<br />
the Notes section on Employment and Unemployment<br />
Data: Household survey data.<br />
Notes on the data<br />
Foreign country data are adjusted <strong>as</strong> closely<br />
<strong>as</strong> possible to the U.S. definitions. Primary<br />
are<strong>as</strong> <strong>of</strong> adjustment address conceptual differences<br />
in upper age limits and defini-<br />
tions <strong>of</strong> employment and unemployment,<br />
provided that reliable data are available to<br />
make these adjustments. Adjustments are<br />
made where applicable to include employed<br />
and unemployed persons above upper age<br />
limits; some European countries do not<br />
include persons older than age 64 in their<br />
labor force me<strong>as</strong>ures, because a large portion<br />
<strong>of</strong> this population h<strong>as</strong> retired. Adjustments<br />
are made to exclude active duty military<br />
from employment figures, although a small<br />
number <strong>of</strong> career military may be included<br />
in some European countries. Adjustments<br />
are made to exclude unpaid family workers<br />
who worked fewer than 15 hours per week<br />
from employment figures; U.S. concepts do<br />
not include them in employment, where<strong>as</strong><br />
most foreign countries include all unpaid<br />
family workers regardless <strong>of</strong> the number<br />
<strong>of</strong> hours worked. Adjustments are made<br />
to include full-time students seeking work<br />
and available for work <strong>as</strong> unemployed when<br />
they are cl<strong>as</strong>sified <strong>as</strong> not in the labor force.<br />
Where possible, lower age limits are b<strong>as</strong>ed<br />
on the age at which compulsory schooling<br />
ends in each country, rather than b<strong>as</strong>ed on<br />
the U.S. standard <strong>of</strong> 16. Lower age limits<br />
have ranged between 13 and 16 over the years<br />
covered; currently, the lower age limits are<br />
either 15 or 16 in all 10 countries.<br />
Some adjustments for comparability are<br />
not made because data are unavailable for<br />
adjustment purposes. For example, no adjustments<br />
to unemployment are usually made for<br />
deviations from U.S. concepts in the treatment<br />
<strong>of</strong> persons waiting to start a new job or p<strong>as</strong>sive<br />
jobseekers. <strong>The</strong>se conceptual differences have<br />
little impact on the me<strong>as</strong>ures. Furthermore,<br />
BLS studies have concluded that no adjustments<br />
should be made for persons on lay<strong>of</strong>f<br />
who are counted <strong>as</strong> employed in some countries<br />
because <strong>of</strong> their strong job attachment <strong>as</strong><br />
evidenced by, for example, payment <strong>of</strong> salary<br />
or the existence <strong>of</strong> a recall date. In the United<br />
States, persons on lay<strong>of</strong>f have weaker job attachment<br />
and are cl<strong>as</strong>sified <strong>as</strong> unemployed.<br />
<strong>The</strong> annual labor force me<strong>as</strong>ures are obtained<br />
from monthly, quarterly, or continuous<br />
household surveys and may be calculated<br />
<strong>as</strong> averages <strong>of</strong> monthly or quarterly data.<br />
Quarterly and monthly unemployment<br />
rates are b<strong>as</strong>ed on household surveys. For<br />
some countries, they are calculated by applying<br />
annual adjustment factors to current<br />
published data and, therefore, are less<br />
precise indicators <strong>of</strong> unemployment under<br />
U.S. concepts than the annual figures. <strong>The</strong><br />
labor force me<strong>as</strong>ures may have breaks in<br />
series over time due to changes in surveys,<br />
sources, or estimation methods. Breaks are<br />
noted in data tables.<br />
For up-to-date information on adjustments<br />
and breaks in series, see the Technical<br />
Monthly Labor Review • November 2008 73
Current Labor Statistics<br />
Notes <strong>of</strong> Comparative Civilian Labor Force<br />
Statistics, 10 Countries, on the Internet at<br />
www.bls.gov/fls/flscomparelf.htm, and the<br />
Notes <strong>of</strong> Unemployment rates in 10 countries,<br />
civilian labor force b<strong>as</strong>is, approximating U.S.<br />
concepts, se<strong>as</strong>onally adjusted, on the Internet<br />
at www.bls.gov/fls/flsjec.pdf.<br />
FOR ADDITIONAL INFORMATION on<br />
this series, contact the Division <strong>of</strong> Foreign<br />
Labor Statistics: (202) 691-5654 or flshelp@<br />
bls.gov.<br />
Manufacturing productivity<br />
and labor costs<br />
Description <strong>of</strong> the series<br />
Table 53 presents comparative indexes <strong>of</strong><br />
manufacturing output per hour (labor productivity),<br />
output, total hours, compensation<br />
per hour, and unit labor costs for the United<br />
States, Australia, Canada, Japan, the Republic<br />
<strong>of</strong> Korea, Taiwan, and 10 European countries.<br />
<strong>The</strong>se me<strong>as</strong>ures are trend comparisons—that<br />
is, series that me<strong>as</strong>ure changes over time—<br />
rather than level comparisons. BLS does<br />
not recommend using these series for level<br />
comparisons because <strong>of</strong> technical problems.<br />
BLS constructs the comparative indexes<br />
from three b<strong>as</strong>ic aggregate me<strong>as</strong>ures—output,<br />
total labor hours, and total compensation.<br />
<strong>The</strong> hours and compensation me<strong>as</strong>ures<br />
refer to employees (wage and salary earners)<br />
in Belgium and Taiwan. For all other economies,<br />
the me<strong>as</strong>ures refer to all employed<br />
persons, including employees, self-employed<br />
persons, and unpaid family workers.<br />
<strong>The</strong> data for recent years are b<strong>as</strong>ed on the<br />
United Nations System <strong>of</strong> National Accounts<br />
1993 (SNA 93). Manufacturing is generally defined<br />
according to the International Standard<br />
Industrial Cl<strong>as</strong>sification (ISIC). However, the<br />
me<strong>as</strong>ures for France include parts <strong>of</strong> mining<br />
<strong>as</strong> well. For the United States and Canada, it<br />
is defined according to the North American<br />
Industry Cl<strong>as</strong>sification System (NAICS 97).<br />
Definitions<br />
Output. For most economies, the output<br />
me<strong>as</strong>ures are real value added in manufacturing<br />
from national accounts. However,<br />
output for Japan prior to 1970 and<br />
for the Netherlands prior to 1960 are<br />
indexes <strong>of</strong> industrial production. <strong>The</strong><br />
manufacturing value added me<strong>as</strong>ures for the<br />
United Kingdom are essentially identical<br />
to their indexes <strong>of</strong> industrial production.<br />
For United States, the output me<strong>as</strong>ure for<br />
the manufacturing sector is a chain-weighted<br />
74 Monthly Labor Review • November 2008<br />
index <strong>of</strong> real gross product originating (deflated<br />
value added) produced by the Bureau<br />
<strong>of</strong> Economic Analysis <strong>of</strong> the U.S. Department<br />
<strong>of</strong> Commerce. Most <strong>of</strong> the other<br />
economies now also use chain-weighted<br />
<strong>as</strong> opposed to a fixed-year weights that are<br />
periodically updated.<br />
To preserve the comparability <strong>of</strong> the U.S.<br />
me<strong>as</strong>ures with those <strong>of</strong> other economies,<br />
BLS uses gross product originating in manufacturing<br />
for the United States. <strong>The</strong> gross<br />
product originating series differs from the<br />
manufacturing output series that BLS publishes<br />
in its quarterly news rele<strong>as</strong>es on U.S.<br />
productivity and costs (and that underlies the<br />
me<strong>as</strong>ures that appear in tables 48 and 50 in<br />
this section). <strong>The</strong> quarterly me<strong>as</strong>ures are on<br />
a “sectoral output” b<strong>as</strong>is, rather than a valueadded<br />
b<strong>as</strong>is. Sectoral output is gross output<br />
less intr<strong>as</strong>ector transactions.<br />
Total hours refer to hours worked in all<br />
economies. <strong>The</strong> me<strong>as</strong>ures are developed from<br />
statistics <strong>of</strong> manufacturing employment and<br />
average hours. For most other economies, recent<br />
years’ aggregate hours series are obtained<br />
from national statistical <strong>of</strong>fices, usually from<br />
national accounts. However, for some economies<br />
and for earlier years, BLS calculates the<br />
aggregate hours series using employment<br />
figures published with the national accounts,<br />
or other comprehensive employment series,<br />
and data on average hours worked.<br />
Hourly compensation is total compensation<br />
divided by total hours. Total compensation<br />
includes all payments in c<strong>as</strong>h or in-kind<br />
made directly to employees plus <strong>employer</strong><br />
expenditures for legally required insurance<br />
programs and contractual and private benefit<br />
plans. For Australia, Canada, France,<br />
and Sweden, compensation is incre<strong>as</strong>ed<br />
to account for important taxes on payroll<br />
or employment. For the United Kingdom,<br />
compensation is reduced between 1967 and<br />
1991 to account for subsidies.<br />
Labor productivity is defined <strong>as</strong> real<br />
output per hour worked. Although the labor<br />
productivity me<strong>as</strong>ure presented in this rele<strong>as</strong>e<br />
relates output to the hours worked <strong>of</strong> persons<br />
employed in manufacturing, it does not me<strong>as</strong>ure<br />
the specific contributions <strong>of</strong> labor <strong>as</strong> a single<br />
factor <strong>of</strong> production. Rather, it reflects the joint<br />
effects <strong>of</strong> many influences, including new technology,<br />
capital <strong>investment</strong>, capacity utilization,<br />
energy use, and managerial skills, <strong>as</strong> well <strong>as</strong> the<br />
skills and efforts <strong>of</strong> the workforce.<br />
Unit labor costs are defined <strong>as</strong> the cost<br />
<strong>of</strong> labor input required to produce one unit<br />
<strong>of</strong> output. <strong>The</strong>y are computed <strong>as</strong> compensation<br />
in nominal terms divided by real output.<br />
Unit labor costs can also be computed by<br />
dividing hourly compensation by output per<br />
hour, that is, by labor productivity.<br />
Notes on the data<br />
<strong>The</strong> me<strong>as</strong>ures for recent years may be<br />
b<strong>as</strong>ed on current indicators <strong>of</strong> manufacturing<br />
output (such <strong>as</strong> industrial production<br />
indexes), employment, average hours, and<br />
hourly compensation until national accounts<br />
and other statistics used for the<br />
long-term me<strong>as</strong>ures become available.<br />
FOR ADDITIONAL INFORMATION on<br />
this series, go to http://www.bls.gov/news.<br />
rele<strong>as</strong>e/prod4.toc.htm or contact the Division<br />
<strong>of</strong> Foreign Labor Statistics at (202)<br />
691–5654.<br />
Occupational Injury<br />
and Illness Data<br />
(Tables 54–55)<br />
Survey <strong>of</strong> Occupational Injuries<br />
and Illnesses<br />
Description <strong>of</strong> the series<br />
<strong>The</strong> Survey <strong>of</strong> Occupational Injuries and<br />
Illnesses collects data from <strong>employer</strong>s about<br />
their workers’ job-related nonfatal injuries<br />
and illnesses. <strong>The</strong> information that <strong>employer</strong>s<br />
provide is b<strong>as</strong>ed on records that they maintain<br />
under the Occupational Safety and Health<br />
Act <strong>of</strong> 1970. Self-employed individuals, farms<br />
with fewer than 11 employees, <strong>employer</strong>s<br />
regulated by other Federal safety and health<br />
laws, and Federal, State, and local government<br />
agencies are excluded from the survey.<br />
<strong>The</strong> survey is a Federal-State cooperative<br />
program with an independent sample selected<br />
for each participating State. A stratified<br />
random sample with a Neyman allocation<br />
is selected to represent all private industries<br />
in the State. <strong>The</strong> survey is stratified by Standard<br />
Industrial Cl<strong>as</strong>sification and size <strong>of</strong><br />
employment.<br />
Definitions<br />
Under the Occupational Safety and Health<br />
Act, <strong>employer</strong>s maintain records <strong>of</strong> nonfatal<br />
work-related injuries and illnesses that involve<br />
one or more <strong>of</strong> the following: loss <strong>of</strong><br />
consciousness, restriction <strong>of</strong> work or motion,<br />
transfer to another job, or medical treatment<br />
other than first aid.<br />
Occupational injury is any injury such<br />
<strong>as</strong> a cut, fracture, sprain, or amputation that<br />
results from a work-related event or a single,<br />
instantaneous exposure in the work environment.<br />
Occupational illness is an abnormal
condition or disorder, other than one resulting<br />
from an occupational injury, caused by<br />
exposure to factors <strong>as</strong>sociated with employment.<br />
It includes acute and chronic illnesses<br />
or dise<strong>as</strong>e which may be caused by inhalation,<br />
absorption, ingestion, or direct contact.<br />
Lost workday injuries and illnesses are<br />
c<strong>as</strong>es that involve days away from work, or<br />
days <strong>of</strong> restricted work activity, or both.<br />
Lost workdays include the number <strong>of</strong><br />
workdays (consecutive or not) on which the<br />
employee w<strong>as</strong> either away from work or at<br />
work in some restricted capacity, or both,<br />
because <strong>of</strong> an occupational injury or illness.<br />
BLS me<strong>as</strong>ures <strong>of</strong> the number and incidence<br />
rate <strong>of</strong> lost workdays were discontinued beginning<br />
with the 1993 survey. <strong>The</strong> number<br />
<strong>of</strong> days away from work or days <strong>of</strong> restricted<br />
work activity does not include the day <strong>of</strong> injury<br />
or onset <strong>of</strong> illness or any days on which the<br />
employee would not have worked, such <strong>as</strong> a<br />
Federal holiday, even though able to work.<br />
Incidence rates are computed <strong>as</strong> the<br />
number <strong>of</strong> injuries and/or illnesses or lost<br />
work days per 100 full-time workers.<br />
Notes on the data<br />
<strong>The</strong> definitions <strong>of</strong> occupational injuries and<br />
illnesses are from Recordkeeping Guidelines<br />
for Occupational Injuries and Illnesses (U.S.<br />
Department <strong>of</strong> Labor, Bureau <strong>of</strong> Labor Statistics,<br />
September 1986).<br />
Estimates are made for industries and employment<br />
size cl<strong>as</strong>ses for total recordable c<strong>as</strong>es,<br />
lost workday c<strong>as</strong>es, days away from work c<strong>as</strong>es,<br />
and nonfatal c<strong>as</strong>es without lost workdays. <strong>The</strong>se<br />
data also are shown separately for injuries.<br />
Illness data are available for seven categories:<br />
occupational skin dise<strong>as</strong>es or disorders, dust<br />
dise<strong>as</strong>es <strong>of</strong> the lungs, respiratory conditions<br />
due to toxic agents, poisoning (systemic<br />
effects <strong>of</strong> toxic agents), disorders due to<br />
physical agents (other than toxic materials),<br />
disorders <strong>as</strong>sociated with repeated trauma,<br />
and all other occupational illnesses.<br />
<strong>The</strong> survey continues to me<strong>as</strong>ure the<br />
number <strong>of</strong> new work-related illness c<strong>as</strong>es<br />
which are recognized, diagnosed, and reported<br />
during the year. Some conditions, for<br />
example, long-term latent illnesses caused<br />
by exposure to carcinogens, <strong>of</strong>ten are difficult<br />
to relate to the workplace and are not<br />
adequately recognized and reported. <strong>The</strong>se<br />
long-term latent illnesses are believed to be<br />
understated in the survey’s illness me<strong>as</strong>ure. In<br />
contr<strong>as</strong>t, the overwhelming majority <strong>of</strong> the<br />
reported new illnesses are those which are<br />
e<strong>as</strong>ier to directly relate to workplace activity<br />
(for example, contact dermatitis and carpal<br />
tunnel syndrome).<br />
Most <strong>of</strong> the estimates are in the form<br />
<strong>of</strong> incidence rates, defined <strong>as</strong> the number<br />
<strong>of</strong> injuries and illnesses per 100 equivalent<br />
full-time workers. For this purpose, 200,000<br />
employee hours represent 100 employee years<br />
(2,000 hours per employee). Full detail on the<br />
available me<strong>as</strong>ures is presented in the annual<br />
bulletin, Occupational Injuries and Illnesses:<br />
Counts, Rates, and Characteristics.<br />
Comparable data for more than 40 States<br />
and territories are available from the bls<br />
Office <strong>of</strong> Safety, Health and Working Conditions.<br />
Many <strong>of</strong> these States publish data<br />
on State and local government employees in<br />
addition to private industry data.<br />
Mining and railroad data are furnished to<br />
BLS by the Mine Safety and Health Administration<br />
and the Federal Railroad Administration.<br />
Data from these organizations are<br />
included in both the national and State data<br />
published annually.<br />
With the 1992 survey, BLS began publishing<br />
details on serious, nonfatal incidents<br />
resulting in days away from work. Included<br />
are some major characteristics <strong>of</strong> the injured<br />
and ill workers, such <strong>as</strong> occupation, age, gender,<br />
race, and length <strong>of</strong> service, <strong>as</strong> well <strong>as</strong> the<br />
circumstances <strong>of</strong> their injuries and illnesses<br />
(nature <strong>of</strong> the disabling condition, part <strong>of</strong><br />
body affected, event and exposure, and the<br />
source directly producing the condition). In<br />
general, these data are available nationwide<br />
for detailed industries and for individual<br />
States at more aggregated industry levels.<br />
FOR ADDITIONAL INFORMATION on occupational<br />
injuries and illnesses, contact the<br />
Office <strong>of</strong> Occupational Safety, Health and<br />
Working Conditions at (202) 691–6180, or<br />
access the Internet at: www.bls. gov/iif/<br />
Census <strong>of</strong> Fatal<br />
Occupational Injuries<br />
<strong>The</strong> Census <strong>of</strong> Fatal Occupational Injuries<br />
compiles a complete roster <strong>of</strong> fatal job-related<br />
injuries, including detailed data about the<br />
fatally injured workers and the fatal events.<br />
<strong>The</strong> program collects and cross checks fatality<br />
information from multiple sources, including<br />
death certificates, State and Federal workers’<br />
compensation reports, Occupational Safety<br />
and Health Administration and Mine Safety<br />
and Health Administration records, medical<br />
examiner and autopsy reports, media accounts,<br />
State motor <strong>vehicle</strong> fatality records,<br />
and follow-up questionnaires to <strong>employer</strong>s.<br />
In addition to private wage and salary<br />
workers, the self-employed, family members,<br />
and Federal, State, and local government<br />
workers are covered by the program.<br />
To be included in the fatality census, the<br />
decedent must have been employed (that is<br />
working for pay, compensation, or pr<strong>of</strong>it)<br />
at the time <strong>of</strong> the event, engaged in a legal<br />
work activity, or present at the site <strong>of</strong> the<br />
incident <strong>as</strong> a requirement <strong>of</strong> his or her job.<br />
Definition<br />
A fatal work injury is any intentional or<br />
unintentional wound or damage to the body<br />
resulting in death from acute exposure to<br />
energy, such <strong>as</strong> heat or electricity, or kinetic<br />
energy from a cr<strong>as</strong>h, or from the absence <strong>of</strong><br />
such essentials <strong>as</strong> heat or oxygen caused by a<br />
specific event or incident or series <strong>of</strong> events<br />
within a single workday or shift. Fatalities<br />
that occur during a person’s commute to or<br />
from work are excluded from the census,<br />
<strong>as</strong> well <strong>as</strong> work-related illnesses,which can<br />
be difficult to identify due to long latency<br />
periods.<br />
Notes on the data<br />
Twenty-eight data elements are collected,<br />
coded, and tabulated in the fatality program,<br />
including information about the fatally<br />
injured worker, the fatal incident, and the<br />
machinery or equipment involved. Summary<br />
worker demographic data and event<br />
characteristics are included in a national news<br />
rele<strong>as</strong>e that is available about 8 months after<br />
the end <strong>of</strong> the reference year. <strong>The</strong> Census<br />
<strong>of</strong> Fatal Occupational Injuries w<strong>as</strong> initiated<br />
in 1992 <strong>as</strong> a joint Federal-State effort.<br />
Most States issue summary information<br />
at the time <strong>of</strong> the national news rele<strong>as</strong>e.<br />
FOR ADDITIONAL INFORMATION on<br />
the Census <strong>of</strong> Fatal Occupational Injuries<br />
contact the BLS Office <strong>of</strong> Safety, Health,<br />
and Working Conditions at (202) 691–<br />
6175, or the Internet at: www.bls.gov/iif/<br />
Monthly Labor Review • November 2008 75
Current Labor Statistics: Comparative Indicators<br />
���������������������������<br />
������������������� ����<br />
����<br />
���������������������<br />
76 Monthly Labor Review • November 2008<br />
���� ���� ����<br />
��� �� � �� ��� �� � �� ���<br />
Employment status <strong>of</strong> the civilian noninstitutional<br />
population (household survey): 1<br />
Labor force participation rate........................................................ 66.2 66.0 66.2 66.3 66.2 66.0 66.0 66.0 66.0 66.1 66.1<br />
Employment-population ratio........................................................ 63.1 63.0 63.1 63.4 63.2 63.0 62.9 62.8 62.7 62.6 62.2<br />
Unemploy������������������������������ 4.6 4.6 4.7 4.4 4.5 4.5 4.7 4.8 4.9 5.3 6.0<br />
��������������������������������������� 4.6 4.7 4.6 4.5 4.6 4.6 4.8 4.9 5.0 5.5 6.4<br />
16 to 24 years........................................................................... 11.2 11.6 11.4 11.0 10.8 11.5 11.8 12.2 12.7 13.3 14.6<br />
25 years and older.................................................................... 3.5 3.6 3.5 3.3 3.6 3.5 3.6 3.7 3.8 4.2 5.0<br />
�������������������������������������� 4.6 4.5 4.7 4.4 4.4 4.4 4.6 4.7 4.8 5.1 5.5<br />
16 to 24 years........................................................................... 9.7 9.4 10.1 9.7 9.0 9.0 9.8 9.9 10.0 11.0 11.7<br />
25 years and older....................................................................<br />
Employment, nonfarm (payroll data), in thousands:<br />
3.7 3.6 3.8 3.5 3.5 3.6 3.7 3.8 3.9 4.1 4.5<br />
1<br />
����������������������������������������������������������������������������� ������� 137,626 136,528 136,982 137,310 137,625 137,837 138,078 137,831 137,617 137,318<br />
Total private....................................................................... 114,113 115,423 114,472 114,899 115,167 115,423 115,610 115,759 115,454 115,154 114,776<br />
Goods-producing������������������������� 22,531 22,221 22,564 22,436 22,362 22,267 22,138 21,976 21,737 21,491 21,303<br />
Manufacturing����������������������� 14,155 13,883 14,138 14,033 13,953 13,890 13,822 13,772 13,644 13,527 13,380<br />
Service-providing��������������������������113,556<br />
Average hours:<br />
115,405 113,964 114,546 114,948 115,358 115,699 116,102 116,094 116,126 116,015<br />
������������������������������������������������������������������������������������������ ���� ���� ���� ���� ���� ���� ���� ���� ���� �3.7 33.6<br />
Manufacturing����������������������� ���� ���� ���� ���� ���� ���� ���� ���� ���� ���� ����<br />
�����������������������������������������������<br />
���������������������������<br />
4.4 4.2 4.4 4.2 4.1 4.1 4.2 4.0 4.0 3.8 3.6<br />
�������<br />
Total compensation:<br />
Civilian nonfarm 4 ��������������������������� 3.3 3.3 1.1 .6 .9 .8 1.0 .6 .8 .7 .8<br />
���������������������������������������������������������������������������� ��� ��� �� �� �� �� �� �� �� �� ��<br />
Goods-producing 5 ����������������������� 2.5 2.4 .7 .5 .4 1.0 .5 .6 1.0 .7 .4<br />
Service-providing 5 ����������������������� 3.4 3.2 .9 .7 .9 .9 .9 .6 .9 .7 .6<br />
State and local g��������������������������<br />
Workers by bargaining status (private nonfarm):<br />
��� ��� ��� �� ��� �� ��� �� �� �� ���<br />
����������������������������������� ��� ��� �� �� ��� ��� �� �� �� �� ��<br />
������������������������������������� 3.2 3.2 .9 .6 1.0 .9 .8 .6 .9 .7 .6<br />
4<br />
Excludes Federal and private household workers.<br />
5<br />
Goods-producing industries include mining, construction, and manufacturing. Serviceproviding<br />
industries include all other private sector industries.<br />
1<br />
Quarterly data se<strong>as</strong>onally adjusted.<br />
2<br />
Annual changes are December-to-December changes. Quarterly changes<br />
are calculated using the l<strong>as</strong>t month <strong>of</strong> each quarter.<br />
3<br />
<strong>The</strong> Employment Cost Index data reflect the conversion to the 2002 North<br />
American Cl<strong>as</strong>sification System (NAICS) and the 2000 Standard Occupational<br />
Cl<strong>as</strong>sification (SOC) system. <strong>The</strong> NAICS and SOC data shown prior to 2006 are<br />
for informational purposes only. Series b<strong>as</strong>ed on NAICS and SOC became the<br />
<strong>of</strong>ficial BLS estimates starting in March 2006.<br />
NOTE: Beginning in January 2003, household survey data reflect revised population<br />
controls. Nonfarm data reflect the conversion to the 2002 version <strong>of</strong> the North<br />
American Industry Cl<strong>as</strong>sification System (NAICS), replacing the Standard Industrial<br />
Cl<strong>as</strong>sification (SIC) system. NAICS-b<strong>as</strong>ed data by industry are not comparable with SIC<br />
b<strong>as</strong>ed data.
2. Annual and quarterly percent changes in compensation, prices, and productivity<br />
Selected me<strong>as</strong>ures 2006 2007<br />
1, 2, 3<br />
Compensation data<br />
2006 2007 2008<br />
III IV I II III IV I II III<br />
Employment Cost Index—compensation:<br />
Civilian nonfarm................................................................... 3.3 3.3 1.1 0.6 0.9 0.8 1.0 0.6 0.8 0.7 0.8<br />
Private nonfarm...............................................................<br />
Employment Cost Index—wages and salaries:<br />
3.2 3.0 .8 .7 .8 .9 .8 .6 .9 .7 .6<br />
Civilian nonfarm………………………………………………. 3.2 3.4 1.1 .6 1.1 .7 1.0 .7 .8 .7 .8<br />
Private nonfarm...............................................................<br />
Price data<br />
3.2 3.3 .8 .7 1.1 .8 .9 .6 .9 .7 .6<br />
1<br />
Consumer Price Index (All Urban Consumers): All Items...... 3.2 2.8 .0 -.5 1.8 1.5 .1 .7 1.7 2.5 .0<br />
Producer Price Index:<br />
Finished goods..................................................................... 3.0 3.9 -.9 .1 2.2 1.9 .1 1.8 2.8 4.2 -.3<br />
Finished consumer goods................................................. 3.5 4.5 -1.3 -.2 2.8 2.5 .2 1.9 3.4 5.3 -.6<br />
Capital equipment…………………………………………… 1.6 1.8 .0 1.3 .3 -.1 -.1 1.2 .7 .6 1.0<br />
Intermediate materials, supplies, and components………… 6.5 4.0 -.4 -.8 1.5 3.2 .1 2.0 5.0 6.7 .9<br />
Crude materials.....................................................................<br />
Productivity data<br />
1.4 12.2 1.2 4.0 5.7 3.8 -2.4 11.9 14.5 16.4 -15.5<br />
4<br />
Output per hour <strong>of</strong> all persons:<br />
Business sector..................................................................... .9 1.5 -2.0 .2 -.1 5.0 6.2 .1 2.3 3.7 1.3<br />
Nonfarm business sector....................................................... 1.0 1.4 -2.1 .2 .0 4.1 5.8 .8 2.6 3.6 1.1<br />
Nonfinancial corporations 5 ……………….…………...……………… 2.1 .9 2.7 -2.6 .4 3.4 1.8 1.9 -.2 8.6 -<br />
1<br />
Annual changes are December-to-December changes. Quarterly changes are<br />
calculated using the l<strong>as</strong>t month <strong>of</strong> each quarter. Compensation and price data are not<br />
se<strong>as</strong>onally adjusted, and the price data are not compounded.<br />
2<br />
Excludes Federal and private household workers.<br />
3<br />
<strong>The</strong> Employment Cost Index data reflect the conversion to the 2002 North American<br />
Cl<strong>as</strong>sification System (NAICS) and the 2000 Standard Occupational Cl<strong>as</strong>sification (SOC)<br />
system. <strong>The</strong> NAICS and SOC data shown prior to 2006 are for informational purposes<br />
only. Series b<strong>as</strong>ed on NAICS and SOC became the <strong>of</strong>ficial BLS estimates starting in<br />
March 2006.<br />
4<br />
Annual rates <strong>of</strong> change are computed by comparing annual averages. Quarterly<br />
percent changes reflect annual rates <strong>of</strong> change in quarterly indexes. <strong>The</strong> data are<br />
se<strong>as</strong>onally adjusted.<br />
5<br />
Output per hour <strong>of</strong> all employees.<br />
3. Alternative me<strong>as</strong>ures <strong>of</strong> wage and compensation changes<br />
Quarterly change Four quarters ending—<br />
Components 2007 2008 2007 2008<br />
III IV I II III III IV I II III<br />
Average hourly compensation: 1<br />
All persons, business sector.......................................................... 3.6 4.4 3.6 3.8 4.7 4.8 3.7 3.4 3.9 4.1<br />
All persons, nonfarm business sector...........................................<br />
Employment Cost Index—compensation:<br />
3.3 5.3 3.8 3.5 4.7 4.5 3.6 3.3 4.0 4.3<br />
2<br />
Civilian nonfarm 3 ……….………………………………………….…………..… 1.0 .6 .8 .7 .8 3.3 3.3 3.3 3.1 2.9<br />
Private nonfarm…....................................................................... .8 .6 .9 .7 .6 3.1 3.0 3.2 3.0 2.8<br />
Union………….......................................................................... .5 .7 .8 .8 .7 2.0 2.0 3.1 2.7 2.9<br />
Nonunion………….................................................................... .8 .6 .9 .7 .6 3.2 3.2 3.2 3.0 2.8<br />
State and local government….....................................................<br />
Employment Cost Index—wages and salaries:<br />
1.8 .7 .5 .5 1.7 4.3 4.1 3.6 3.5 3.4<br />
2<br />
Civilian nonfarm 3 ……….………………………………………….…………..… 1.0 .7 .8 .7 .8 3.3 3.4 3.2 3.2 3.1<br />
Private nonfarm…....................................................................... .9 .6 .9 .7 .6 3.4 3.3 3.2 3.1 2.9<br />
Union………….......................................................................... .7 .3 .8 1.1 .7 2.7 2.3 2.6 2.9 2.9<br />
Nonunion………….................................................................... .9 .7 .9 .7 .6 3.4 3.5 3.3 3.2 3.0<br />
State and local government…..................................................... 1.7 .7 .6 .5 1.8 3.5 3.5 3.5 3.4 3.5<br />
1<br />
Se<strong>as</strong>onally adjusted. "Quarterly average" is percent change from a<br />
quarter ago, at an annual rate.<br />
2<br />
<strong>The</strong> Employment Cost Index data reflect the conversion to the 2002<br />
North American Cl<strong>as</strong>sification System (NAICS) and the 2000 Standard<br />
Occupational Cl<strong>as</strong>sification (SOC) system. <strong>The</strong> NAICS and SOC data shown<br />
prior to 2006 are for informational purposes only. Series b<strong>as</strong>ed on NAICS<br />
and SOC became the <strong>of</strong>ficial BLS estimates starting in March 2006.<br />
3<br />
Excludes Federal and private household workers.<br />
Monthly Labor Review • November 2008 77
Current Labor Statistics: Labor Force Data<br />
4. Employment status <strong>of</strong> the population, by sex, age, race, and Hispanic origin, monthly data se<strong>as</strong>onally adjusted<br />
����������������������<br />
Annual average 2007 2008<br />
2006 2007 Sept. Oct. Nov. Dec. Jan. Feb. Mar. Apr. May June July Aug. Sept.<br />
TOTAL<br />
��������������������������<br />
population 1 ……………………. 228,815 231,867 232,461 232,715 232,939 233,156 232,616 232,809 232,995 233,198 233,405 233,627 233,864 234,107 234,360<br />
Civilian labor force.............. 151,428 153,124 153,506 153,306 153,828 153,866 153,824 153,374 153,784 153,957 154,534 154,390 154,603 154,853 154,732<br />
Participation rate........... 66.2 66.0 66.0 65.9 66.0 66.0 66.1 65.9 66.0 66.0 66.2 66.1 66.1 66.1 66.0<br />
Employed........................ 144,427<br />
Employment-pop-<br />
146,047 146,260 146,016 146,647 146,211 146,248 145,993 145,969 146,331 146,046 145,891 145,819 145,477 145,255<br />
ulation ratio 2 …………… 63.1 63.0 62.9 62.7 63.0 62.7 62.9 62.7 62.6 62.7 62.6 62.4 62.4 62.1 62.0<br />
Unemployed................... 7,001 7,078 7,246 7,291 7,181 7,655 7,576 7,381 7,815 7,626 8,487 8,499 8,784 9,376 9,477<br />
Unemployment rate..... 4.6 4.6 4.7 4.8 4.7 5.0 4.9 4.8 5.1 5.0 5.5 5.5 5.7 6.1 6.1<br />
Not in the labor force........<br />
Men, 20 years and over<br />
��������������������������<br />
77,387 78,743 78,955 79,409 79,111 79,290 78,792 79,436 79,211 79,241 78,871 79,237 79,261 79,253 79,628<br />
population 1 ……………………. 102,145 103,555 103,847 103,973 104,087 104,197 103,866 103,961 104,052 104,152 104,258 104,371 104,490 104,613 104,741<br />
Civilian labor force.............. 77,562 78,596 78,689 78,664 79,075 79,004 78,864 78,748 78,838 78,776 78,878 79,037 79,327 79,318 79,444<br />
Participation rate........... 75.9 75.9 75.8 75.7 76.0 75.8 75.9 75.7 75.8 75.6 75.7 75.7 75.9 75.8 75.8<br />
Employed........................<br />
Employment-pop-<br />
74,431 75,337 75,332 75,274 75,834 75,499 75,427 75,362 75,197 75,148 75,001 74,998 75,094 74,866 74,631<br />
ulation ratio 2 Employment status<br />
…………… 72.9 72.8 72.5 72.4 72.9 72.5 72.6 72.5 72.3 72.2 71.9 71.9 71.9 71.6 71.3<br />
Unemployed................... 3,131 3,259 3,357 3,389 3,240 3,505 3,437 3,386 3,641 3,628 3,877 4,038 4,234 4,452 4,813<br />
Unemployment rate..... 4.0 4.1 4.3 4.3 4.1 4.4 4.4 4.3 4.6 4.6 4.9 5.1 5.3 5.6 6.1<br />
Not in the labor force……… 24,584 24,959 25,158 25,309 25,012 25,193 25,002 25,213 25,214 25,376 25,380 25,334 25,163 25,295 25,298<br />
Women, 20 years and over<br />
��������������������������<br />
population 1 ……………………. 109,992 111,330 111,590 111,703 111,805 111,903 111,739 111,822 111,902 111,990 112,083 112,183 112,290 112,<strong>401</strong> 112,518<br />
Civilian labor force.............. 66,585 67,516 67,795 67,623 67,776 67,866 67,982 67,816 68,159 68,176 68,390 68,446 68,303 68,672 68,423<br />
Participation rate........... 60.5 60.6 60.8 60.5 60.6 60.6 60.8 60.6 60.9 60.9 61.0 61.0 60.8 61.1 60.8<br />
Employed........................<br />
Employment-pop-<br />
63,834 64,799 65,033 64,827 64,980 64,912 65,098 64,950 65,055 65,260 65,138 65,238 65,167 65,047 65,072<br />
ulation ratio 2 …………… 58.0 58.2 58.3 58.0 58.1 58.0 58.3 58.1 58.1 58.3 58.1 58.2 58.0 57.9 57.8<br />
Unemployed................... 2,751 2,718 2,762 2,796 2,796 2,954 2,885 2,865 3,104 2,916 3,252 3,208 3,135 3,625 3,351<br />
Unemployment rate..... 4.1 4.0 4.1 4.1 4.1 4.4 4.2 4.2 4.6 4.3 4.8 4.7 4.6 5.3 4.9<br />
Not in the labor force……… 43,407 43,814 43,795 44,080 44,029 44,037 43,756 44,006 43,743 43,814 43,693 43,737 43,988 43,729 44,094<br />
Both sexes, 16 to 19 years<br />
��������������������������<br />
population 1 ……………………. 16,678 16,982 17,024 17,040 17,048 17,056 17,012 17,027 17,041 17,056 17,064 17,073 17,084 17,092 17,101<br />
Civilian labor force.............. 7,281 7,012 7,021 7,020 6,977 6,996 6,978 6,810 6,787 7,005 7,266 6,907 6,973 6,863 6,865<br />
Participation rate........... 43.7 41.3 41.2 41.2 40.9 41.0 41.0 40.0 39.8 41.1 42.6 40.5 40.8 40.2 40.1<br />
Employed........................<br />
Employment-pop-<br />
6,162 5,911 5,895 5,914 5,832 5,801 5,724 5,681 5,717 5,923 5,907 5,655 5,558 5,563 5,552<br />
ulation ratio 2 …………… 36.9 34.8 34.6 34.7 34.2 34.0 33.6 33.4 33.5 34.7 34.6 33.1 32.5 32.6 32.5<br />
Unemployed................... 1,119 1,101 1,126 1,105 1,145 1,196 1,254 1,130 1,070 1,082 1,358 1,253 1,415 1,299 1,313<br />
Unemployment rate..... 15.4 15.7 16.0 15.7 16.4 17.1 18.0 16.6 15.8 15.4 18.7 18.1 20.3 18.9 19.1<br />
Not in the labor force……… 9,397 9,970 10,003 10,020 10,071 10,059 10,034 10,216 10,254 10,051 9,798 10,166 10,110 10,229 10,236<br />
White 3<br />
��������������������������<br />
population 1 ……………………. 186,264 188,253 188,644 188,813 188,956 189,093 188,787 188,906 189,019 189,147 189,281 189,428 189,587 189,747 189,916<br />
Civilian labor force.............. 123,834 124,935 125,316 125,151 125,430 125,460 125,340 124,940 125,190 125,171 125,762 125,704 125,971 125,981 125,955<br />
Participation rate........... 66.5 66.4 66.4 66.3 66.4 66.3 66.4 66.1 66.2 66.2 66.4 66.4 66.4 66.4 66.3<br />
Employed........................ 118,833<br />
Employment-pop-<br />
119,792 119,992 119,883 120,194 119,889 119,858 119,534 119,574 119,667 119,661 119,518 119,542 119,222 119,180<br />
ulation ratio 2 …………… 63.8 63.6 63.6 63.5 63.6 63.4 63.5 63.3 63.3 63.3 63.2 63.1 63.1 62.8 62.8<br />
Unemployed................... 5,002 5,143 5,324 5,268 5,235 5,571 5,482 5,406 5,616 5,504 6,101 6,186 6,428 6,760 6,775<br />
Unemployment rate..... 4.0 4.1 4.2 4.2 4.2 4.4 4.4 4.3 4.5 4.4 4.9 4.9 5.1 5.4 5.4<br />
Not in the labor force……… 62,429 63,319 63,329 63,662 63,526 63,633 63,447 63,966 63,829 63,975 63,519 63,724 63,616 63,766 63,961<br />
Black or African American 3<br />
��������������������������<br />
population 1 ……………………. 27,007 27,485 27,584 27,627 27,666 27,704 27,640 27,675 27,709 27,746 27,780 27,816 27,854 27,896 27,939<br />
Civilian labor force.............. 17,314 17,496 17,483 17,430 17,453 17,538 17,713 17,632 17,702 17,753 17,742 17,716 17,767 17,973 17,737<br />
Participation rate........... 64.1 63.7 63.4 63.1 63.1 63.3 64.1 63.7 63.9 64.0 63.9 63.7 63.8 64.4 63.5<br />
Employed........................<br />
Employment-pop-<br />
15,765 16,051 16,046 15,946 15,980 15,961 16,090 16,169 16,116 16,234 16,029 16,085 16,040 16,074 15,714<br />
ulation ratio 2 …………… 58.4 58.4 58.2 57.7 57.8 57.6 58.2 58.4 58.2 58.5 57.7 57.8 57.6 57.6 56.2<br />
Unemployed................... 1,549 1,445 1,437 1,483 1,473 1,577 1,623 1,463 1,586 1,520 1,713 1,632 1,726 1,899 2,023<br />
Unemployment rate..... 8.9 8.3 8.2 8.5 8.4 9.0 9.2 8.3 9.0 8.6 9.7 9.2 9.7 10.6 11.4<br />
Not in the labor force………<br />
������������������������������<br />
9,693 9,989 10,101 10,197 10,212 10,165 9,927 10,043 10,007 9,992 10,038 10,100 10,088 9,923 10,202<br />
78 Monthly Labor Review • November 2008
����������������������������������������������������������������������������������������������������������������������������<br />
[Numbers in thousands]<br />
Employment status<br />
Annual average 2007 2008<br />
2006 2007 Sept. Oct. Nov. Dec. Jan. Feb. Mar. Apr. May June July Aug. Sept.<br />
������������������<br />
���������<br />
Civilian noninstitutional<br />
population 1 ……………………. 30,103 31,383 31,617 31,714 31,809 31,903 31,643 31,732 31,820 31,911 31,998 32,087 32,179 32,273 32,369<br />
Civilian labor force.............. 20,694 21,602 21,872 21,778 21,872 21,888 21,698 21,755 21,775 21,917 22,102 22,131 22,071 22,226 22,258<br />
Participation rate........... 68.7 68.8 69.2 68.7 68.8 68.6 68.6 68.6 68.4 68.7 69.1 69.0 68.6 68.9 68.8<br />
Employed........................<br />
Employment-pop-<br />
19,613 20,382 20,619 20,554 20,623 20,517 20,320 20,<strong>401</strong> 20,269 20,404 20,573 20,420 20,435 20,452 20,531<br />
ulation ratio 2 …………… 65.2 64.9 65.2 64.8 64.8 64.3 64.2 64.3 63.7 63.9 64.3 63.6 63.5 63.4 63.4<br />
Unemployed................... 1,081 1,220 1,253 1,224 1,249 1,371 1,378 1,354 1,507 1,512 1,529 1,711 1,636 1,774 1,727<br />
Unemployment rate..... 5.2 5.6 5.7 5.6 5.7 6.3 6.3 6.2 6.9 6.9 6.9 7.7 7.4 8.0 7.8<br />
Not in the labor force………… 9,409 9,781 9,745 9,936 9,938 10,016 9,946 9,977 10,045 9,994 9,896 9,956 10,108 10,048 10,111<br />
1 <strong>The</strong> population figures are not se<strong>as</strong>onally adjusted.<br />
2 Civilian employment <strong>as</strong> a percent <strong>of</strong> the civilian noninstitutional population.<br />
3 Beginning in 2003, persons who selected this race group only; persons who<br />
selected more than one race group are not included. Prior to 2003, persons who<br />
reported more than one race were included in the group they identified <strong>as</strong> the main<br />
race.<br />
NOTE: Estimates for the above race groups (white and black or African American) do not<br />
sum to totals because data are not presented for all races. In addition, persons whose<br />
ethnicity is identified <strong>as</strong> Hispanic or Latino may be <strong>of</strong> any race and, therefore, are cl<strong>as</strong>sified<br />
by ethnicity <strong>as</strong> well <strong>as</strong> by race. Beginning in January 2003, data reflect revised population<br />
controls used in the household survey.<br />
���������������������������������������������������������������������<br />
[In thousands]<br />
Characteristic<br />
2006 2007 Sept.<br />
2007<br />
Oct. Nov. Dec. Jan. Feb. Mar. Apr.<br />
2008<br />
May June July Aug. Sept.<br />
Employed, 16 years and older.. 144,427 146,047 146,260 146,016 146,647 146,211 146,248 145,993 145,969 146,331 146,046 145,891 145,819 145,477 145,255<br />
Men....................................... 77,502 78,254 78,229 78,177 78,604 78,260 78,157 78,113 77,948 78,038 77,954 77,794 77,823 77,632 77,396<br />
Women............................……<br />
Married men, spouse<br />
66,925 67,792 68,030 67,838 68,043 67,951 68,091 67,880 68,021 68,293 68,092 68,097 67,996 67,845 67,860<br />
present................................<br />
Married women, spouse<br />
45,700 46,314 46,235 46,189 46,339 46,213 46,063 46,136 45,961 45,964 45,862 45,911 46,120 45,829 45,958<br />
present................................<br />
Persons at work part time<br />
35,272 35,832 35,712 35,449 35,689 35,565 35,536 35,648 35,749 36,177 36,171 36,270 36,185 36,055 35,913<br />
1<br />
Selected categories<br />
Annual average<br />
All industries:<br />
Part time for economic<br />
re<strong>as</strong>ons…………………….…<br />
Slack work or business<br />
4,162 4,<strong>401</strong> 4,499 4,<strong>401</strong> 4,513 4,665 4,769 4,884 4,914 5,220 5,233 5,416 5,724 5,718 6,055<br />
conditions………….........<br />
Could only find part-time<br />
2,658 2,877 2,991 2,788 3,008 3,174 3,247 3,291 3,323 3,558 3,595 3,816 4,194 4,112 4,232<br />
work………………………<br />
Part time for noneconomic<br />
1,189 1,210 1,166 1,215 1,223 1,236 1,163 1,222 1,362 1,323 1,281 1,336 1,286 1,362 1,516<br />
re<strong>as</strong>ons………………………<br />
Nonagricultural industries:<br />
Part time for economic<br />
19,591 19,756 19,812 19,337 19,539 19,526 19,613 19,348 19,409 19,809 19,428 19,496 19,406 19,712 19,371<br />
re<strong>as</strong>ons…………………….…<br />
Slack work or business<br />
4,071 4,317 4,397 4,302 4,453 4,577 4,677 4,790 4,797 5,125 5,164 5,308 5,599 5,641 5,941<br />
conditions........................<br />
Could only find part-time<br />
2,596 2,827 2,922 2,745 2,981 3,120 3,174 3,231 3,238 3,513 3,531 3,744 4,156 4,032 4,121<br />
work………………………<br />
Part time for noneconomic<br />
1,178 1,199 1,153 1,207 1,205 1,219 1,149 1,216 1,354 1,331 1,288 1,328 1,277 1,350 1,537<br />
re<strong>as</strong>ons.................………… 19,237 19,419 19,451 19,157 19,224 19,225 19,296 19,019 19,072 19,456 19,047 19,106 19,051 19,281 19,033<br />
1<br />
Excludes persons "with a job but not at work" during the survey period for such re<strong>as</strong>ons <strong>as</strong> vacation, illness, or industrial disputes.<br />
NOTE: Beginning in January 2003, data reflect revised population controls used in the household survey.<br />
Monthly Labor Review • November 2008 79
Current Labor Statistics: Labor Force Data<br />
�����������������������������������������������������������������������<br />
[Unemployment rates]<br />
Selected categories<br />
Characteristic<br />
Total, 16 years and older............................ 4.6<br />
Both sexes, 16 to 19 years..................... 15.4<br />
Men, 20 years and older......................... 4.0<br />
Women, 20 years and older................... 4.1<br />
White, total 1 ……………………………… 4.0<br />
Both sexes, 16 to 19 years................ 13.2<br />
Men, 16 to 19 years........................ 14.6<br />
Women, 16 to 19 years.................. 11.7<br />
Men, 20 years and older.................... 3.5<br />
Women, 20 years and older.............. 3.6<br />
Black or African American, total 1 ……… 8.9<br />
Both sexes, 16 to 19 years................ 29.1<br />
Men, 16 to 19 years........................ 32.7<br />
Women, 16 to 19 years.................. 25.9<br />
Men, 20 years and older.................... 8.3<br />
Women, 20 years and older.............. 7.5<br />
Hispanic or Latino ethnicity……………… 5.2<br />
Married men, spouse present................ 2.4<br />
Married women, spouse present........... 2.9<br />
Full-time workers................................... 4.5<br />
Part-time workers..................................<br />
Educational attainment<br />
5.1<br />
2<br />
Less than a high school diploma................ 6.8<br />
High school graduates, no college 3 ……… 4.3<br />
Some college or <strong>as</strong>sociate degree……….. 3.6<br />
Bachelor's degree and higher 4 ……………. 2.0<br />
80 Monthly Labor Review • November 2008<br />
Annual average<br />
2007 2008<br />
2006 2007 Sept. Oct. Nov. Dec. Jan. Feb. Mar. Apr. May June July Aug. Sept.<br />
4.6<br />
15.7<br />
4.1<br />
4.0<br />
4.1<br />
13.9<br />
15.7<br />
12.1<br />
3.7<br />
3.6<br />
8.3<br />
29.4<br />
33.8<br />
25.3<br />
7.9<br />
6.7<br />
5.6<br />
2.5<br />
2.8<br />
4.6<br />
4.9<br />
7.1<br />
4.4<br />
3.6<br />
4.7<br />
16.0<br />
4.3<br />
4.1<br />
4.2<br />
14.3<br />
16.4<br />
12.2<br />
3.9<br />
3.5<br />
8.2<br />
28.9<br />
33.9<br />
24.2<br />
7.5<br />
7.1<br />
5.7<br />
2.5<br />
2.9<br />
4.7<br />
4.7<br />
7.5<br />
4.6<br />
3.4<br />
4.8<br />
15.7<br />
4.3<br />
4.1<br />
4.2<br />
14.0<br />
15.9<br />
12.0<br />
3.8<br />
3.6<br />
8.5<br />
27.9<br />
36.0<br />
20.1<br />
8.2<br />
7.1<br />
5.6<br />
2.6<br />
2.9<br />
4.7<br />
5.0<br />
7.4<br />
4.6<br />
3.5<br />
1<br />
Beginning in 2003, persons who selected this race group only; persons who<br />
selected more than one race group are not included. Prior to 2003, persons who<br />
reported more than one race were included in the group they identified <strong>as</strong> the main<br />
race.<br />
2<br />
Data refer to persons 25 years and older.<br />
2.0<br />
2.0<br />
2.1<br />
4.7<br />
16.4<br />
4.1<br />
4.1<br />
4.2<br />
14.7<br />
17.8<br />
11.8<br />
3.7<br />
3.7<br />
8.4<br />
29.7<br />
34.6<br />
24.9<br />
7.9<br />
7.0<br />
5.7<br />
2.6<br />
3.0<br />
4.6<br />
5.0<br />
7.6<br />
4.5<br />
3.3<br />
2.2<br />
���������������������������������������������������������������<br />
[Numbers in thousands]<br />
Weeks <strong>of</strong> Annual average<br />
2007 2008<br />
unemployment 2006 2007 Sept. Oct. Nov. Dec. Jan. Feb. Mar. Apr. May June July Aug. Sept.<br />
Less than 5 weeks........................... 2,614 2,542 2,537 2,508 2,633 2,793 2,634 2,639 2,767 2,484 3,244 2,712 2,835 3,235 2,853<br />
5 to 14 weeks.................................. 2,121 2,232 2,330 2,454 2,157 2,330 2,396 2,396 2,525 2,495 2,469 2,999 2,823 2,821 3,051<br />
15 weeks and over.......................... 2,266 2,303 2,392 2,367 2,398 2,520 2,503 2,377 2,400 2,626 2,773 2,916 3,118 3,402 3,607<br />
15 to 26 weeks............................. 1,031 1,061 1,112 1,052 1,014 1,182 1,124 1,079 1,118 1,272 1,223 1,328 1,440 1,561 1,598<br />
27 weeks and over....................... 1,235 1,243 1,280 1,315 1,384 1,338 1,380 1,299 1,282 1,353 1,550 1,587 1,678 1,841 2,008<br />
Mean duration, in weeks................... 16.8 16.8 16.6 17.0 17.2 16.6 17.5 16.8 16.2 16.9 16.6 17.5 17.1 17.4 18.4<br />
Median duration, in weeks............... 8.3 8.5 8.9 8.7 8.7 8.4 8.8 8.4 8.1 9.3 8.3 10.0 9.7 9.2 10.2<br />
NOTE: Beginning in January 2003, data reflect revised population controls used in the household survey.<br />
5.0<br />
17.1<br />
4.4<br />
4.4<br />
4.4<br />
14.4<br />
16.8<br />
12.1<br />
3.9<br />
4.0<br />
9.0<br />
34.7<br />
39.5<br />
30.1<br />
8.4<br />
7.0<br />
6.3<br />
2.7<br />
3.1<br />
4.9<br />
5.6<br />
7.6<br />
4.7<br />
3.7<br />
2.2<br />
4.9<br />
18.0<br />
4.4<br />
4.2<br />
4.4<br />
15.6<br />
19.0<br />
12.3<br />
3.9<br />
3.8<br />
9.2<br />
35.7<br />
41.3<br />
28.5<br />
8.3<br />
7.3<br />
6.3<br />
2.7<br />
3.1<br />
4.8<br />
5.4<br />
7.7<br />
4.6<br />
3.6<br />
2.1<br />
4.8<br />
16.6<br />
4.3<br />
4.2<br />
4.3<br />
14.4<br />
17.1<br />
11.8<br />
3.9<br />
3.8<br />
8.3<br />
31.7<br />
32.6<br />
30.9<br />
7.9<br />
6.5<br />
6.2<br />
2.7<br />
3.1<br />
4.8<br />
5.0<br />
7.3<br />
4.7<br />
3.7<br />
2.1<br />
5.1<br />
15.8<br />
4.6<br />
4.6<br />
4.5<br />
13.2<br />
14.7<br />
11.7<br />
4.1<br />
4.1<br />
9.0<br />
31.3<br />
38.9<br />
25.4<br />
8.4<br />
7.5<br />
6.9<br />
2.8<br />
3.3<br />
5.0<br />
5.3<br />
8.2<br />
5.1<br />
3.8<br />
2.1<br />
5.0<br />
15.4<br />
4.6<br />
4.3<br />
4.4<br />
13.8<br />
15.2<br />
12.4<br />
4.1<br />
3.7<br />
8.6<br />
24.5<br />
27.9<br />
21.9<br />
8.4<br />
7.4<br />
6.9<br />
2.8<br />
3.0<br />
5.0<br />
4.9<br />
7.8<br />
5.0<br />
3.9<br />
2.1<br />
5.5<br />
18.7<br />
4.9<br />
4.8<br />
4.9<br />
16.4<br />
17.7<br />
14.9<br />
4.4<br />
4.1<br />
9.7<br />
32.3<br />
40.1<br />
25.2<br />
8.9<br />
8.2<br />
6.9<br />
2.9<br />
3.1<br />
5.5<br />
5.5<br />
8.3<br />
5.2<br />
4.3<br />
2.2<br />
5.5<br />
18.1<br />
5.1<br />
4.7<br />
4.9<br />
16.6<br />
17.8<br />
15.3<br />
4.5<br />
4.2<br />
9.2<br />
29.6<br />
35.5<br />
23.9<br />
9.3<br />
7.4<br />
7.7<br />
3.0<br />
3.3<br />
5.5<br />
5.4<br />
8.7<br />
5.1<br />
4.2<br />
2.3<br />
5.7<br />
20.3<br />
5.3<br />
4.6<br />
5.1<br />
19.0<br />
22.2<br />
15.6<br />
4.7<br />
4.1<br />
9.7<br />
32.0<br />
38.0<br />
26.5<br />
10.0<br />
7.5<br />
7.4<br />
3.2<br />
3.3<br />
5.7<br />
5.5<br />
8.5<br />
5.2<br />
4.5<br />
2.4<br />
6.1<br />
18.9<br />
5.6<br />
5.3<br />
5.4<br />
17.2<br />
19.2<br />
15.0<br />
4.9<br />
4.7<br />
10.6<br />
28.8<br />
29.2<br />
28.3<br />
10.3<br />
9.1<br />
8.0<br />
3.5<br />
3.7<br />
6.2<br />
5.7<br />
9.6<br />
5.7<br />
4.8<br />
2.7<br />
6.1<br />
19.1<br />
6.1<br />
4.9<br />
5.4<br />
17.4<br />
19.4<br />
15.2<br />
5.3<br />
4.2<br />
11.4<br />
29.4<br />
32.6<br />
26.3<br />
11.9<br />
9.3<br />
7.8<br />
3.8<br />
3.5<br />
6.2<br />
5.9<br />
9.6<br />
6.3<br />
5.0<br />
2.5
������������������������������������������������������������������������������������<br />
[Numbers in thousands]<br />
Re<strong>as</strong>on for Annual average<br />
2007 2008<br />
unemployment 2006 2007 Sept. Oct. Nov. Dec. Jan. Feb. Mar. Apr. May June July Aug. Sept.<br />
Job losers 1 …………………….… 3,321 3,515 3,622 3,731 3,609 3,857 3,796 3,854 4,154 4,014 4,282 4,370 4,407 4,824 5,171<br />
On temporary lay<strong>of</strong>f.............. 921 976 963 1,064 979 975 1,040 971 1,056 1,099 1,113 1,077 1,037 1,266 1,407<br />
Not on temporary lay<strong>of</strong>f........ 2,400 2,539 2,660 2,668 2,630 2,882 2,756 2,883 3,098 2,915 3,169 3,292 3,370 3,559 3,764<br />
Job leavers.............................. 827 793 839 790 783 798 830 769 781 850 870 833 861 999 974<br />
Reentrants............................... 2,237 2,142 2,154 2,103 2,160 2,343 2,201 2,112 2,117 2,134 2,460 2,498 2,705 2,652 2,555<br />
New entrants...........................<br />
Percent <strong>of</strong> unemployed<br />
616 627 685 709 669 697 667 648 681 624 828 748 811 820 822<br />
Job losers 1 …………………….… 47.4 49.7 49.6 50.9 50.0 50.1 50.7 52.2 53.7 52.7 50.7 51.7 50.2 51.9 54.3<br />
On temporary lay<strong>of</strong>f............... 13.2 13.8 13.2 14.5 13.6 12.7 13.9 13.2 13.7 14.4 13.2 12.7 11.8 13.6 14.8<br />
Not on temporary lay<strong>of</strong>f......... 34.3 35.9 36.4 36.4 36.4 37.5 36.8 39.0 40.1 38.2 37.5 39.0 38.4 38.3 39.5<br />
Job leavers............................... 11.8 11.2 11.5 10.8 10.8 10.4 11.1 10.4 10.1 11.2 10.3 9.9 9.8 10.7 10.2<br />
Reentrants................................ 32.0 30.3 29.5 28.7 29.9 30.4 29.4 28.6 27.4 28.0 29.1 29.6 30.8 28.5 26.8<br />
New entrants............................<br />
Percent <strong>of</strong> civilian<br />
labor force<br />
8.8 8.9 9.4 9.7 9.3 9.1 8.9 8.8 8.8 8.2 9.8 8.9 9.2 8.8 8.6<br />
Job losers 1 …………………….… 2.2 2.3 2.4 2.4 2.3 2.5 2.5 2.5 2.7 2.6 2.8 2.8 2.9 3.1 3.3<br />
Job leavers............................... .5 .5 .5 .5 .5 .5 .5 .5 .5 .6 .6 .5 .6 .6 .6<br />
Reentrants................................ 1.5 1.4 1.4 1.4 1.4 1.5 1.4 1.4 1.4 1.4 1.6 1.6 1.7 1.7 1.7<br />
New entrants............................ .4 .4 .4 .5 .4 .5 .4 .4 .4 .4 .5 .5 .5 .5 .5<br />
1<br />
Includes persons who completed temporary jobs.<br />
NOTE: Beginning in January 2003, data reflect revised population controls used in the household survey.<br />
������������������������������������������������������������������������<br />
[Civilian workers]<br />
Sex and age<br />
Total, 16 years and older.................. 4.6<br />
16 to 24 years............................... 10.5<br />
16 to 19 years............................ 15.4<br />
16 to 17 years......................... 17.2<br />
18 to 19 years......................... 14.1<br />
20 to 24 years............................ 8.2<br />
25 years and older........................ 3.6<br />
25 to 54 years......................... 3.8<br />
55 years and older.................. 3.0<br />
Men, 16 years and older................. 4.6<br />
16 to 24 years............................. 11.2<br />
16 to 19 years.......................... 16.9<br />
16 to 17 years....................... 18.6<br />
18 to 19 years....................... 15.7<br />
20 to 24 years.......................... 8.7<br />
25 years and older...................... 3.5<br />
25 to 54 years....................... 3.6<br />
55 years and older................ 3.0<br />
Women, 16 years and older........... 4.6<br />
16 to 24 years............................. 9.7<br />
16 to 19 years.......................... 13.8<br />
16 to 17 years………………… 15.9<br />
18 t0 19 years………………… 12.4<br />
20 to 24 years.......................... 7.6<br />
25 years and older...................... 3.7<br />
25 to 54 years....................... 3.9<br />
55 years and older 1 ………… 2.9<br />
1 Data are not se<strong>as</strong>onally adjusted.<br />
Annual average<br />
2007 2008<br />
2006 2007 Sept. Oct. Nov. Dec. Jan. Feb. Mar. Apr. May June July Aug. Sept.<br />
4.6<br />
10.5<br />
15.7<br />
17.5<br />
14.5<br />
8.2<br />
3.6<br />
3.7<br />
3.1<br />
4.7<br />
11.6<br />
17.6<br />
19.4<br />
16.5<br />
8.9<br />
3.6<br />
3.7<br />
3.2<br />
4.5<br />
9.4<br />
13.8<br />
15.7<br />
12.5<br />
7.3<br />
3.6<br />
3.8<br />
3.0<br />
4.7<br />
11.0<br />
16.0<br />
18.6<br />
14.3<br />
8.8<br />
3.7<br />
3.8<br />
3.1<br />
4.9<br />
12.2<br />
18.3<br />
21.9<br />
16.2<br />
9.5<br />
3.7<br />
3.8<br />
3.3<br />
4.5<br />
9.8<br />
13.7<br />
15.6<br />
12.3<br />
7.9<br />
3.7<br />
3.8<br />
4.8<br />
10.8<br />
15.7<br />
17.5<br />
14.3<br />
8.6<br />
3.7<br />
3.8<br />
3.1<br />
4.9<br />
12.0<br />
18.1<br />
19.0<br />
16.8<br />
9.3<br />
3.7<br />
3.8<br />
3.1<br />
4.6<br />
9.6<br />
13.3<br />
16.1<br />
11.6<br />
7.7<br />
3.7<br />
3.9<br />
4.7<br />
10.7<br />
16.4<br />
19.0<br />
14.4<br />
8.0<br />
3.7<br />
3.8<br />
3.0<br />
4.7<br />
11.8<br />
19.5<br />
21.4<br />
17.8<br />
8.6<br />
3.6<br />
3.7<br />
3.1<br />
4.6<br />
9.4<br />
13.4<br />
17.1<br />
10.7<br />
7.4<br />
3.8<br />
4.0<br />
5.0<br />
11.8<br />
17.1<br />
19.6<br />
15.4<br />
9.4<br />
3.9<br />
4.1<br />
3.2<br />
5.1<br />
12.8<br />
19.8<br />
22.1<br />
18.4<br />
9.8<br />
3.8<br />
4.0<br />
3.2<br />
4.9<br />
10.7<br />
14.4<br />
17.3<br />
12.3<br />
8.8<br />
3.9<br />
4.1<br />
4.9<br />
11.7<br />
18.0<br />
20.4<br />
15.9<br />
8.7<br />
3.8<br />
3.9<br />
3.2<br />
5.1<br />
13.1<br />
21.8<br />
24.0<br />
19.5<br />
9.4<br />
3.8<br />
4.0<br />
3.2<br />
4.7<br />
10.1<br />
14.2<br />
17.2<br />
12.1<br />
8.0<br />
3.8<br />
3.9<br />
NOTE: Beginning in January 2003, data reflect revised population controls used in the household survey.<br />
3.0<br />
3.0<br />
2.8<br />
2.9<br />
3.4<br />
4.8<br />
11.3<br />
16.6<br />
18.3<br />
15.5<br />
8.9<br />
3.8<br />
3.9<br />
3.2<br />
4.9<br />
12.5<br />
18.7<br />
20.5<br />
18.0<br />
9.9<br />
3.7<br />
3.8<br />
3.2<br />
4.7<br />
9.9<br />
14.5<br />
16.2<br />
12.8<br />
7.7<br />
3.8<br />
4.0<br />
3.3<br />
5.1<br />
11.3<br />
15.8<br />
18.6<br />
14.0<br />
9.3<br />
4.0<br />
4.2<br />
3.4<br />
5.2<br />
12.5<br />
17.8<br />
22.0<br />
15.2<br />
10.3<br />
4.0<br />
4.1<br />
3.3<br />
5.0<br />
10.0<br />
13.8<br />
15.5<br />
12.8<br />
8.1<br />
4.1<br />
4.2<br />
3.4<br />
5.0<br />
11.0<br />
15.4<br />
19.7<br />
13.2<br />
8.9<br />
3.9<br />
4.2<br />
3.0<br />
5.1<br />
12.0<br />
16.9<br />
22.2<br />
14.5<br />
9.9<br />
4.0<br />
4.3<br />
3.0<br />
4.8<br />
9.8<br />
14.0<br />
17.5<br />
11.8<br />
7.7<br />
3.9<br />
4.0<br />
2.8<br />
5.5<br />
13.0<br />
18.7<br />
21.2<br />
17.5<br />
10.4<br />
4.1<br />
4.4<br />
3.3<br />
5.6<br />
14.1<br />
20.7<br />
23.3<br />
19.6<br />
11.0<br />
4.2<br />
4.4<br />
3.4<br />
5.3<br />
11.9<br />
16.6<br />
19.0<br />
15.2<br />
9.6<br />
4.1<br />
4.4<br />
2.8<br />
5.5<br />
12.6<br />
18.1<br />
23.3<br />
15.6<br />
10.1<br />
4.3<br />
4.5<br />
3.3<br />
5.7<br />
13.8<br />
19.9<br />
26.2<br />
17.1<br />
11.2<br />
4.3<br />
4.6<br />
3.4<br />
5.2<br />
11.2<br />
16.3<br />
20.3<br />
13.9<br />
8.8<br />
4.2<br />
4.4<br />
3.4<br />
5.7<br />
13.4<br />
20.3<br />
24.9<br />
17.3<br />
10.2<br />
4.4<br />
4.6<br />
3.6<br />
6.1<br />
15.2<br />
23.4<br />
29.4<br />
19.9<br />
11.6<br />
4.6<br />
4.9<br />
3.7<br />
5.2<br />
11.4<br />
17.1<br />
20.4<br />
14.6<br />
8.7<br />
4.2<br />
4.3<br />
4.3<br />
6.1<br />
13.1<br />
18.9<br />
22.1<br />
17.1<br />
10.5<br />
4.9<br />
5.1<br />
4.1<br />
6.3<br />
14.3<br />
20.7<br />
24.0<br />
18.6<br />
11.5<br />
5.0<br />
5.2<br />
4.2<br />
5.8<br />
11.9<br />
17.1<br />
20.2<br />
15.6<br />
9.4<br />
4.8<br />
5.0<br />
4.5<br />
6.1<br />
13.2<br />
19.1<br />
21.6<br />
17.6<br />
10.5<br />
5.0<br />
5.2<br />
4.1<br />
6.7<br />
14.4<br />
21.0<br />
23.0<br />
20.1<br />
11.5<br />
5.5<br />
5.8<br />
4.4<br />
5.5<br />
11.9<br />
17.1<br />
20.3<br />
14.8<br />
9.4<br />
4.4<br />
4.6<br />
3.9<br />
Monthly Labor Review • November 2008 81
Current Labor Statistics: Labor Force Data<br />
10. Unemployment rates by State, se<strong>as</strong>onally adjusted<br />
State<br />
Aug.<br />
2007<br />
July<br />
2008 p<br />
Aug.<br />
82 Monthly Labor Review • November 2008<br />
2008 p<br />
Alabama............................………………… 3.6 5.1 4.9 Missouri……………………………………… 5.2 6.4 6.7<br />
Al<strong>as</strong>ka........................................................ 6.3 6.8 6.9 Montana..................................................... 3.1 4.0 4.4<br />
Arizona............................…………………… 3.7 5.1 5.6 Nebr<strong>as</strong>ka............................………………… 3.1 3.4 3.5<br />
Arkans<strong>as</strong>.................................................... 5.5 4.5 4.8 Nevada...................................................... 4.9 6.6 7.1<br />
California............................………………… 5.5 7.4 7.7 New Hampshire............................………… 3.4 3.9 4.2<br />
Colorado.................................................... 3.8 5.2 5.4 New Jersey................................................ 4.2 5.4 5.9<br />
Connecticut............................……………… 4.6 5.8 6.5 New Mexico............................……………… 3.4 4.1 4.6<br />
Delaware................................................... 3.2 4.4 4.8 New York................................................... 4.6 5.2 5.8<br />
District <strong>of</strong> Columbia............................…… 5.7 6.7 6.9 North Carolina............................…………… 4.7 6.6 6.9<br />
Florida........................................................ 4.2 6.2 6.6 North Dakota............................................. 3.2 3.5 3.6<br />
Georgia............................………………… 4.4 6.0 6.3 Ohio............................……………………… 5.7 7.2 7.4<br />
Hawaii........................................................ 2.7 3.9 4.2 Oklahoma.................................................. 4.3 4.1 4.0<br />
Idaho............................……………………… 2.7 4.1 4.6 Oregon............................…………………… 5.3 5.9 6.5<br />
Illinois......................................................... 5.2 7.2 7.3 Pennsylvania............................................. 4.4 5.4 5.8<br />
Indiana............................…………………… 4.5 6.3 6.4 Rhode Island............................…………… 5.1 7.8 8.6<br />
Iowa............................……………………… 3.8 4.3 4.5 South Carolina............................………… 5.8 7.0 7.6<br />
Kans<strong>as</strong>....................................................... 4.0 4.6 4.7 South Dakota............................................. 2.9 3.0 3.3<br />
Kentucky............................………………… 5.5 6.7 6.8 Tennessee............................……………… 4.7 6.8 6.6<br />
Louisiana................................................... 3.7 4.0 4.7 Tex<strong>as</strong>......................................................... 4.3 4.7 5.0<br />
Maine............................…………………… 4.8 5.5 5.5 Utah............................……………………… 2.8 3.5 3.7<br />
Maryland............................………………… 3.6 4.3 4.5 Vermont............................………………… 3.8 4.8 4.9<br />
M<strong>as</strong>sachusetts........................................... 4.4 5.0 5.2 Virginia....................................................... 3.1 4.4 4.6<br />
Michigan............................………………… 7.2 8.5 8.9 W<strong>as</strong>hington............................……………… 4.5 5.6 6.0<br />
Minnesota.................................................. 4.5 5.8 6.2 West Virginia............................................. 4.7 4.5 4.1<br />
Mississippi............................……………… 6.2 8.0 7.7 Wisconsin............................……………… 4.9 4.9 5.1<br />
�<br />
��������������<br />
Wyoming.................................................... 3.0 3.6 3.9<br />
State<br />
�����������������������������������������������������������������������������<br />
State<br />
Aug.<br />
2007<br />
July<br />
2008 p<br />
Aug.<br />
State<br />
2008 p<br />
Alabama............................………… 2,186,926 2,177,385 2,175,153 Missouri……………………………… 3,037,016 3,016,849 3,007,649<br />
Al<strong>as</strong>ka............................................. 352,895 359,214 360,853 Montana......................................... 503,554 504,578 505,394<br />
Arizona............................…………… 3,035,883 3,087,175 3,100,259 Nebr<strong>as</strong>ka............................………… 986,432 992,237 996,253<br />
Arkans<strong>as</strong>........................................ 1,367,662 1,373,504 1,373,423 Nevada........................................... 1,341,006 1,400,119 1,404,471<br />
California............................………… 18,237,052 18,409,115 18,415,159 New Hampshire............................… 738,313 743,207 743,999<br />
Colorado......................................... 2,715,441 2,763,603 2,744,961 New Jersey..................................... 4,461,960 4,505,589 4,525,498<br />
Connecticut............................……… 1,869,843 1,889,884 1,890,442 New Mexico............................…… 944,241 953,175 957,929<br />
Delaware........................................ 442,216 446,601 447,046 New York........................................ 9,532,181 9,566,604 9,587,734<br />
District <strong>of</strong> Columbia........................ 325,009 330,018 332,388 North Carolina............................… 4,521,597 4,603,062 4,568,570<br />
Florida............................................ 9,158,734 9,341,459 9,326,000 North Dakota.................................. 366,096 372,658 372,342<br />
Georgia............................………… 4,824,440 4,928,333 4,910,138 Ohio............................……………… 5,979,682 5,989,521 5,994,695<br />
Hawaii............................................. 646,184 664,561 664,199 Oklahoma....................................... 1,733,151 1,736,679 1,745,138<br />
Idaho............................…………… 756,842 753,099 754,766 Oregon............................…………… 1,931,102 1,950,919 1,952,719<br />
Illinois............................................. 6,715,404 6,753,070 6,725,873 Pennsylvania.................................. 6,283,057 6,364,440 6,403,374<br />
Indiana............................…………… 3,209,420 3,236,689 3,250,008 Rhode Island............................…… 574,959 573,543 570,978<br />
Iowa............................……………… 1,660,828 1,677,450 1,682,098 South Carolina............................… 2,139,707 2,162,603 2,165,068<br />
Kans<strong>as</strong>........................................... 1,478,535 1,489,686 1,493,640 South Dakota.................................. 443,998 443,705 445,066<br />
Kentucky............................………… 2,043,315 2,037,082 2,039,875 Tennessee............................……… 3,045,511 3,038,276 3,033,920<br />
Louisiana........................................ 1,999,477 2,010,247 2,048,904 Tex<strong>as</strong>.............................................. 11,509,724 11,692,051 11,744,547<br />
Maine............................…………… 704,243 711,959 710,970 Utah............................……………… 1,368,546 1,385,575 1,383,446<br />
Maryland............................………… 2,981,375 3,020,045 3,016,800 Vermont............................………… 352,766 352,725 351,142<br />
M<strong>as</strong>sachusetts............................... 3,406,852 3,417,799 3,412,895 Virginia........................................... 4,063,841 4,148,319 4,144,496<br />
Michigan............................………… 5,016,076 4,958,855 4,943,431 W<strong>as</strong>hington............................……… 3,417,487 3,452,135 3,472,536<br />
Minnesota....................................... 2,934,609 2,936,001 2,937,545 West Virginia.................................. 810,426 805,586 802,447<br />
Mississippi............................……… 1,314,932 1,332,190 1,329,241 Wisconsin............................……… 3,090,130 3,069,189 3,075,250<br />
Wyoming........................................ 288,413 291,255 292,640<br />
NOTE: Some data in this table may differ from data published elsewhere because <strong>of</strong> the continual updating <strong>of</strong> the datab<strong>as</strong>e.<br />
�<br />
��������������<br />
Aug.<br />
2007<br />
Aug.<br />
2007<br />
July<br />
2008 p<br />
July<br />
2008 p<br />
Aug.<br />
2008 p<br />
Aug.<br />
2008 p
��������������������������������������������������������������������������������������������<br />
[In thousands]<br />
2007 2008<br />
2006 2007 Sept. Oct. Nov. Dec. Jan. Feb. Mar. Apr. May June July Aug. p Sept. p<br />
Annual average<br />
Industry<br />
TOTAL NONFARM................. 136,086 137,623 137,837 137,977 138,037 138,078 138,002 137,919 137,831 137,764 137,717 137,617 137,550 137,477 137,318<br />
TOTAL PRIVATE........................ 114,113 115,420 115,610 115,715 115,759 115,745 115,666 115,557 115,454 115,363 115,264 115,154 115,048 114,944 114,776<br />
GOODS-PRODUCING………………<br />
Natural resources and<br />
22,531 22,221 22,138 22,101 22,049 21,976 21,907 21,816 21,737 21,628 21,577 21,491 21,437 21,380 21,303<br />
mining…………..……….......…… 684 723 727 727 735 739 744 744 750 752 760 768 777 789 798<br />
Logging.................................... 64.4 60.8 59.7 59.1 59.9 60.6 60.7 60.2 60.1 60.8 59.5 57.3 57.7 58.3 59.6<br />
Mining.......................................... 619.7 662.1 667.4 667.8 675.0 677.9 683.2 684.0 689.7 690.9 700.6 710.2 719.4 730.3 738.5<br />
Oil and g<strong>as</strong> extraction…………… 134.5 146.0 147.3 148.9 152.3 153.1 154.5 153.8 155.2 154.2 158.3 160.1 162.4 164.5 165.9<br />
Mining, except oil and g<strong>as</strong> 1 …… 220.3 224.5 226.7 226.9 226.0 225.2 227.0 225.7 226.2 225.8 229.6 230.9 231.3 233.6 233.5<br />
Coal mining…………………… 78.0 77.6 78.0 78.1 78.7 78.3 78.6 78.7 79.2 79.3 80.5 81.3 81.2 83.5 84.2<br />
Support activities for mining…… 264.9 291.6 293.4 292.0 296.7 299.6 301.7 304.5 308.3 310.9 312.7 319.2 325.7 332.2 339.1<br />
Construction................................ 7,691 7,614 7,589 7,577 7,520 7,465 7,426 7,382 7,343 7,284 7,246 7,196 7,173 7,160 7,125<br />
Construction <strong>of</strong> buildings........... 1,804.9 1,761.0 1,749.4 1,736.6 1,716.4 1,702.4 1,690.2 1,673.0 1,668.2 1,648.2 1,634.9 1,621.5 1,618.3 1,614.9 1,596.8<br />
Heavy and civil engineering…… 985.1 1,001.2 998.8 999.5 999.0 993.8 984.6 977.6 976.9 967.4 965.3 959.5 955.5 950.1 944.6<br />
Speciality trade contractors....... 4,901.1 4,851.9 4,840.3 4,841.3 4,804.8 4,768.4 4,750.8 4,731.8 4,697.5 4,668.0 4,645.6 4,615.1 4,598.7 4,595.1 4,583.6<br />
Manufacturing.............................. 14,155 13,884 13,822 13,797 13,794 13,772 13,737 13,690 13,644 13,592 13,571 13,527 13,487 13,431 13,380<br />
Production workers................ 10,137 9,979 9,958 9,934 9,944 9,933 9,922 9,879 9,847 9,799 9,784 9,738 9,692 9,643 9,587<br />
Durable goods........................... 8,981 8,816 8,778 8,761 8,763 8,739 8,718 8,685 8,652 8,607 8,594 8,564 8,541 8,489 8,452<br />
Production workers................ 6,355 6,257 6,245 6,232 6,242 6,220 6,214 6,182 6,152 6,112 6,100 6,064 6,033 5,988 5,943<br />
Wood products.......................... 558.8 519.7 513.1 511.8 509.0 507.2 503.5 498.6 492.9 490.9 482.4 477.3 473.3 467.8 463.3<br />
Nonmetallic mineral products 509.6 503.4 501.0 500.9 499.5 496.4 494.4 492.2 487.7 486.3 482.1 479.3 476.6 476.0 473.4<br />
Primary metals.......................... 464.0 456.0 451.6 451.5 452.6 452.2 452.3 451.4 451.3 450.1 448.7 446.8 446.0 442.1 443.5<br />
Fabricated metal products......... 1,553.1 1,563.3 1,565.0 1,568.0 1,565.6 1,562.7 1,560.9 1,557.1 1,556.9 1,544.1 1,544.2 1,537.1 1,531.8 1,534.4 1,527.1<br />
Machinery……….....................<br />
Computer and electronic<br />
1,183.2 1,188.2 1,186.2 1,189.0 1,189.9 1,191.0 1,193.8 1,191.7 1,195.1 1,193.1 1,195.1 1,194.4 1,196.5 1,192.7 1,188.7<br />
products 1 ……………………… 1,307.5<br />
Computer and peripheral<br />
1,271.9 1,260.5 1,256.5 1,260.5 1,257.6 1,256.3 1,251.9 1,254.1 1,253.8 1,250.1 1,247.1 1,246.1 1,249.0 1,249.0<br />
equipment.............................. 196.2 186.9 185.9 185.1 185.5 185.4 184.9 185.9 186.0 186.7 186.2 184.6 185.1 185.8 186.2<br />
Communications equipment…<br />
Semiconductors and<br />
136.2 128.6 128.5 128.1 129.5 129.0 129.5 128.7 129.4 130.9 130.4 131.8 130.8 131.2 131.0<br />
electronic components.......... 457.9 444.5 437.4 435.8 437.0 434.9 433.5 429.7 428.7 426.7 424.2 422.1 423.2 424.5 425.2<br />
Electronic instruments……….<br />
Electrical equipment and<br />
444.5 444.0 442.0 441.9 443.0 443.7 444.3 442.9 446.2 445.7 445.6 444.9 444.1 444.9 444.8<br />
appliances............................... 432.7 427.2 426.0 427.2 426.6 423.8 421.6 420.8 419.9 421.5 422.1 422.0 422.4 418.8 416.4<br />
Transportation equipment.........<br />
Furniture and related<br />
1,768.9 1,710.9 1,706.1 1,689.3 1,693.5 1,684.7 1,678.1 1,672.0 1,651.1 1,630.6 1,636.8 1,631.9 1,624.8 1,588.5 1,575.6<br />
products.....……………………… 560.1 534.5 530.6 528.3 527.0 523.8 520.4 516.0 511.2 506.4 503.5 499.5 495.6 488.8 483.5<br />
Miscellaneous manufacturing 643.7 641.0 637.6 638.2 638.8 639.9 636.4 633.3 632.0 630.2 629.1 628.8 627.7 630.7 631.1<br />
Nondurable goods..................... 5,174 5,068 5,044 5,036 5,031 5,033 5,019 5,005 4,992 4,985 4,977 4,963 4,946 4,942 4,928<br />
Production workers................ 3,782 3,723 3,713 3,702 3,702 3,713 3,708 3,697 3,695 3,687 3,684 3,674 3,659 3,655 3,644<br />
Food manufacturing..................<br />
Beverages and tobacco<br />
1,479.4 1,481.3 1,476.0 1,478.6 1,477.9 1,486.3 1,483.2 1,482.7 1,477.0 1,473.8 1,473.5 1,472.4 1,469.8 1,472.4 1,475.8<br />
products………………………… 194.2 195.7 195.7 195.2 194.3 192.0 191.1 189.3 190.8 193.3 193.7 192.5 192.2 191.6 191.0<br />
Textile mills……………………… 195.0 169.9 164.8 164.9 164.9 163.0 162.0 161.4 158.7 156.4 155.1 152.2 149.9 150.3 149.0<br />
Textile product mills................... 166.7 158.4 156.3 155.9 157.2 155.7 154.0 153.0 153.3 152.2 151.0 149.3 148.7 147.9 148.1<br />
Apparel…………………………. 232.4 213.0 209.2 206.8 206.4 204.8 202.0 200.6 198.1 198.0 196.6 196.4 195.9 197.2 194.8<br />
Leather and allied products....... 36.8 33.9 34.0 33.7 34.1 33.7 34.5 33.5 33.5 33.9 33.7 34.6 33.9 35.2 35.1<br />
Paper and paper products.........<br />
Printing and related support<br />
470.5 460.6 459.0 459.2 458.6 460.3 459.0 457.8 457.9 458.4 458.1 456.6 454.9 452.4 449.4<br />
activities………………………… 634.4 624.2 623.0 622.2 622.0 619.5 620.1 614.6 614.2 611.7 607.3 601.9 598.9 599.4 596.6<br />
Petroleum and coal products..... 113.2 113.4 112.9 112.6 112.1 111.7 112.2 112.5 112.2 112.2 113.4 113.8 114.6 114.1 113.7<br />
Chemicals.................................. 865.9 862.9 864.3 860.7 860.5 862.0 861.2 861.0 860.5 861.3 861.6 859.8 857.1 854.9 852.0<br />
Pl<strong>as</strong>tics and rubber products.. 785.5 754.0 748.4 745.9 743.0 744.2 739.7 738.7 735.6 734.1 732.8 733.9 730.2 726.6 722.3<br />
SERVICE-PROVIDING...................<br />
PRIVATE SERVICE-<br />
113,556 115,402 115,699 115,876 115,988 116,102 116,095 116,103 116,094 116,136 116,140 116,126 116,113 116,097 116,015<br />
PROVIDING………………………<br />
Trade, transportation,<br />
91,582 93,199 93,472 93,614 93,710 93,769 93,759 93,741 93,717 93,735 93,687 93,663 93,611 93,564 93,473<br />
and utilities................................ 26,276 26,608 26,649 26,644 26,693 26,658 26,631 26,579 26,552 26,496 26,451 26,431 26,393 26,356 26,298<br />
Wholesale trade......................... 5,904.5 6,028.3 6,055.6 6,069.8 6,075.0 6,072.9 6,067.3 6,057.6 6,054.3 6,043.9 6,038.4 6,034.6 6,017.6 6,008.3 6,004.2<br />
Durable goods………………….. 3,074.8 3,130.7 3,143.4 3,147.4 3,152.4 3,145.0 3,138.0 3,127.3 3,127.8 3,118.1 3,109.8 3,103.6 3,094.3 3,086.6 3,084.2<br />
Nondurable goods……………<br />
Electronic markets and<br />
2,041.3 2,069.3 2,078.5 2,086.5 2,086.6 2,089.3 2,090.9 2,088.4 2,087.5 2,086.9 2,089.3 2,088.4 2,078.4 2,074.3 2,068.7<br />
agents and brokers…………… 788.5 828.4 833.7 835.9 836.0 838.6 838.4 841.9 839.0 838.9 839.3 842.6 844.9 847.4 851.3<br />
Retail trade................................. 15,353.3<br />
Motor <strong>vehicle</strong>s and parts<br />
15,490.7 15,487.3 15,469.1 15,513.1 15,487.8 15,472.2 15,428.8 15,<strong>401</strong>.4 15,355.7 15,331.8 15,324.2 15,302.4 15,277.0 15,236.9<br />
dealers 1 ……………………… 1,909.7 1,913.1 1,916.0 1,911.9 1,911.0 1,909.3 1,910.2 1,905.1 1,901.5 1,897.6 1,892.9 1,883.3 1,870.6 1,855.6 1,845.4<br />
Automobile dealers..................<br />
Furniture and home<br />
1,246.7 1,245.3 1,246.6 1,247.4 1,244.9 1,244.6 1,244.0 1,236.2 1,233.7 1,228.8 1,224.2 1,215.2 1,204.3 1,191.2 1,182.6<br />
furnishings stores....................<br />
Electronics and appliance<br />
586.9 581.0 576.2 577.3 584.9 584.5 579.9 575.9 570.6 569.0 568.5 568.9 569.2 567.3 565.0<br />
stores.......................................<br />
See notes at end <strong>of</strong> table.<br />
541.1 543.7 540.1 537.1 542.6 540.4 534.3 533.6 535.0 534.7 539.3 534.9 535.2 534.7 530.8<br />
Monthly Labor Review • November 2008 83
Current Labor Statistics: Labor Force Data<br />
������������������������������������������������������������������������������������������������������<br />
[In thousands]<br />
Industry<br />
84 Monthly Labor Review • November 2008<br />
2007 2008<br />
2006 2007 Sept. Oct. Nov. Dec. Jan. Feb. Mar. Apr. May June July Aug. p Sept. p<br />
Annual average<br />
Building material and garden<br />
supply stores................................ 1,324.1 1,305.3 1,291.9 1,285.4 1,279.9 1,271.6 1,266.0 1,258.5 1,250.8 1,240.5 1,240.3 1,238.2 1,230.1 1,234.7 1,231.4<br />
Food and beverage stores.............<br />
Health and personal care<br />
2,821.1 2,848.5 2,856.0 2,859.6 2,871.9 2,871.9 2,880.1 2,885.7 2,890.1 2,882.4 2,880.7 2,879.2 2,879.5 2,868.8 2,863.0<br />
stores……………………………… 961.1 988.6 990.1 991.0 998.6 999.9 1,000.6 993.5 993.9 993.4 990.9 990.4 990.0 985.4 986.2<br />
G<strong>as</strong>oline stations……………………<br />
Clothing and clothing<br />
864.1 861.2 864.2 862.0 859.1 850.5 853.8 854.2 852.6 847.4 841.2 844.4 841.3 840.2 834.5<br />
accessories stores …………………1,450.9<br />
Sporting goods, hobby,<br />
1,500.4 1,502.4 1,500.9 1,524.5 1,508.6 1,498.2 1,496.3 1,498.9 1,495.4 1,494.5 1,494.8 1,494.8 1,498.3 1,500.9<br />
book, and music stores…………… 645.5 658.2 665.1 664.0 664.0 661.6 667.2 661.9 658.6 651.5 653.2 654.5 649.3 654.1 651.4<br />
General merchandise stores1………2,935.0 2,984.6 2,976.5 2,975.8 2,968.2 2,976.7 2,971.1 2,955.7 2,943.9 2,939.0 2,928.5 2,939.6 2,948.4 2,946.4 2,935.3<br />
Department stores………………… 1,557.2 1,576.7 1,570.5 1,568.5 1,560.6 1,568.4 1,564.3 1,543.3 1,534.3 1,528.1 1,514.7 1,516.3 1,517.2 1,511.1 1,500.3<br />
Miscellaneous store retailers……… 881.0 868.7 873.3 869.0 868.3 866.3 869.4 865.3 862.8 863.3 860.8 858.9 857.4 856.4 857.5<br />
Nonstore retailers……………………<br />
Transportation and<br />
432.8 437.6 435.5 435.1 440.1 446.5 441.4 443.1 442.7 441.5 441.0 437.1 436.6 435.1 435.5<br />
warehousing................................. 4,469.6 4,536.0 4,551.2 4,548.7 4,549.0 4,539.9 4,534.5 4,535.5 4,537.7 4,538.3 4,524.1 4,514.0 4,513.6 4,510.5 4,494.4<br />
Air transportation…………….……… 487.0 492.6 494.5 495.2 503.0 502.1 504.7 508.2 507.5 504.5 501.3 497.6 495.2 491.0 486.4<br />
Rail transportation……...…………… 227.5 234.4 234.6 234.0 233.8 232.5 233.8 233.7 233.7 233.5 233.0 230.0 232.1 230.2 231.4<br />
Water transportation………...……… 62.7 64.3 65.0 64.9 65.0 64.4 63.8 62.5 61.6 62.3 61.3 61.8 61.9 60.6 59.6<br />
Truck transportation………..……… 1,435.8<br />
Transit and ground p<strong>as</strong>senger<br />
1,441.2 1,440.6 1,433.6 1,428.7 1,423.1 1,422.5 1,417.4 1,420.4 1,415.2 1,409.8 1,400.1 1,398.3 1,<strong>401</strong>.1 1,388.8<br />
transportation………...…………… 399.3 410.0 417.8 417.4 411.5 411.8 411.9 413.5 412.9 418.3 412.9 416.4 417.1 418.8 422.6<br />
Pipeline transportation………...……<br />
Scenic and sightseeing<br />
38.7 40.1 40.1 40.3 40.6 40.8 40.6 40.9 41.2 41.3 42.2 42.8 43.3 43.0 43.3<br />
transportation…….…………………<br />
Support activities for<br />
27.5 29.4 29.8 30.3 30.9 31.3 31.0 31.5 31.7 31.3 31.1 31.3 30.6 30.5 30.3<br />
transportation………………..…… 570.6 582.9 586.5 589.9 589.2 587.1 584.9 585.9 586.3 588.2 587.1 587.0 590.3 590.7 589.8<br />
Couriers and messengers……...…… 582.4 582.5 580.3 577.9 584.4 588.1 585.5 586.0 585.3 585.0 587.2 587.7 586.5 587.1 584.9<br />
Warehousing and storage………… 638.1 658.7 662.0 665.2 661.9 658.7 655.8 655.9 657.1 658.7 658.2 659.3 658.3 657.5 657.3<br />
Utilities………………………….………...... 548.5 553.4 554.8 556.1 555.5 557.1 557.1 557.0 558.2 557.7 557.1 558.1 559.8 559.7 562.6<br />
Information…………………...….<br />
Publishing industries, except<br />
3,038 3,029 3,031 3,027 3,022 3,018 3,014 3,016 3,013 3,007 3,002 2,997 2,988 2,983 2,980<br />
Internet…………………...…………<br />
Motion picture and sound<br />
902.4 898.2 893.7 894.6 892.2 889.7 889.2 886.8 882.9 882.8 879.7 877.0 873.0 870.6 868.8<br />
recording industries……...………… 375.7 380.0 384.3 380.5 376.3 376.3 372.9 380.1 383.0 382.5 380.9 382.0 379.1 379.0 380.7<br />
Broadc<strong>as</strong>ting, except Internet..<br />
Internet publishing and<br />
broadc<strong>as</strong>ting………………...………<br />
328.3 326.4 327.0 324.8 325.0 321.9 323.0 322.1 322.5 320.8 321.2 319.6 320.4 318.3 319.8<br />
Telecommunications………….…… 1,047.6<br />
ISPs, search portals, and<br />
1,028.3 1,024.4 1,023.6 1,026.4 1,026.8 1,025.3 1,022.0 1,020.1 1,018.0 1,017.7 1,018.9 1,016.1 1,016.3 1,012.9<br />
data processing………..………… 263.2 270.5 273.1 273.2 272.6 273.5 273.0 274.2 272.3 272.2 272.1 269.8 268.3 267.7 266.8<br />
Other information services………… 120.8 125.7 128.8 130.0 129.5 129.3 130.5 131.2 131.9 130.7 130.1 130.0 130.8 131.3 130.5<br />
Financial activities………………..… 8,328 8,308 8,294 8,283 8,260 8,252 8,244 8,231 8,231 8,229 8,226 8,213 8,206 8,201 8,184<br />
Finance and insurance……………..…6,156.0<br />
Monetary authorities—<br />
6,146.6 6,136.0 6,124.5 6,115.5 6,111.2 6,106.2 6,102.2 6,103.4 6,103.8 6,098.8 6,088.0 6,081.1 6,078.7 6,067.6<br />
central bank…………………..……<br />
Credit intermediation and<br />
21.2 21.1 20.9 20.8 20.7 20.7 20.7 20.9 20.9 21.1 21.0 20.9 20.9 20.9 20.9<br />
related activities 1 ………………… 2,924.9<br />
Depository credit<br />
2,881.6 2,856.7 2,844.8 2,834.3 2,829.2 2,825.0 2,820.4 2,811.8 2,807.9 2,800.5 2,794.0 2,788.6 2,786.9 2,789.4<br />
intermediation 1 ……………………1,802.0 1,822.5 1,831.0 1,829.3 1,823.4 1,824.6 1,821.5 1,823.3 1,821.6 1,822.9 1,820.6 1,818.1 1,815.3 1,814.3 1,812.2<br />
Commercial banking..…………… 1,322.9<br />
Securities, commodity<br />
1,345.8 1,350.1 1,350.1 1,344.7 1,345.9 1,342.2 1,344.9 1,343.4 1,344.2 1,343.4 1,343.1 1,340.9 1,340.8 1,340.7<br />
contracts, <strong>investment</strong>s……………<br />
Insurance carriers and<br />
818.3 847.9 853.2 855.0 856.9 856.7 859.2 862.5 865.8 867.2 866.6 866.0 860.6 862.2 854.4<br />
related activities………………...… 2,303.7<br />
Funds, trusts, and other<br />
2,308.1 2,317.0 2,315.3 2,315.6 2,316.8 2,313.9 2,311.1 2,318.4 2,319.7 2,323.2 2,319.2 2,323.2 2,320.3 2,314.7<br />
financial <strong>vehicle</strong>s…………….……<br />
Real estate and rental<br />
87.9 87.8 88.2 88.6 88.0 87.8 87.4 87.3 86.5 87.9 87.5 87.9 87.8 88.4 88.2<br />
and le<strong>as</strong>ing………………………..… 2,172.5 2,161.7 2,157.7 2,158.6 2,144.7 2,140.6 2,138.0 2,128.6 2,127.8 2,124.9 2,127.3 2,125.1 2,125.3 2,122.4 2,116.0<br />
Real estate……………………….… 1,499.0 1,491.9 1,489.8 1,489.1 1,477.1 1,476.4 1,471.4 1,466.0 1,465.0 1,465.7 1,466.4 1,466.2 1,463.7 1,464.8 1,460.0<br />
Rental and le<strong>as</strong>ing services………<br />
Lessors <strong>of</strong> nonfinancial<br />
645.5 640.3 637.8 639.7 637.4 633.6 635.2 631.0 631.1 627.4 629.5 627.2 629.3 625.5 623.7<br />
intangible <strong>as</strong>sets………………..…<br />
Pr<strong>of</strong>essional and business<br />
28.1 29.5 30.1 29.8 30.2 30.6 31.4 31.6 31.7 31.8 31.4 31.7 32.3 32.1 32.3<br />
services…………………………...…<br />
Pr<strong>of</strong>essional and technical<br />
17,566 17,962 18,000 18,070 18,079 18,131 18,101 18,073 18,014 18,031 17,982 17,927 17,904 17,861 17,834<br />
services 1 …………………………… 7,356.7 7,662.0 7,729.7 7,759.3 7,784.8 7,820.5 7,819.2 7,829.2 7,823.5 7,845.6 7,839.1 7,850.3 7,855.4 7,861.2 7,873.3<br />
Legal services……………..……… 1,173.2<br />
Accounting and bookkeeping<br />
1,176.4 1,178.6 1,179.7 1,175.2 1,173.9 1,173.0 1,174.9 1,172.6 1,172.5 1,172.2 1,171.3 1,168.8 1,167.1 1,165.1<br />
services……………………………<br />
Architectural and engineering<br />
889.0 947.2 964.5 971.3 979.4 993.3 992.3 991.9 983.3 986.1 973.8 978.0 976.3 977.7 976.4<br />
services…………………………… 1,385.7<br />
See notes at end <strong>of</strong> table.<br />
1,436.0 1,443.2 1,451.1 1,453.9 1,460.4 1,460.5 1,463.0 1,461.8 1,464.9 1,464.9 1,466.2 1,466.0 1,466.1 1,462.8
������������������������������������������������������������������������������������������������������<br />
[In thousands]<br />
2007 2008<br />
2006 2007 Sept. Oct. Nov. Dec. Jan. Feb. Mar. Apr. May June July Aug. p Sept. p<br />
Annual average<br />
Industry<br />
Computer systems design<br />
and related services…………<br />
Management and technical<br />
1,284.6 1,359.8 1,375.5 1,380.0 1,387.5 1,391.4 1,391.6 1,393.5 1,391.3 1,403.9 1,408.9 1,411.7 1,419.7 1,425.8 1,434.3<br />
consulting services……………<br />
Management <strong>of</strong> companies<br />
886.4 952.8 967.2 974.8 985.1 994.3 989.2 992.7 997.0 1,001.3 1,006.9 1,014.6 1,019.0 1,020.5 1,029.3<br />
and enterprises……..……….....<br />
Administrative and w<strong>as</strong>te<br />
1,810.9 1,846.0 1,854.7 1,860.9 1,850.0 1,847.8 1,845.5 1,844.7 1,839.7 1,841.0 1,836.4 1,837.8 1,830.2 1,830.3 1,825.8<br />
services…………………………… 8,398.3<br />
Administrative and support<br />
8,453.6 8,415.3 8,449.6 8,444.1 8,462.8 8,436.2 8,398.6 8,351.2 8,344.4 8,306.0 8,239.2 8,218.1 8,169.4 8,134.8<br />
services 1 ……………………… 8,050.2 8,096.7 8,057.4 8,092.2 8,081.4 8,099.3 8,070.8 8,036.1 7,987.3 7,978.9 7,939.8 7,873.5 7,852.3 7,801.6 7,767.3<br />
Employment services 1 ……… 3,680.9 3,600.9 3,533.0 3,567.7 3,563.9 3,566.9 3,562.1 3,531.6 3,483.7 3,462.2 3,421.8 3,363.3 3,339.9 3,292.5 3,263.6<br />
Temporary help services…… 2,637.4 2,605.1 2,565.1 2,592.0 2,583.7 2,578.5 2,574.6 2,536.8 2,506.0 2,487.1 2,451.6 2,415.3 2,391.6 2,356.5 2,332.4<br />
Business support services……<br />
Services to buildings<br />
792.9 805.5 802.7 798.5 798.9 803.7 797.4 796.6 794.1 792.8 789.2 785.2 786.2 784.6 783.8<br />
and dwellings…………………<br />
W<strong>as</strong>te management and<br />
1,801.4 1,851.2 1,863.2 1,866.3 1,861.1 1,872.0 1,861.3 1,859.7 1,857.3 1,864.6 1,865.9 1,867.4 1,864.4 1,866.5 1,863.8<br />
remediation services………….<br />
Educational and health<br />
348.1 356.9 357.9 357.4 362.7 363.5 365.4 362.5 363.9 365.5 366.2 365.7 365.8 367.8 367.5<br />
services………………...………. 17,826 18,327 18,451 18,490 18,522 18,568 18,617 18,665 18,709 18,757 18,820 18,891 18,935 18,994 19,019<br />
Educational services…….………<br />
Health care and social<br />
2,900.9 2,949.1 2,967.7 2,974.9 2,975.5 2,984.5 3,003.4 3,009.6 3,018.6 3,030.5 3,047.3 3,099.2 3,111.6 3,127.0 3,131.2<br />
<strong>as</strong>sistance……….……………… 14,925.3<br />
Ambulatory health care<br />
15,377.6 15,483.0 15,515.1 15,546.7 15,583.2 15,613.6 15,655.0 15,690.5 15,726.1 15,772.4 15,791.3 15,823.3 15,867.1 15,887.7<br />
services 1 ……………………… 5,285.8 5,477.1 5,523.1 5,547.3 5,554.8 5,566.0 5,581.7 5,600.0 5,612.5 5,632.8 5,649.9 5,667.7 5,693.2 5,706.4 5,721.3<br />
Offices <strong>of</strong> physicians…………… 2,147.8 2,204.0 2,219.1 2,226.1 2,232.2 2,235.6 2,240.8 2,248.2 2,251.7 2,259.6 2,265.2 2,273.1 2,281.1 2,282.9 2,287.6<br />
Outpatient care centers……… 492.6 507.1 509.3 511.4 511.0 513.0 511.5 512.0 511.9 514.9 516.6 516.7 520.3 522.5 519.5<br />
Home health care services…… 865.6 913.3 925.2 930.3 929.1 930.9 934.7 939.5 943.3 946.1 951.0 954.5 960.8 964.6 966.7<br />
Hospitals…………………………<br />
Nursing and residential<br />
4,423.4 4,517.3 4,541.6 4,549.7 4,558.8 4,572.4 4,579.3 4,592.8 4,606.4 4,616.2 4,635.0 4,642.9 4,653.5 4,667.4 4,670.9<br />
care facilities 1 ………………… 2,892.5 2,952.0 2,962.8 2,963.1 2,967.5 2,971.2 2,974.6 2,979.9 2,983.4 2,987.3 2,989.8 2,987.7 2,986.4 2,988.4 2,986.6<br />
Nursing care facilities………… 1,581.4 1,600.8 1,604.3 1,603.1 1,605.9 1,608.2 1,608.8 1,613.3 1,609.6 1,610.7 1,612.1 1,608.9 1,606.5 1,605.2 1,601.4<br />
Social <strong>as</strong>sistance 1 ……………… 2,323.5 2,431.2 2,455.5 2,455.0 2,465.6 2,473.6 2,478.0 2,482.3 2,488.2 2,489.8 2,497.7 2,493.0 2,490.2 2,504.9 2,508.9<br />
Child day care services……… 818.3 849.2 857.4 853.3 856.7 857.1 859.2 858.6 861.8 858.1 860.2 848.8 842.2 849.2 853.1<br />
Leisure and hospitality………..<br />
Arts, entertainment,<br />
13,110 13,474 13,552 13,604 13,628 13,635 13,644 13,660 13,676 13,690 13,679 13,679 13,655 13,645 13,628<br />
and recreation……….…….……<br />
Performing arts and<br />
1,928.5 1,977.5 1,985.3 1,996.4 2,001.4 2,010.3 2,016.1 2,019.1 2,025.7 2,021.1 2,013.1 2,011.7 1,999.5 1,995.4 1,984.4<br />
spectator sports…………………<br />
Museums, historical sites,<br />
398.5 412.4 414.3 419.0 426.4 429.9 429.5 431.0 433.9 436.4 434.7 438.0 433.1 433.0 429.0<br />
zoos, and parks…………………<br />
Amusements, gambling, and<br />
123.8 130.2 131.6 131.9 131.6 131.5 132.6 131.7 133.4 132.6 133.9 132.7 132.1 131.9 130.8<br />
recreation………………………<br />
Accommodations and<br />
1,406.3 1,434.9 1,439.4 1,445.5 1,443.4 1,448.9 1,454.0 1,456.4 1,458.4 1,452.1 1,444.5 1,441.0 1,434.3 1,430.5 1,424.6<br />
food services…………………… 11,181.1 11,496.3 11,567.0 11,607.5 11,626.8 11,624.7 11,628.0 11,640.7 11,650.7 11,668.7 11,665.8 11,667.4 11,655.6 11,649.1 11,643.4<br />
Accommodations……………….<br />
Food services and drinking<br />
1,832.1 1,856.4 1,856.4 1,863.6 1,870.3 1,858.1 1,854.9 1,854.4 1,849.4 1,853.0 1,849.0 1,843.4 1,835.8 1,827.5 1,826.6<br />
places…………………………… 9,349.0 9,639.9 9,710.6 9,743.9 9,756.5 9,766.6 9,773.1 9,786.3 9,801.3 9,815.7 9,816.8 9,824.0 9,819.8 9,821.6 9,816.8<br />
Other services……………………… 5,438 5,491 5,495 5,496 5,506 5,507 5,508 5,517 5,522 5,525 5,527 5,525 5,530 5,524 5,530<br />
Repair and maintenance……… 1,248.5 1,257.0 1,262.5 1,260.1 1,258.0 1,255.5 1,252.9 1,255.2 1,254.8 1,254.0 1,251.7 1,245.6 1,243.8 1,234.4 1,236.6<br />
Personal and laundry services<br />
Membership <strong>as</strong>sociations and<br />
1,288.4 1,305.2 1,304.4 1,303.4 1,309.7 1,306.9 1,306.6 1,306.4 1,308.5 1,309.9 1,310.6 1,312.8 1,315.1 1,318.1 1,319.0<br />
organizations…………………… 2,901.2 2,928.8 2,927.6 2,932.8 2,938.0 2,944.4 2,948.9 2,955.6 2,959.0 2,961.4 2,964.3 2,966.5 2,970.8 2,971.3 2,974.8<br />
Government.................................. 21,974 22,203 22,227 22,262 22,278 22,333 22,336 22,362 22,377 22,<strong>401</strong> 22,453 22,463 22,502 22,533 22,542<br />
Federal........................................<br />
Federal, except U.S. Postal<br />
2,732 2,727 2,721 2,722 2,728 2,735 2,717 2,725 2,726 2,734 2,740 2,744 2,750 2,747 2,750<br />
Service.................................... 1,962.6 1,964.6 1,961.4 1,963.5 1,966.7 1,972.3 1,977.3 1,982.9 1,986.6 1,996.0 2,006.5 2,013.1 2,018.6 2,025.2 2,031.8<br />
U.S. Postal Service……………… 769.7 762.3 759.3 758.3 761.7 763.1 739.7 741.6 739.1 737.9 733.3 731.0 731.5 721.6 717.8<br />
State........................................... 5,075 5,125 5,138 5,138 5,131 5,153 5,159 5,158 5,157 5,170 5,174 5,179 5,193 5,203 5,208<br />
Education................................ 2,292.5 2,318.4 2,327.7 2,325.9 2,314.3 2,332.5 2,335.1 2,332.9 2,332.9 2,340.8 2,344.4 2,354.3 2,366.7 2,372.2 2,379.7<br />
Other State government.......... 2,782.0 2,806.6 2,810.3 2,812.4 2,816.5 2,820.9 2,824.0 2,824.9 2,823.8 2,829.1 2,829.7 2,824.9 2,826.5 2,830.7 2,828.6<br />
Local........................................... 14,167 14,351 14,368 14,402 14,419 14,445 14,460 14,479 14,494 14,497 14,539 14,540 14,559 14,583 14,584<br />
Education................................ 7,913.0 7,976.6 7,970.6 7,994.6 7,999.6 8,016.5 8,018.0 8,031.9 8,035.7 8,032.1 8,060.0 8,053.2 8,072.5 8,082.1 8,098.4<br />
Other local government........... 6,253.8 6,374.5 6,397.5 6,406.9 6,419.2 6,428.2 6,441.5 6,447.5 6,457.8 6,465.0 6,479.2 6,486.8 6,486.5 6,501.2 6,485.2<br />
1 Includes other industries not shown separately.<br />
NOTE: See "Notes on the data" for a description <strong>of</strong> the most recent benchmark revision.<br />
p = preliminary.<br />
Monthly Labor Review • November 2008 85
Current Labor Statistics: Labor Force Data<br />
13. Average weekly hours <strong>of</strong> production or nonsupervisory workers 1 on private nonfarm payrolls, by industry, monthly<br />
data se<strong>as</strong>onally adjusted<br />
2007 2008<br />
2006 2007 Sept. Oct. Nov. Dec. Jan. Feb. Mar. Apr. May June July Aug. p Sept. p<br />
Annual average<br />
Industry<br />
TOTAL PRIVATE………………………… 33.9<br />
GOODS-PRODUCING……………………… 40.5<br />
Natural resources and mining…………… 45.6<br />
Construction………………………………… 39.0<br />
Manufacturing…………………….............. 41.1<br />
Overtime hours.................................. 4.4<br />
Durable goods..…………………............ 41.4<br />
Overtime hours.................................. 4.4<br />
Wood products..................................... 39.8<br />
Nonmetallic mineral products............... 43.0<br />
Primary metals..................................... 43.6<br />
Fabricated metal products................... 41.4<br />
Machinery………………………………… 42.4<br />
Computer and electronic products…… 40.5<br />
Electrical equipment and appliances… 41.0<br />
Transportation equipment.................... 42.7<br />
Furniture and related products……….. 38.8<br />
Miscellaneous manufacturing.............. 38.7<br />
Nondurable goods.................................. 40.6<br />
Overtime hours.................................. 4.4<br />
Food manufacturing............................… 40.1<br />
Beverage and tobacco products.......... 40.8<br />
Textile mills……………………………… 40.6<br />
Textile product mills…………………… 39.8<br />
Apparel................................................. 36.5<br />
Leather and allied products.................. 38.9<br />
Paper and paper products………………<br />
Printing and related support<br />
42.9<br />
activities............................................. 39.2<br />
Petroleum and coal products…………… 45.0<br />
Chemicals………………………………… 42.5<br />
Pl<strong>as</strong>tics and rubber products……………<br />
PRIVATE SERVICE-<br />
40.6<br />
PROVIDING………………………………<br />
Trade, transportation, and<br />
32.5<br />
utilities.......………………....................... 33.4<br />
Wholesale trade........………………....... 38.0<br />
Retail trade………………………………… 30.5<br />
Transportation and warehousing………… 36.9<br />
Utilities……………………………………… 41.4<br />
Information………………………………… 36.6<br />
Financial activities…………………………<br />
Pr<strong>of</strong>essional and business<br />
35.7<br />
services…………………………………… 34.6<br />
Education and health services…………… 32.5<br />
Leisure and hospitality…………………… 25.7<br />
Other services……………........................ 30.9<br />
86 Monthly Labor Review • November 2008<br />
33.8<br />
40.6<br />
45.9<br />
39.0<br />
41.2<br />
4.2<br />
41.5<br />
4.2<br />
39.4<br />
42.3<br />
42.9<br />
41.6<br />
42.6<br />
40.6<br />
41.2<br />
42.8<br />
39.2<br />
38.9<br />
40.8<br />
4.1<br />
40.7<br />
40.8<br />
40.3<br />
39.7<br />
37.2<br />
38.1<br />
43.2<br />
39.1<br />
44.2<br />
41.9<br />
41.3<br />
32.4<br />
33.3<br />
38.2<br />
30.2<br />
36.9<br />
42.4<br />
36.5<br />
35.9<br />
34.8<br />
32.6<br />
25.5<br />
30.9<br />
33.8<br />
40.6<br />
46.2<br />
38.9<br />
41.4<br />
4.2<br />
41.6<br />
4.2<br />
39.7<br />
42.7<br />
42.6<br />
41.9<br />
42.7<br />
40.6<br />
41.2<br />
42.8<br />
39.4<br />
39.7<br />
40.9<br />
4.1<br />
40.7<br />
40.8<br />
40.4<br />
39.9<br />
37.2<br />
37.9<br />
43.2<br />
38.9<br />
43.4<br />
42.0<br />
41.6<br />
32.4<br />
33.3<br />
38.2<br />
30.2<br />
36.9<br />
42.5<br />
36.5<br />
35.7<br />
34.8<br />
32.6<br />
25.4<br />
30.9<br />
33.8<br />
40.6<br />
46.0<br />
39.0<br />
41.2<br />
4.1<br />
41.5<br />
4.1<br />
39.5<br />
42.6<br />
42.6<br />
41.7<br />
42.9<br />
40.6<br />
40.7<br />
42.7<br />
39.1<br />
39.0<br />
40.8<br />
4.1<br />
40.8<br />
40.6<br />
40.2<br />
39.2<br />
36.6<br />
37.7<br />
43.3<br />
38.8<br />
42.9<br />
41.7<br />
41.7<br />
32.4<br />
33.2<br />
38.1<br />
30.1<br />
36.7<br />
42.2<br />
36.2<br />
35.7<br />
34.8<br />
32.6<br />
25.4<br />
30.8<br />
1 Data relate to production workers in natural resources and mining and<br />
manufacturing, construction workers in construction, and nonsupervisory workers<br />
in the service-providing industries.<br />
33.8<br />
40.7<br />
46.2<br />
39.1<br />
41.3<br />
4.1<br />
41.5<br />
4.1<br />
39.0<br />
42.9<br />
42.7<br />
41.7<br />
42.9<br />
40.9<br />
41.2<br />
42.6<br />
38.9<br />
38.8<br />
40.9<br />
4.1<br />
40.6<br />
40.5<br />
39.9<br />
39.1<br />
36.9<br />
38.1<br />
43.7<br />
39.0<br />
43.8<br />
42.1<br />
42.1<br />
32.4<br />
33.3<br />
38.1<br />
30.2<br />
36.8<br />
42.5<br />
36.2<br />
35.8<br />
34.7<br />
32.6<br />
25.3<br />
30.9<br />
33.8<br />
40.5<br />
45.8<br />
39.0<br />
41.1<br />
4.0<br />
41.3<br />
4.0<br />
39.2<br />
41.5<br />
42.2<br />
41.6<br />
42.9<br />
40.5<br />
41.6<br />
42.1<br />
39.1<br />
38.8<br />
40.8<br />
4.0<br />
40.4<br />
40.8<br />
40.2<br />
39.9<br />
37.5<br />
39.1<br />
44.0<br />
38.8<br />
44.0<br />
41.5<br />
41.4<br />
32.4<br />
33.3<br />
38.3<br />
30.1<br />
36.8<br />
42.8<br />
36.3<br />
35.8<br />
34.8<br />
32.6<br />
25.3<br />
30.8<br />
33.7<br />
40.4<br />
45.7<br />
38.8<br />
41.1<br />
4.0<br />
41.4<br />
4.1<br />
39.0<br />
42.2<br />
42.5<br />
41.6<br />
43.1<br />
40.4<br />
41.4<br />
42.6<br />
38.3<br />
39.0<br />
40.6<br />
3.9<br />
40.5<br />
40.5<br />
38.7<br />
38.6<br />
36.7<br />
38.2<br />
44.0<br />
38.4<br />
43.8<br />
41.6<br />
41.1<br />
32.4<br />
33.4<br />
38.4<br />
30.2<br />
36.6<br />
43.1<br />
36.3<br />
35.8<br />
34.7<br />
32.6<br />
25.3<br />
30.8<br />
33.7<br />
40.4<br />
45.7<br />
38.7<br />
41.1<br />
4.0<br />
41.4<br />
4.1<br />
39.0<br />
42.1<br />
42.4<br />
41.7<br />
43.0<br />
40.5<br />
41.1<br />
42.9<br />
38.2<br />
38.8<br />
40.6<br />
3.9<br />
40.6<br />
40.1<br />
38.8<br />
39.3<br />
36.8<br />
38.2<br />
43.9<br />
38.2<br />
43.6<br />
41.4<br />
41.2<br />
32.3<br />
33.3<br />
38.2<br />
30.1<br />
36.7<br />
42.8<br />
36.2<br />
35.8<br />
34.6<br />
32.6<br />
25.3<br />
30.8<br />
33.8<br />
40.5<br />
46.2<br />
38.9<br />
41.2<br />
4.0<br />
41.5<br />
4.0<br />
38.7<br />
43.1<br />
42.9<br />
41.7<br />
42.7<br />
41.0<br />
41.3<br />
42.3<br />
38.7<br />
39.3<br />
40.7<br />
3.9<br />
40.7<br />
40.4<br />
38.8<br />
39.3<br />
36.7<br />
38.7<br />
43.6<br />
38.6<br />
43.5<br />
41.9<br />
41.1<br />
32.4<br />
33.4<br />
38.4<br />
30.2<br />
36.7<br />
43.3<br />
36.6<br />
35.8<br />
34.8<br />
32.7<br />
25.3<br />
30.9<br />
33.8<br />
40.4<br />
44.9<br />
38.9<br />
41.0<br />
4.0<br />
41.3<br />
4.0<br />
38.8<br />
42.2<br />
42.4<br />
41.6<br />
42.5<br />
41.1<br />
41.1<br />
42.3<br />
38.7<br />
39.3<br />
40.5<br />
3.9<br />
40.8<br />
39.6<br />
38.4<br />
38.3<br />
36.6<br />
38.6<br />
43.3<br />
38.5<br />
43.2<br />
41.3<br />
41.0<br />
32.4<br />
33.4<br />
38.3<br />
30.2<br />
36.7<br />
42.6<br />
36.5<br />
35.9<br />
34.8<br />
32.6<br />
25.4<br />
30.8<br />
33.7<br />
40.2<br />
44.6<br />
38.5<br />
41.0<br />
3.9<br />
41.2<br />
3.9<br />
39.1<br />
42.3<br />
42.2<br />
41.4<br />
42.1<br />
41.2<br />
41.1<br />
42.1<br />
38.8<br />
39.2<br />
40.5<br />
3.8<br />
40.8<br />
39.7<br />
39.0<br />
38.7<br />
36.0<br />
38.7<br />
42.5<br />
38.5<br />
44.2<br />
41.3<br />
41.0<br />
32.4<br />
33.3<br />
38.3<br />
30.1<br />
36.5<br />
42.4<br />
36.6<br />
36.0<br />
34.8<br />
32.7<br />
25.3<br />
30.8<br />
33.7<br />
40.3<br />
45.0<br />
38.7<br />
41.0<br />
3.8<br />
41.2<br />
3.8<br />
39.3<br />
42.1<br />
42.5<br />
41.2<br />
42.1<br />
41.2<br />
41.0<br />
42.2<br />
39.0<br />
39.2<br />
40.5<br />
3.8<br />
40.6<br />
39.0<br />
38.9<br />
39.1<br />
36.4<br />
38.5<br />
42.7<br />
38.1<br />
44.4<br />
41.8<br />
41.1<br />
32.4<br />
33.3<br />
38.3<br />
30.1<br />
36.5<br />
42.8<br />
36.6<br />
35.9<br />
34.8<br />
32.6<br />
25.3<br />
30.8<br />
33.7<br />
40.3<br />
44.8<br />
38.7<br />
41.0<br />
3.8<br />
41.3<br />
3.8<br />
39.0<br />
42.5<br />
42.4<br />
41.2<br />
42.1<br />
41.1<br />
40.9<br />
42.6<br />
38.3<br />
39.1<br />
40.5<br />
3.7<br />
40.5<br />
38.9<br />
39.4<br />
39.2<br />
37.0<br />
38.4<br />
42.6<br />
38.0<br />
45.4<br />
41.9<br />
41.3<br />
32.3<br />
33.2<br />
38.4<br />
30.0<br />
36.4<br />
42.4<br />
36.7<br />
35.7<br />
34.8<br />
32.6<br />
25.2<br />
30.8<br />
33.7<br />
40.3<br />
45.4<br />
38.7<br />
40.9<br />
3.7<br />
41.2<br />
3.7<br />
39.0<br />
42.4<br />
42.8<br />
41.3<br />
42.8<br />
41.1<br />
40.9<br />
41.8<br />
38.0<br />
39.4<br />
40.5<br />
3.7<br />
40.4<br />
38.3<br />
39.6<br />
38.8<br />
36.5<br />
37.7<br />
43.0<br />
38.2<br />
44.8<br />
41.6<br />
41.3<br />
32.4<br />
33.2<br />
38.3<br />
30.1<br />
36.4<br />
42.3<br />
36.7<br />
36.0<br />
34.9<br />
32.6<br />
25.2<br />
30.9<br />
NOTE: See "Notes on the data" for a description <strong>of</strong> the most recent benchmark<br />
revision.<br />
p = preliminary.<br />
33.6<br />
40.0<br />
44.4<br />
38.5<br />
40.7<br />
3.6<br />
40.9<br />
3.5<br />
38.4<br />
41.8<br />
42.4<br />
41.2<br />
42.1<br />
40.9<br />
41.1<br />
41.8<br />
37.5<br />
38.6<br />
40.2<br />
3.7<br />
40.3<br />
38.3<br />
39.2<br />
38.2<br />
36.4<br />
37.9<br />
42.5<br />
38.0<br />
44.5<br />
41.6<br />
40.9<br />
32.3<br />
33.2<br />
38.1<br />
30.1<br />
36.4<br />
42.8<br />
36.8<br />
35.9<br />
34.9<br />
32.5<br />
25.1<br />
30.8
14. Average hourly earnings <strong>of</strong> production or nonsupervisory workers 1 on private nonfarm payrolls, by industry,<br />
monthly data se<strong>as</strong>onally adjusted<br />
2007 2008<br />
2006 2007 Sept. Oct. Nov. Dec. Jan. Feb. Mar. Apr. May June July Aug. p Sept. p<br />
Annual average<br />
Industry<br />
TOTAL PRIVATE<br />
Current dollars……………………… $16.76 $17.42 $17.57 $17.59 $17.64 $17.70 $17.75 $17.81 $17.87 $17.89 $17.95 $18.00 $18.06 $18.14 $18.17<br />
Constant (1982) dollars…………… 8.24 8.32 8.35 8.34 8.27 8.27 8.26 8.29 8.28 8.27 8.24 8.17 8.12 8.17 8.19<br />
GOODS-PRODUCING............................... 18.02 18.67 18.78 18.77 18.84 18.90 18.98 19.04 19.12 19.12 19.17 19.25 19.33 19.40 19.45<br />
Natural resources and mining............... 19.90 20.96 20.99 21.05 21.02 21.54 21.75 21.69 22.01 21.61 21.71 22.01 22.54 23.02 23.17<br />
Construction........................................... 20.02 20.95 21.12 21.07 21.20 21.30 21.38 21.47 21.56 21.60 21.70 21.77 21.84 22.01 22.06<br />
Manufacturing......................................... 16.81 17.26 17.34 17.34 17.40 17.41 17.49 17.55 17.61 17.62 17.65 17.71 17.78 17.75 17.79<br />
Excluding overtime........................... 15.96 16.43 16.50 16.52 16.58 16.60 16.68 16.74 16.79 16.80 16.85 16.93 16.99 16.98 17.04<br />
Durable goods…………………………… 17.68 18.19 18.28 18.28 18.31 18.33 18.41 18.49 18.54 18.58 18.61 18.67 18.75 18.70 18.74<br />
Nondurable goods………………………<br />
PRIVATE SERVICE-<br />
15.33 15.67 15.74 15.73 15.85 15.86 15.92 15.94 16.03 15.99 16.04 16.11 16.14 16.16 16.21<br />
PROVIDING..........………………..............<br />
Trade,transportation, and<br />
16.42 17.10 17.26 17.28 17.33 17.39 17.44 17.50 17.55 17.58 17.64 17.69 17.74 17.82 17.85<br />
utilities………………………………….... 15.39 15.79 15.90 15.94 15.93 16.00 16.02 16.07 16.11 16.11 16.16 16.19 16.20 16.26 16.24<br />
Wholesale trade.................................... 18.91 19.59 19.72 19.77 19.86 19.93 19.97 20.00 20.03 20.05 20.06 20.12 20.16 20.30 20.25<br />
Retail trade........................................... 12.57 12.76 12.83 12.86 12.81 12.81 12.80 12.84 12.86 12.85 12.90 12.90 12.90 12.95 12.93<br />
Transportation and warehousing……… 17.28 17.73 17.86 17.86 17.93 18.07 18.10 18.21 18.25 18.33 18.38 18.39 18.41 18.47 18.45<br />
Utilities…………………………………… 27.40 27.87 28.14 28.32 28.18 28.52 28.61 28.58 28.77 28.56 28.81 29.14 28.65 28.86 28.74<br />
Information.............................................. 23.23 23.94 24.01 24.10 24.11 24.18 24.33 24.41 24.53 24.50 24.67 24.74 24.82 24.86 24.85<br />
Financial activities..................................<br />
Pr<strong>of</strong>essional and business<br />
18.80 19.64 19.76 19.78 19.87 19.91 20.00 20.05 20.11 20.16 20.23 20.26 20.30 20.38 20.44<br />
services.................................................<br />
Education and health<br />
19.13 20.13 20.36 20.31 20.42 20.46 20.53 20.63 20.74 20.84 20.90 21.01 21.12 21.28 21.38<br />
services................................................. 17.38 18.11 18.29 18.34 18.43 18.48 18.54 18.59 18.61 18.64 18.71 18.75 18.81 18.85 18.89<br />
Leisure and hospitality.......................... 9.75 10.41 10.55 10.60 10.61 10.65 10.67 10.73 10.74 10.79 10.81 10.85 10.86 10.90 10.91<br />
Other services......................................... 14.77 15.42 15.55 15.59 15.66 15.71 15.74 15.76 15.77 15.79 15.81 15.85 15.90 15.93 15.97<br />
� Data relate to production workers in natural resources and mining and<br />
manufacturing, construction workers in construction, and nonsupervisory<br />
workers in the service-providing industries.<br />
NOTE: See "Notes on the data" for a description <strong>of</strong> the most recent benchmark revision.<br />
p = preliminary.<br />
Monthly Labor Review • November 2008 87
Current Labor Statistics: Labor Force Data<br />
15. Average hourly earnings <strong>of</strong> production or nonsupervisory workers 1 on private nonfarm payrolls, by industry<br />
2006 2007 Sept.<br />
2007<br />
Oct. Nov. Dec. Jan. Feb. Mar. Apr.<br />
2008<br />
May June July Aug. p Sept. p<br />
Industry<br />
Annual average<br />
TOTAL PRIVATE……………………………… $16.76 $17.42 $17.64 $17.60 $17.63 $17.75 $17.80 $17.85 $17.92 $17.91 $17.90 $17.96 $17.98 $18.05 $18.20<br />
Se<strong>as</strong>onally adjusted……………………. – – 17.57 17.59 17.64 17.70 17.75 17.81 17.87 17.89 17.95 18.00 18.06 18.14 18.17<br />
GOODS-PRODUCING...................................... 18.02 18.67 18.91 18.86 18.88 18.96 18.90 18.94 19.03 19.06 19.13 19.24 19.37 19.50 19.58<br />
Natural resources and mining…………….. 19.90 20.96 20.93 21.02 20.99 21.68 21.96 21.87 22.26 21.77 21.51 21.74 22.41 23.02 23.17<br />
Construction.………….................................. 20.02 20.95 21.32 21.25 21.26 21.38 21.24 21.35 21.43 21.48 21.60 21.69 21.90 22.15 22.28<br />
Manufacturing…………………………………… 16.81 17.26 17.39 17.34 17.42 17.51 17.53 17.55 17.60 17.63 17.63 17.71 17.71 17.74 17.82<br />
Durable goods..………………….................. 17.68 18.19 18.35 18.30 18.36 18.46 18.43 18.50 18.53 18.56 18.57 18.67 18.63 18.70 18.80<br />
Wood products ......................................... 13.39 13.67 13.65 13.81 13.82 13.88 13.90 13.82 13.89 13.96 14.08 14.12 14.22 14.23 14.33<br />
Nonmetallic mineral products ……………… 16.59 16.93 16.94 16.94 17.05 16.94 16.99 16.86 16.80 17.12 16.90 16.98 16.94 16.86 16.97<br />
Primary metals ......................................... 19.36 19.66 19.83 19.81 19.69 19.73 20.04 19.99 20.21 20.20 20.23 20.25 20.42 20.30 20.35<br />
Fabricated metal products ….................... 16.17 16.53 16.61 16.69 16.70 16.82 16.77 16.78 16.85 16.81 16.84 16.92 16.94 17.07 17.15<br />
Machinery …………..……………………… 17.20 17.72 17.79 17.68 17.74 17.95 17.72 17.81 17.85 17.88 17.98 17.87 17.93 17.91 18.00<br />
Computer and electronic products ........... 18.94 19.95 20.20 20.28 20.22 20.33 20.51 20.60 20.80 20.90 20.99 21.06 21.15 21.24 21.30<br />
Electrical equipment and appliances ........ 15.54 15.94 16.10 15.80 15.68 15.73 15.70 15.73 15.66 15.76 15.69 15.75 15.87 15.96 15.98<br />
Transportation equipment ........................ 22.41 23.02 23.42 23.20 23.41 23.46 23.34 23.48 23.46 23.52 23.53 23.79 23.68 23.86 23.94<br />
Furniture and related products ................. 13.80 14.32 14.36 14.36 14.35 14.50 14.38 14.37 14.42 14.45 14.48 14.58 14.52 14.60 14.56<br />
Miscellaneous manufacturing ................... 14.36 14.66 14.78 14.70 14.72 15.00 14.91 14.95 15.08 14.97 14.97 15.15 15.35 15.34 15.42<br />
Nondurable goods………………………...... 15.33 15.67 15.77 15.71 15.83 15.90 15.99 15.93 16.01 16.03 16.04 16.08 16.19 16.13 16.23<br />
Food manufacturing ...........................…… 13.13 13.54 13.65 13.61 13.63 13.70 13.87 13.74 13.83 13.86 13.89 13.95 14.01 13.99 14.03<br />
Beverages and tobacco products ............. 18.18 18.49 18.40 18.69 19.54 19.69 19.55 19.64 19.59 19.26 19.05 18.57 18.86 18.43 18.85<br />
Textile mills .............................................. 12.55 13.00 13.16 12.93 13.06 13.13 13.29 13.35 13.45 13.45 13.50 13.58 13.77 13.65 13.71<br />
Textile product mills ................................. 11.86 11.78 11.73 11.75 11.67 11.75 11.68 11.62 11.78 11.78 11.86 11.80 11.80 11.75 11.87<br />
Apparel ..................................................... 10.65 11.05 11.17 11.16 11.20 11.28 11.43 11.46 11.35 11.51 11.43 11.36 11.35 11.31 11.45<br />
Leather and allied products ……………… 11.44 12.04 12.24 12.10 12.50 12.12 12.78 12.68 12.81 12.63 12.88 12.88 12.85 12.94 12.80<br />
Paper and paper products ………………… 18.01 18.43 18.54 18.50 18.47 18.71 18.78 18.61 18.66 18.58 18.74 18.89 19.07 18.80 18.95<br />
Printing and related support activities…... 15.80 16.15 16.37 16.48 16.33 16.65 16.51 16.49 16.65 16.64 16.66 16.78 16.82 16.80 16.87<br />
Petroleum and coal products ……………… 24.11 25.26 25.95 24.92 26.95 25.52 26.55 26.51 27.22 27.12 27.01 27.17 27.70 27.76 28.35<br />
Chemicals …………………………………… 19.60 19.56 19.52 19.35 19.52 19.57 19.46 19.40 19.35 19.39 19.37 19.33 19.46 19.50 19.72<br />
Pl<strong>as</strong>tics and rubber products .................... 14.97 15.38 15.45 15.41 15.49 15.65 15.56 15.58 15.69 15.77 15.71 15.69 15.84 15.87 15.94<br />
PRIVATE SERVICE-<br />
PROVIDING …………………………………….<br />
Trade, transportation, and<br />
16.42 17.10 17.31 17.27 17.31 17.45 17.52 17.58 17.65 17.62 17.59 17.64 17.63 17.68 17.86<br />
utilities…….…….......................................... 15.39 15.79 16.00 15.94 15.84 15.89 16.02 16.08 16.16 16.16 16.14 16.20 16.21 16.25 16.29<br />
Wholesale trade ……………………………… 18.91 19.59 19.85 19.75 19.89 20.10 20.01 20.03 20.08 20.01 19.93 20.05 20.12 20.23 20.21<br />
Retail trade …………………………………… 12.57 12.76 12.91 12.85 12.70 12.64 12.78 12.82 12.90 12.90 12.91 12.92 12.93 12.96 13.02<br />
Transportation and warehousing …………… 17.28 17.73 17.96 17.89 17.94 18.04 18.08 18.14 18.19 18.28 18.33 18.44 18.53 18.52 18.51<br />
Utilities ………..…..….………..……………… 27.40 27.87 28.27 28.44 28.17 28.61 28.62 28.61 28.88 28.69 28.83 29.01 28.48 28.61 28.80<br />
Information…………………………………..... 23.23 23.94 24.22 24.15 24.11 24.34 24.44 24.44 24.58 24.52 24.60 24.73 24.70 24.75 24.97<br />
Financial activities……..………....................<br />
Pr<strong>of</strong>essional and business<br />
18.80 19.64 19.88 19.79 19.83 19.97 19.96 20.07 20.18 20.22 20.20 20.27 20.20 20.28 20.41<br />
services…………………………………………<br />
Education and health<br />
19.13 20.13 20.34 20.19 20.33 20.67 20.65 20.77 20.93 20.84 20.81 21.03 20.99 21.05 21.27<br />
services………………………………………… 17.38 18.11 18.33 18.33 18.42 18.51 18.61 18.58 18.62 18.63 18.64 18.68 18.85 18.84 18.93<br />
Leisure and hospitality ……………………… 9.75 10.41 10.53 10.61 10.67 10.77 10.73 10.82 10.76 10.80 10.82 10.77 10.72 10.80 10.89<br />
Other services…………………...................... 14.77 15.42 15.58 15.55 15.61 15.75 15.74 15.78 15.84 15.82 15.84 15.85 15.80 15.84 15.99<br />
1 Data relate to production workers in natural resources and mining and<br />
manufacturing, construction workers in construction, and nonsupervisory<br />
workers in the service-providing industries.<br />
88 Monthly Labor Review • November 2008
16. Average weekly earnings <strong>of</strong> production or nonsupervisory workers 1 on private nonfarm payrolls, by industry<br />
Industry<br />
2006 2007<br />
2006 2007 Sept. Oct. Nov. Dec. Jan. Feb. Mar. Apr. May June July Aug. p<br />
Annual average<br />
TOTAL PRIVATE………………… $567.87 $589.72 $603.29 $594.88 $594.13 $605.28 $592.74 $596.19 $605.70 $599.99 $601.44 $612.44 $605.93 $611.90 $613.34<br />
Se<strong>as</strong>onally adjusted.......... – – 593.87 594.54 596.23 598.26 598.18 600.20 604.01 604.68 604.92 606.60 608.62 611.32 610.51<br />
GOODS-PRODUCING……………<br />
Natural resources<br />
730.16 757.06 777.20 771.37 770.30 771.67 756.00 751.92 766.91 766.21 769.03 783.07 780.61 793.65 791.03<br />
and mining……………………….. 907.95 961.78 979.52 981.63 969.74 992.94 988.20 986.34 1,017.28 970.94 950.74 987.00 1,006.21 1,052.01 1,038.02<br />
CONSTRUCTION 781.21 816.06 842.14 841.50 829.14 825.27 805.00 800.63 825.06 824.83 833.76 852.42 858.48 874.93 866.69<br />
Manufacturing…………………… 691.02 711.36 725.16 717.88 722.93 728.42 716.98 714.29 723.36 722.83 721.07 729.65 719.03 729.11 730.62<br />
Durable goods…………………… 732.00 754.12 770.70 763.11 763.78 771.63 759.32 758.50 767.14 766.53 765.08 774.81 760.10 774.18 774.56<br />
Wood products ......................... 532.99 539.10 548.73 548.26 534.83 546.87 530.98 523.78 531.99 538.86 553.34 564.80 558.85 560.66 557.44<br />
Nonmetallic mineral products.... 712.71 716.79 735.20 730.11 731.45 696.23 696.59 686.20 715.68 722.46 718.25 726.74 726.73 728.35 721.23<br />
Primary metals…………………… 843.59 843.28 848.72 841.93 842.73 844.44 851.70 847.58 869.03 852.44 853.71 868.73 859.68 868.84 864.88<br />
Fabricated metal products......... 668.98 687.13 699.28 700.98 701.40 708.12 695.96 693.01 702.65 699.30 697.18 698.80 691.15 706.70 710.01<br />
Machinery…………………………<br />
Computer and electronic<br />
728.84 753.99 761.41 762.01 762.82 780.83 763.73 762.27 763.98 761.69 756.96 754.11 749.47 762.97 757.80<br />
products..................................<br />
Electrical equipment and<br />
766.96 809.19 828.20 827.42 833.06 841.66 822.45 826.06 852.80 854.81 862.69 873.99 862.92 870.84 877.56<br />
appliances............................... 636.95 656.58 666.54 649.38 652.29 671.67 649.98 638.64 645.19 646.16 640.15 648.90 641.15 649.57 658.38<br />
Transportation equipment………<br />
Furniture and related<br />
957.65 985.57 1,011.74 992.96 999.61 1,006.43 994.28 1,002.60 994.70 999.60 985.91 1,013.45 975.62 1,002.12 1,007.87<br />
products………………………..<br />
Miscellaneous<br />
535.90 561.03 572.96 561.48 559.65 578.55 545.00 541.75 555.17 553.44 557.48 571.54 557.57 566.48 551.82<br />
manufacturing.......................... 555.90 569.98 588.24 574.77 571.14 589.50 580.00 575.58 594.15 586.82 583.83 595.40 594.05 605.93 596.75<br />
Nondurable goods....................... 621.97 639.99 651.30 644.11 653.78 656.67 646.00 638.79 648.41 647.61 646.41 652.85 652.46 654.88 660.56<br />
Food manufacturing...................<br />
Beverages and tobacco<br />
525.99 550.65 566.48 560.73 562.92 561.70 556.19 546.85 555.97 559.94 565.32 566.37 567.41 569.39 575.23<br />
products.................................. 741.34 753.80 747.04 751.34 787.46 793.51 778.09 769.89 785.56 768.47 763.91 733.52 737.43 711.40 716.30<br />
Textile mills……………………… 509.39 524.47 536.93 515.91 521.09 539.64 514.32 512.64 521.86 515.14 523.80 529.62 535.65 541.91 544.29<br />
Textile product mills…………… 472.24 467.96 468.03 457.08 457.46 478.23 449.68 454.34 464.13 450.00 454.24 468.46 462.56 458.25 453.43<br />
Apparel…………………………… 389.20 411.52 414.41 410.69 415.52 423.00 416.05 420.58 418.82 423.57 412.62 415.78 416.55 411.68 414.49<br />
Leather and allied products....... 445.47 459.43 462.67 458.59 478.75 484.80 484.36 480.57 499.59 491.31 502.32 501.03 485.73 481.37 481.28<br />
Paper and paper products…….<br />
Printing and related<br />
772.39 795.20 813.91 806.60 816.37 834.47 826.32 805.81 807.98 802.66 788.95 804.71 806.66 806.52 814.85<br />
support activities………………<br />
Petroleum and coal<br />
618.92 632.08 644.98 644.37 640.14 654.35 630.68 629.92 644.36 640.64 638.08 634.28 630.75 643.44 649.50<br />
products………………………… 1,085.50 1,115.24 1,144.40 1,074.05 1,204.67 1,099.91 1,157.58 1,134.63 1,165.02 1,163.45 1,188.44 1,228.08 1,276.97 1,240.87 1,278.59<br />
Chemicals…………………………<br />
Pl<strong>as</strong>tics and rubber<br />
833.67 819.99 821.79 801.09 823.74 818.03 809.54 801.22 810.77 800.81 794.17 811.86 811.48 813.15 824.30<br />
products………………………… 608.41 635.15 647.36 642.60 652.13 657.30 639.52 637.22 644.86 646.57 644.11 649.57 644.69 653.84 655.13<br />
PRIVATE SERVICE-<br />
PROVIDING…………....................<br />
Trade, transportation,<br />
532.78 554.78 567.77 557.82 559.11 570.62 558.89 564.32 573.63 567.36 566.40 578.59 571.21 574.60 576.88<br />
and utilities……………………… 514.34 526.38 542.40 529.21 525.89 535.49 525.46 529.03 538.13 534.90 534.23 545.94 541.41 542.75 545.72<br />
Wholesale trade......…………...... 718.63 748.90 768.20 752.48 757.81 779.88 758.38 759.14 775.09 764.38 761.33 779.95 770.60 774.81 770.00<br />
Retail trade…………………………<br />
Transportation and<br />
383.02 385.20 396.34 386.79 382.27 385.52 379.57 380.75 387.00 385.71 387.30 394.06 391.78 392.69 395.81<br />
warehousing……………………… 636.97 654.83 668.11 656.56 661.99 678.30 650.88 654.85 667.57 663.56 665.38 680.44 674.49 679.68 677.47<br />
Utilities……………………………… 1,135.34 1,182.17 1,215.61 1,208.70 1,194.41 1,221.65 1,222.07 1,218.79 1,241.84 1,225.06 1,219.51 1,247.43 1,204.70 1,204.48 1,244.16<br />
Information………………………… 850.42 873.63 896.14 874.23 872.78 893.28 877.40 879.84 902.09 887.62 890.52 917.48 908.96 913.28 923.89<br />
Financial activities…………………<br />
Pr<strong>of</strong>essional and<br />
672.21 705.29 721.64 702.55 705.95 726.91 708.58 716.50 730.52 721.85 721.14 739.86 719.12 726.02 726.60<br />
business services………………<br />
Education and Education and<br />
662.27 700.15 715.97 702.61 705.45 727.58 704.17 714.49 734.64 725.23 724.19 744.46 728.35 736.75 742.32<br />
health services…………………… 564.94 590.18 603.06 595.73 600.49 607.13 604.83 603.85 608.87 603.61 605.80 610.84 614.51 614.18 615.23<br />
Leisure and hospitality…………. 250.34 265.45 269.57 268.43 266.75 272.48 262.89 269.42 272.23 272.16 273.75 278.94 276.58 278.64 271.16<br />
Other services……………………… 456.50 476.80 484.54 478.94 480.79 488.25 480.07 482.87 489.46 485.67 486.29 492.94 488.22 492.62 492.49<br />
1 Data relate to production workers in natural resources and mining and manufacturing, NOTE: See "Notes on the data" for a description <strong>of</strong> the most recent benchmark revision.<br />
construction workers in construction, and nonsupervisory workers in the service- D<strong>as</strong>h indicates data not available.<br />
providing industries. p = preliminary.<br />
Sept. p<br />
Monthly Labor Review • November 2008 89
Current Labor Statistics: Labor Force Data<br />
17. Diffusion indexes <strong>of</strong> employment change, se<strong>as</strong>onally adjusted<br />
[In percent]<br />
Timespan and year Jan. Feb. Mar. Apr. May June July Aug. Sept. Oct. Nov. Dec.<br />
Private nonfarm payrolls, 278 industries<br />
Over 1-month span:<br />
2004............................................... 50.5 50.5 64.1 62.6 61.7 58.9 56.0 50.0 56.9 56.9 51.3 51.8<br />
2005.............................................. 52.2 60.6 54.2 58.2 55.8 58.2 58.0 61.3 54.7 53.6 62.4 54.7<br />
2006.............................................. 65.1 60.9 64.4 59.3 53.3 52.7 60.4 58.9 53.5 55.8 57.1 56.0<br />
2007………………………………… 51.6 51.8 52.7 51.1 56.6 50.4 52.2 51.6 56.4 54.6 48.2 48.5<br />
2008………………………………… 45.4 41.4 47.4 45.6 46.4 42.3 38.3 44.7 38.1<br />
Over 3-month span:<br />
2004............................................... 54.4 52.9 57.3 63.5 68.8 66.6 61.3 56.4 57.7 59.5 61.9 54.6<br />
2005.............................................. 52.2 55.5 57.5 60.8 58.9 61.9 60.4 63.9 61.1 54.4 54.9 61.3<br />
2006.............................................. 67.2 66.2 66.6 65.5 60.6 58.2 56.0 58.9 55.7 56.4 57.1 58.4<br />
2007………………………………… 58.4 54.7 55.3 54.7 56.2 53.3 53.1 54.7 58.4 56.8 54.7 52.4<br />
2008………………………………… 46.7 42.7 42.3 44.0 43.1 44.0 36.3 38.3 36.1<br />
Over 6-month span:<br />
2004............................................... 50.0 51.6 55.3 60.9 63.7 65.1 65.1 63.9 60.4 61.7 58.2 56.0<br />
2005.............................................. 54.6 57.3 56.8 57.5 57.5 58.2 64.4 62.8 62.0 59.3 61.5 62.0<br />
2006.............................................. 63.1 64.4 67.2 67.0 64.4 66.4 61.5 61.7 60.4 59.7 60.8 56.0<br />
2007………………………………… 59.1 56.4 57.5 56.8 58.8 58.2 56.2 58.0 58.2 57.1 54.6 53.8<br />
2008………………………………… 51.5 49.8 44.7 46.5 43.6 39.1 37.6 38.9 37.2<br />
Over 12-month span:<br />
2004............................................... 40.5 42.3 45.1 48.9 51.3 58.2 57.5 55.7 57.3 58.8 60.6 60.8<br />
2005.............................................. 60.6 60.8 59.7 58.9 58.0 60.0 60.9 63.3 60.4 58.9 59.5 61.7<br />
2006.............................................. 67.2 65.1 65.5 62.6 64.8 66.4 64.4 64.4 66.2 65.1 64.4 65.5<br />
2007………………………………… 62.6 59.1 60.4 58.9 59.5 58.4 57.5 58.8 61.7 60.4 59.9 57.7<br />
2008………………………………… 53.8 54.6 52.6 50.4 49.3 45.8 44.7 42.3 41.2<br />
Manufacturing payrolls, 84 industries<br />
Over 1-month span:<br />
2004............................................... 43.5 47.6 47.0 63.7 50.6 51.2 58.3 42.9 42.9 48.2 42.3 39.9<br />
2005.............................................. 36.3 48.8 42.9 44.6 42.3 35.1 38.1 47.0 45.8 46.4 47.0 47.0<br />
2006.............................................. 57.7 45.8 54.8 48.8 38.1 53.0 50.6 44.0 36.3 40.5 38.1 39.3<br />
2007………………………………… 47.6 35.7 30.4 29.8 37.5 39.3 41.7 33.3 40.5 45.2 44.6 36.3<br />
2008………………………………… 40.5 28.6 38.1 35.1 44.6 30.4 26.8 34.5 26.8<br />
Over 3-month span:<br />
2004............................................... 41.1 40.5 43.5 56.5 58.9 61.3 57.7 47.0 46.4 41.7 44.6 38.7<br />
2005.............................................. 38.1 39.3 42.3 44.6 36.3 37.5 33.3 39.9 45.8 41.7 38.7 49.4<br />
2006.............................................. 54.8 52.4 47.6 48.8 44.6 50.6 42.9 47.6 36.3 37.5 32.1 34.5<br />
2007………………………………… 33.9 28.6 32.1 27.4 29.8 32.7 31.0 34.5 32.1 39.3 44.0 41.7<br />
2008………………………………… 35.7 27.4 26.8 29.2 29.8 35.7 24.4 23.2 20.8<br />
Over 6-month span:<br />
2004............................................... 29.2 31.5 32.7 44.6 49.4 54.8 59.5 56.0 51.2 51.8 44.0 38.7<br />
2005.............................................. 33.9 38.1 35.1 36.9 32.1 32.1 41.7 35.7 36.3 36.9 37.5 42.3<br />
2006.............................................. 42.9 45.2 50.6 47.6 48.2 47.6 46.4 48.8 43.5 41.7 38.7 29.8<br />
2007………………………………… 34.5 27.4 23.8 27.4 31.5 34.5 33.3 31.0 29.2 35.1 34.5 32.7<br />
2008………………………………… 34.5 33.9 32.1 28.0 26.8 20.8 19.6 20.2 21.4<br />
Over 12-month span:<br />
2004............................................... 13.1 14.3 13.1 20.2 23.2 35.7 36.9 38.1 36.9 44.0 44.6 44.6<br />
2005.............................................. 44.6 43.5 41.7 40.5 36.3 35.1 32.1 33.9 32.7 33.3 33.3 38.1<br />
2006.............................................. 44.6 40.5 40.5 39.3 39.3 44.6 41.7 42.3 46.4 48.2 45.2 44.0<br />
2007………………………………… 39.3 36.3 36.9 28.6 29.8 26.2 26.8 29.2 30.4 29.8 33.3 33.9<br />
2008………………………………… 29.8 29.8 29.8 24.4 27.4 24.4 23.8 22.0 25.0<br />
NOTE: Figures are the percent <strong>of</strong> industries with employment<br />
incre<strong>as</strong>ing plus one-half <strong>of</strong> the industries with unchanged<br />
employment, where 50 percent indicates an equal balance<br />
between industries with incre<strong>as</strong>ing and decre<strong>as</strong>ing<br />
employment.<br />
90 Monthly Labor Review • November 2008<br />
See the "Definitions" in this section. See "Notes on the data"<br />
for a description <strong>of</strong> the most recent benchmark revision.<br />
Data for the two most recent months are preliminary.
������������������������������������������������������������������������������<br />
Levels 1 (in thousands) Percent<br />
Industry and region 2008 2008<br />
Mar. Apr. May June July Aug. Sept. p Mar. Apr. May June July Aug. Sept. p<br />
Total 2 ………………………………………………<br />
Industry<br />
3,672 3,612 3,631 3,497 3,492 3,375 3,254 2.6 2.6 2.6 2.5 2.5 2.4 2.3<br />
Total private 2 ………………………………… 3,225 3,192 3,185 3,073 3,046 2,952 2,828 2.7 2.7 2.7 2.6 2.6 2.5 2.4<br />
Construction……………………………… 102 99 130 100 94 85 96 1.4 1.3 1.8 1.4 1.3 1.2 1.3<br />
Manufacturing…………………………… 251 244 249 241 229 245 217 1.8 1.8 1.8 1.7 1.7 1.8 1.6<br />
Trade, transportation, and utilities……… 562 550 572 539 569 572 474 2.1 2.0 2.1 2.0 2.1 2.1 1.8<br />
Pr<strong>of</strong>essional and business services…… 714 676 649 670 696 634 578 3.8 3.6 3.5 3.6 3.7 3.4 3.1<br />
Education and health services………… 696 684 648 682 687 643 640 3.6 3.5 3.3 3.5 3.5 3.3 3.3<br />
Leisure and hospitality…………………… 501 491 503 452 432 383 417 3.5 3.5 3.5 3.2 3.1 2.7 3.0<br />
Government………………………………… 441 422 451 417 412 423 434 1.9 1.8 2.0 1.8 1.8 1.8 1.9<br />
Region 3<br />
Northe<strong>as</strong>t………………………………… 602 618 600 608 615 617 596 2.3 2.3 2.3 2.3 2.3 2.4 2.3<br />
South……………………………………… 1,386 1,364 1,386 1,440 1,384 1,317 1,215 2.7 2.7 2.7 2.8 2.7 2.6 2.4<br />
Midwest…………………………………… 781 752 721 676 638 664 667 2.4 2.3 2.2 2.1 2.0 2.1 2.1<br />
West……………………………………… 918 883 937 789 847 777 760 2.9 2.8 2.9 2.5 2.7 2.5 2.4<br />
1<br />
Detail will not necessarily add to totals because <strong>of</strong> the independent se<strong>as</strong>onal<br />
adjustment <strong>of</strong> the various series.<br />
2<br />
Includes natural resources and mining, information, financial activities, and other<br />
services, not shown separately.<br />
3<br />
Northe<strong>as</strong>t: Connecticut, Maine, M<strong>as</strong>sachusetts, New Hampshire, New Jersey,<br />
New York, Pennsylvania, Rhode Island, Vermont; South: Alabama, Arkans<strong>as</strong>,<br />
Delaware, District <strong>of</strong> Columbia, Florida, Georgia, Kentucky, Louisiana, Maryland,<br />
Mississippi, North Carolina, Oklahoma, South Carolina, Tennessee, Tex<strong>as</strong>, Virginia,<br />
�����������������������������������������������������������������������<br />
West Virginia; Midwest: Illinois, Indiana, Iowa, Kans<strong>as</strong>, Michigan, Minnesota, Missouri,<br />
Nebr<strong>as</strong>ka, North Dakota, Ohio, South Dakota, Wisconsin; West: Al<strong>as</strong>ka, Arizona, California,<br />
Colorado, Hawaii, Idaho, Montana, Nevada, New Mexico, Oregon, Utah, W<strong>as</strong>hington, Wyoming.<br />
NOTE: <strong>The</strong> job openings level is the number <strong>of</strong> job openings on the l<strong>as</strong>t business day <strong>of</strong> the<br />
month; the job openings rate is the number <strong>of</strong> job openings on the l<strong>as</strong>t business day <strong>of</strong> the month<br />
<strong>as</strong> a percent <strong>of</strong> total employment plus job openings.<br />
P<br />
= preliminary.<br />
Levels 1 (in thousands) Percent<br />
Industry and region 2008 2008<br />
Mar. Apr. May June July Aug. Sept. p Mar. Apr. May June July Aug. Sept. p<br />
Total 2 ………………………………………………<br />
Industry<br />
4,569 4,715 4,123 4,438 4,026 4,063 4,364 3.3 3.4 3.0 3.2 2.9 3.0 3.2<br />
Total private 2 ………………………………… 4,147 4,311 3,871 4,136 3,751 3,822 4,094 3.6 3.7 3.4 3.6 3.3 3.3 3.6<br />
Construction……………………………… 350 385 286 354 242 322 261 4.8 5.3 3.9 4.9 3.4 4.5 3.7<br />
Manufacturing…………………………… 309 300 274 285 249 251 273 2.3 2.2 2.0 2.1 1.8 1.9 2.0<br />
Trade, transportation, and utilities……… 884 943 828 906 858 878 877 3.3 3.6 3.1 3.4 3.3 3.3 3.3<br />
Pr<strong>of</strong>essional and business services…… 893 858 770 889 748 701 807 5.0 4.8 4.3 5.0 4.2 3.9 4.5<br />
Education and health services………… 501 510 479 485 474 509 498 2.7 2.7 2.5 2.6 2.5 2.7 2.6<br />
Leisure and hospitality…………………… 801 841 847 741 798 728 814 5.9 6.1 6.2 5.4 5.8 5.3 6.0<br />
Government………………………………… 429 407 329 340 321 315 312 1.9 1.8 1.5 1.5 1.4 1.4 1.4<br />
Region 3<br />
Northe<strong>as</strong>t………………………………… 715 743 646 761 657 679 693 2.8 2.9 2.5 3.0 2.6 2.7 2.7<br />
South……………………………………… 1,703 1,725 1,538 1,666 1,512 1,549 1,598 3.4 3.5 3.1 3.4 3.0 3.1 3.2<br />
Midwest…………………………………… 986 986 914 966 934 926 1,020 3.1 3.1 2.9 3.1 3.0 2.9 3.2<br />
West……………………………………… 1,170 1,246 1,111 1,084 979 1,004 1,035 3.8 4.0 3.6 3.5 3.2 3.3 3.4<br />
1<br />
Detail will not necessarily add to totals because <strong>of</strong> the independent se<strong>as</strong>onal<br />
adjustment <strong>of</strong> the various series.<br />
2<br />
Includes natural resources and mining, information, financial activities, and other<br />
services, not shown separately.<br />
3<br />
Northe<strong>as</strong>t: Connecticut, Maine, M<strong>as</strong>sachusetts, New Hampshire, New Jersey, New<br />
York, Pennsylvania, Rhode Island, Vermont; South: Alabama, Arkans<strong>as</strong>, Delaware,<br />
District <strong>of</strong> Columbia, Florida, Georgia, Kentucky, Louisiana, Maryland, Mississippi,<br />
North Carolina, Oklahoma, South Carolina, Tennessee, Tex<strong>as</strong>, Virginia, West Virginia;<br />
Midwest: Illinois, Indiana, Iowa, Kans<strong>as</strong>, Michigan, Minnesota, Missouri,<br />
Nebr<strong>as</strong>ka, North Dakota, Ohio, South Dakota, Wisconsin; West: Al<strong>as</strong>ka, Arizona,<br />
California, Colorado, Hawaii, Idaho, Montana, Nevada, New Mexico, Oregon, Utah,<br />
W<strong>as</strong>hington, Wyoming.<br />
NOTE: <strong>The</strong> hires level is the number <strong>of</strong> hires during the entire month; the hires rate is<br />
the number <strong>of</strong> hires during the entire month <strong>as</strong> a percent <strong>of</strong> total employment.<br />
p<br />
= preliminary.<br />
Monthly Labor Review • November 2008 91
Current Labor Statistics: Labor Force Data<br />
�����������������������������������������������������������������������������������<br />
Levels 1 (in thousands) Percent<br />
Industry and region 2008 2008<br />
Mar. Apr. May June July Aug. Sept. p Mar. Apr. May June July Aug. Sept. p<br />
Total 2 ………………………………………………<br />
Industry<br />
4,390 4,404 4,313 4,368 4,359 4,398 4,053 3.2 3.2 3.1 3.2 3.2 3.2 3.0<br />
Total private 2 ………………………………… 4,100 4,112 4,046 4,115 4,128 4,149 3,790 3.6 3.6 3.5 3.6 3.6 3.6 3.3<br />
Construction……………………………… 367 378 393 409 473 400 375 5.0 5.2 5.4 5.7 6.6 5.6 5.3<br />
Manufacturing…………………………… 304 390 359 353 324 325 336 2.2 2.9 2.6 2.6 2.4 2.4 2.5<br />
Trade, transportation, and utilities……… 941 1,003 868 1,003 1,013 933 940 3.5 3.8 3.3 3.8 3.8 3.5 3.6<br />
Pr<strong>of</strong>essional and business services…… 806 739 741 799 694 851 713 4.5 4.1 4.1 4.5 3.9 4.8 4.0<br />
Education and health services………… 449 429 434 417 464 424 345 2.4 2.3 2.3 2.2 2.4 2.2 1.8<br />
Leisure and hospitality…………………… 776 722 801 749 741 754 723 5.7 5.3 5.8 5.5 5.4 5.5 5.3<br />
Government………………………………… 291 295 269 259 244 257 253 1.3 1.3 1.2 1.1 1.1 1.1 1.1<br />
Region 3<br />
Northe<strong>as</strong>t………………………………… 737 709 685 658 745 705 629 2.9 2.8 2.7 2.6 2.9 2.7 2.5<br />
South……………………………………… 1,617 1,666 1,614 1,681 1,629 1,633 1,449 3.3 3.4 3.3 3.4 3.3 3.3 2.9<br />
Midwest…………………………………… 918 949 915 954 912 893 934 2.9 3.0 2.9 3.0 2.9 2.8 3.0<br />
West……………………………………… 1,101 1,094 1,096 1,089 1,099 1,142 1,015 3.6 3.5 3.5 3.5 3.6 3.7 3.3<br />
1<br />
Detail will not necessarily add to totals because <strong>of</strong> the independent se<strong>as</strong>onal<br />
adjustment <strong>of</strong> the various series.<br />
2<br />
Includes natural resources and mining, information, financial activities, and other<br />
services, not shown separately.<br />
3<br />
Northe<strong>as</strong>t: Connecticut, Maine, M<strong>as</strong>sachusetts, New Hampshire, New Jersey, New<br />
York, Pennsylvania, Rhode Island, Vermont; South: Alabama, Arkans<strong>as</strong>, Delaware,<br />
District <strong>of</strong> Columbia, Florida, Georgia, Kentucky, Louisiana, Maryland, Mississippi,<br />
North Carolina, Oklahoma, South Carolina, Tennessee, Tex<strong>as</strong>, Virginia, West Virginia;<br />
�����������������������������������������������������������������������<br />
92 Monthly Labor Review • November 2008<br />
Midwest: Illinois, Indiana, Iowa, Kans<strong>as</strong>, Michigan, Minnesota, Missouri, Nebr<strong>as</strong>ka,<br />
North Dakota, Ohio, South Dakota, Wisconsin; West: Al<strong>as</strong>ka, Arizona, California,<br />
Colorado, Hawaii, Idaho, Montana, Nevada, New Mexico, Oregon, Utah, W<strong>as</strong>hington,<br />
Wyoming.<br />
NOTE: <strong>The</strong> total separations level is the number <strong>of</strong> total separations during the entire<br />
month; the total separations rate is the number <strong>of</strong> total separations during the entire<br />
month <strong>as</strong> a percent <strong>of</strong> total employment.<br />
p = preliminary<br />
Levels 1 (in thousands) Percent<br />
Industry and region 2008 2008<br />
Mar. Apr. May June July Aug. Sept. p Mar. Apr. May June July Aug. Sept. p<br />
Total 2 ………………………………………………<br />
Industry<br />
2,375 2,444 2,336 2,365 2,314 2,252 2,101 1.7 1.8 1.7 1.7 1.7 1.6 1.5<br />
Total private 2 ………………………………… 2,258 2,301 2,210 2,242 2,209 2,134 1,995 2.0 2.0 1.9 1.9 1.9 1.9 1.7<br />
Construction……………………………… 111 127 124 139 157 150 109 1.5 1.7 1.7 1.9 2.2 2.1 1.5<br />
Manufacturing…………………………… 157 182 163 154 134 143 146 1.2 1.3 1.2 1.1 1.0 1.1 1.1<br />
Trade, transportation, and utilities……… 535 550 495 545 545 485 498 2.0 2.1 1.9 2.1 2.1 1.8 1.9<br />
Pr<strong>of</strong>essional and business services…… 386 385 391 413 363 352 311 2.1 2.1 2.2 2.3 2.0 2.0 1.7<br />
Education and health services………… 279 270 229 246 268 234 225 1.5 1.4 1.2 1.3 1.4 1.2 1.2<br />
Leisure and hospitality…………………… 529 516 547 525 499 482 473 3.9 3.8 4.0 3.8 3.7 3.5 3.5<br />
Government………………………………… 126 144 126 123 111 121 119 .6 .6 .6 .5 .5 .5 .5<br />
Region 3<br />
Northe<strong>as</strong>t………………………………… 334 368 327 344 341 306 274 1.3 1.4 1.3 1.3 1.3 1.2 1.1<br />
South……………………………………… 996 1,001 937 969 930 912 808 2.0 2.0 1.9 2.0 1.9 1.8 1.6<br />
Midwest…………………………………… 491 500 485 515 504 513 517 1.6 1.6 1.5 1.6 1.6 1.6 1.6<br />
West……………………………………… 568 575 584 539 541 518 494 1.8 1.9 1.9 1.7 1.8 1.7 1.6<br />
1<br />
Detail will not necessarily add to totals because <strong>of</strong> the independent se<strong>as</strong>onal<br />
adjustment <strong>of</strong> the various series.<br />
2<br />
Includes natural resources and mining, information, financial activities, and other<br />
services, not shown separately.<br />
3<br />
Northe<strong>as</strong>t: Connecticut, Maine, M<strong>as</strong>sachusetts, New Hampshire, New Jersey, New<br />
York, Pennsylvania, Rhode Island, Vermont; South: Alabama, Arkans<strong>as</strong>, Delaware,<br />
District <strong>of</strong> Columbia, Florida, Georgia, Kentucky, Louisiana, Maryland, Mississippi,<br />
North Carolina,<br />
Virginia;<br />
Oklahoma, South Carolina, Tennessee, Tex<strong>as</strong>, Virginia, West<br />
Midwest: Illinois, Indiana, Iowa, Kans<strong>as</strong>, Michigan, Minnesota, Missouri,<br />
Nebr<strong>as</strong>ka, North Dakota, Ohio, South Dakota, Wisconsin; West: Al<strong>as</strong>ka, Arizona,<br />
California, Colorado, Hawaii, Idaho, Montana, Nevada, New Mexico, Oregon,<br />
Utah, W<strong>as</strong>hington, Wyoming.<br />
NOTE: <strong>The</strong> quits level is the number <strong>of</strong> quits during the entire month; the quits<br />
rate is the number <strong>of</strong> quits during the entire month <strong>as</strong> a percent <strong>of</strong> total<br />
employment.<br />
p<br />
= preliminary.
22. Quarterly Census <strong>of</strong> Employment and Wages: 10 largest counties, first quarter 2008.<br />
County by NAICS supersector<br />
Establishments,<br />
first quarter<br />
2008<br />
(thousands)<br />
March<br />
2008<br />
(thousands)<br />
Employment Average weekly wage 1<br />
Percent change,<br />
March<br />
2007-08 2<br />
First<br />
quarter<br />
2008<br />
Percent change,<br />
first quarter<br />
2007-08 2<br />
United States 3 .............................................................................. 9,112.7 134,761.1 0.4 $905 2.4<br />
Private industry ........................................................................ 8,820.9 112,728.2 .2 913 2.4<br />
Natural resources and mining .............................................. 125.3 1,731.8 2.7 1,020 10.5<br />
Construction ......................................................................... 890.0 7,020.0 -4.1 898 4.8<br />
Manufacturing ...................................................................... 361.3 13,529.8 -2.3 1,079 1.9<br />
Trade, transportation, and utilities ........................................ 1,923.2 26,031.1 .2 745 1.9<br />
Information ........................................................................... 144.9 3,013.5 -.1 1,469 2.3<br />
Financial activities ................................................................ 872.4 8,005.6 -1.7 1,898 .2<br />
Pr<strong>of</strong>essional and business services ..................................... 1,504.2 17,691.9 .5 1,131 4.2<br />
Education and health services ............................................. 838.9 17,845.8 3.0 767 3.6<br />
Leisure and hospitality ......................................................... 731.2 13,112.5 1.3 360 2.9<br />
Other services ...................................................................... 1,194.1 4,444.1 1.0 547 3.4<br />
Government ............................................................................. 291.8 22,032.9 1.3 868 2.7<br />
Los Angeles, CA .......................................................................... 425.0 4,229.6 .4 992 2.1<br />
Private industry ........................................................................ 421.0 3,617.0 -.1 975 2.1<br />
Natural resources and mining .............................................. .5 11.4 -5.0 1,745 13.8<br />
Construction ......................................................................... 14.0 149.6 -5.5 975 2.6<br />
Manufacturing ...................................................................... 14.8 440.0 -3.4 1,084 5.0<br />
Trade, transportation, and utilities ........................................ 54.2 803.6 .0 792 1.1<br />
Information ........................................................................... 8.5 214.6 2.2 1,723 .5<br />
Financial activities ................................................................ 24.4 240.6 -4.3 1,807 .3<br />
Pr<strong>of</strong>essional and business services ..................................... 42.4 597.5 -1.5 1,165 4.3<br />
Education and health services ............................................. 27.9 492.5 2.9 848 3.4<br />
Leisure and hospitality ......................................................... 26.7 397.9 1.2 528 3.5<br />
Other services ...................................................................... 192.2 250.0 1.3 441 4.8<br />
Government ............................................................................. 4.0 612.6 3.2 1,088 1.5<br />
Cook, IL ........................................................................................ 138.2 2,490.4 -.5 1,147 2.7<br />
Private industry ........................................................................ 136.8 2,178.2 -.5 1,167 2.9<br />
Natural resources and mining .............................................. .1 1.0 -10.7 919 -6.5<br />
Construction ......................................................................... 12.1 84.3 -4.9 1,315 9.2<br />
Manufacturing ...................................................................... 7.0 229.4 -3.0 1,062 1.8<br />
Trade, transportation, and utilities ........................................ 27.4 465.9 -1.1 838 2.7<br />
Information ........................................................................... 2.5 57.5 .4 1,820 .2<br />
Financial activities ................................................................ 15.7 209.6 -2.4 2,905 4.5<br />
Pr<strong>of</strong>essional and business services ..................................... 28.5 431.2 -.1 1,403 3.2<br />
Education and health services ............................................. 13.7 373.1 1.9 833 3.3<br />
Leisure and hospitality ......................................................... 11.5 226.6 1.2 412 1.2<br />
Other services ...................................................................... 14.2 95.6 .6 721 2.9<br />
Government ............................................................................. 1.4 312.2 -.5 1,006 1.3<br />
New York, NY ............................................................................... 118.5 2,376.0 1.7 2,805 -1.0<br />
Private industry ........................................................................ 118.3 1,923.2 1.9 3,229 -1.4<br />
Natural resources and mining .............................................. .0 .2 -4.5 2,375 23.3<br />
Construction ......................................................................... 2.3 36.2 8.9 1,596 8.6<br />
Manufacturing ...................................................................... 3.0 36.0 -6.3 1,499 -4.1<br />
Trade, transportation, and utilities ........................................ 21.7 246.4 .8 1,211 .8<br />
Information ........................................................................... 4.4 134.1 .7 2,698 5.0<br />
Financial activities ................................................................ 18.7 377.6 .7 9,840 -3.7<br />
Pr<strong>of</strong>essional and business services ..................................... 24.7 489.3 1.9 2,343 3.8<br />
Education and health services ............................................. 8.7 293.1 1.5 989 3.9<br />
Leisure and hospitality ......................................................... 11.3 213.9 3.7 766 2.7<br />
Other services ...................................................................... 17.6 87.8 1.8 1,105 7.6<br />
Government ............................................................................. .3 452.8 .8 1,004 1.7<br />
Harris, TX ..................................................................................... 96.6 2,046.5 3.4 1,172 3.8<br />
Private industry ........................................................................ 96.1 1,791.5 3.5 1,212 3.9<br />
Natural resources and mining .............................................. 1.5 80.0 5.5 3,698 13.5<br />
Construction ......................................................................... 6.7 157.0 5.4 1,042 3.6<br />
Manufacturing ...................................................................... 4.7 184.1 2.7 1,524 2.8<br />
Trade, transportation, and utilities ........................................ 22.2 426.9 3.3 1,068 1.6<br />
Information ........................................................................... 1.4 32.6 .0 1,363 -4.0<br />
Financial activities ................................................................ 10.6 120.3 .9 1,701 1.3<br />
Pr<strong>of</strong>essional and business services ..................................... 19.3 337.7 3.6 1,293 4.0<br />
Education and health services ............................................. 10.2 216.5 4.6 839 3.1<br />
Leisure and hospitality ......................................................... 7.5 176.8 3.0 384 2.7<br />
Other services ...................................................................... 11.4 58.5 1.7 632 5.3<br />
Government ............................................................................. .5 255.0 2.9 893 2.1<br />
Maricopa, AZ ................................................................................ 101.7 1,805.2 -1.4 867 1.3<br />
Private industry ........................................................................ 101.0 1,580.7 -1.9 865 1.1<br />
Natural resources and mining .............................................. .5 8.7 -4.2 991 22.5<br />
Construction ......................................................................... 11.0 144.5 -14.2 884 2.4<br />
Manufacturing ...................................................................... 3.6 127.3 -4.6 1,252 5.0<br />
Trade, transportation, and utilities ........................................ 22.4 372.2 -.1 805 -1.2<br />
Information ........................................................................... 1.7 30.9 3.5 1,164 .9<br />
Financial activities ................................................................ 13.0 145.0 -4.4 1,238 -.8<br />
Pr<strong>of</strong>essional and business services ..................................... 22.6 306.8 -1.9 870 1.6<br />
Education and health services ............................................. 9.9 206.5 4.6 879 3.4<br />
Leisure and hospitality ......................................................... 7.3 187.1 .6 405 .0<br />
Other services ...................................................................... 7.2 50.5 1.0 577 4.2<br />
Government ............................................................................. .7 224.5 2.8 880 3.0<br />
See footnotes at end <strong>of</strong> table.<br />
Monthly Labor Review • November 2008 93
Current Labor Statistics: Labor Force Data<br />
22. Continued—Quarterly Census <strong>of</strong> Employment and Wages: 10 largest counties, first quarter 2008.<br />
County by NAICS supersector<br />
94 Monthly Labor Review • November 2008<br />
Establishments,<br />
first quarter<br />
2008<br />
(thousands)<br />
March<br />
2008<br />
(thousands)<br />
Employment Average weekly wage 1<br />
Percent change,<br />
March<br />
2007-08 2<br />
First<br />
quarter<br />
2008<br />
Percent change,<br />
first quarter<br />
2007-08 2<br />
Orange, CA .................................................................................. 100.1 1,504.9 -1.1 $1,019 1.2<br />
Private industry ........................................................................ 98.7 1,347.3 -1.4 1,001 .9<br />
Natural resources and mining .............................................. .2 6.5 .7 563 -.2<br />
Construction ......................................................................... 7.0 94.5 -8.2 1,080 .7<br />
Manufacturing ...................................................................... 5.3 174.2 -2.2 1,188 3.0<br />
Trade, transportation, and utilities ........................................ 17.5 276.2 -.4 918 -1.2<br />
Information ........................................................................... 1.4 29.7 -2.7 1,544 10.9<br />
Financial activities ................................................................ 11.0 115.7 -13.6 1,722 ( 4 )<br />
Pr<strong>of</strong>essional and business services ..................................... 19.0 273.9 -1.7 1,124 3.7<br />
Education and health services ............................................. 9.9 146.8 4.2 863 3.0<br />
Leisure and hospitality ......................................................... 7.1 175.1 3.5 397 .3<br />
Other services ...................................................................... 15.3 47.9 1.7 560 .4<br />
Government ............................................................................. 1.4 157.6 1.5 1,170 3.0<br />
Dall<strong>as</strong>, TX ..................................................................................... 67.8 1,489.7 2.0 1,119 2.6<br />
Private industry ........................................................................ 67.3 1,322.2 1.9 1,145 2.5<br />
Natural resources and mining .............................................. .6 8.0 13.6 3,497 20.2<br />
Construction ......................................................................... 4.4 84.0 3.7 953 1.6<br />
Manufacturing ...................................................................... 3.1 135.4 -3.3 1,320 1.0<br />
Trade, transportation, and utilities ........................................ 15.1 304.5 1.4 1,003 2.8<br />
Information ........................................................................... 1.7 49.6 .3 1,694 5.2<br />
Financial activities ................................................................ 8.8 144.1 ( 4 ) 1,869 2.2<br />
Pr<strong>of</strong>essional and business services ..................................... 14.7 279.0 3.8 1,236 3.3<br />
Education and health services ............................................. 6.6 148.6 3.6 891 3.7<br />
Leisure and hospitality ......................................................... 5.3 128.8 2.6 509 -2.9<br />
Other services ...................................................................... 6.5 38.9 1.7 625 3.1<br />
Government ............................................................................. .5 167.4 2.6 913 3.4<br />
San Diego, CA ............................................................................. 97.8 1,327.6 .0 945 1.9<br />
Private industry ........................................................................ 96.5 1,098.1 -.5 936 1.7<br />
Natural resources and mining .............................................. .8 11.3 .7 534 4.3<br />
Construction ......................................................................... 7.1 78.0 -12.3 985 3.4<br />
Manufacturing ...................................................................... 3.2 103.1 -.2 1,316 5.5<br />
Trade, transportation, and utilities ........................................ 14.4 216.1 -1.7 772 3.8<br />
Information ........................................................................... 1.3 38.2 1.9 1,910 -4.8<br />
Financial activities ................................................................ 9.7 76.4 -6.5 1,329 -2.4<br />
Pr<strong>of</strong>essional and business services ..................................... 16.1 217.2 -.2 1,170 3.5<br />
Education and health services ............................................. 8.1 135.2 4.1 840 3.1<br />
Leisure and hospitality ......................................................... 6.9 160.4 2.0 422 1.7<br />
Other services ...................................................................... 24.3 55.9 1.4 482 .6<br />
Government ............................................................................. 1.3 229.5 2.7 986 2.2<br />
King, WA ...................................................................................... 76.8 1,186.2 2.7 1,125 4.2<br />
Private industry ........................................................................ 76.3 1,030.4 2.9 1,142 4.3<br />
Natural resources and mining .............................................. .4 3.1 .4 1,621 -.5<br />
Construction ......................................................................... 6.9 71.3 4.9 1,086 6.7<br />
Manufacturing ...................................................................... 2.5 112.5 1.4 1,443 4.9<br />
Trade, transportation, and utilities ........................................ 15.1 220.2 2.1 958 1.9<br />
Information ........................................................................... 1.8 77.8 5.2 2,144 12.8<br />
Financial activities ................................................................ 7.1 76.1 .3 1,651 -1.8<br />
Pr<strong>of</strong>essional and business services ..................................... 13.7 189.6 3.3 1,306 3.7<br />
Education and health services ............................................. 6.5 124.4 4.2 837 5.5<br />
Leisure and hospitality ......................................................... 6.2 110.0 3.6 447 -1.1<br />
Other services ...................................................................... 16.2 45.4 .6 599 7.7<br />
Government ............................................................................. .5 155.8 1.5 1,010 3.0<br />
Miami-Dade, FL ............................................................................ 88.2 1,029.9 -1.0 871 1.5<br />
Private industry ........................................................................ 87.8 876.6 -1.2 837 1.2<br />
Natural resources and mining .............................................. .5 10.8 -6.5 465 -1.5<br />
Construction ......................................................................... 6.5 50.9 -11.4 812 1.0<br />
Manufacturing ...................................................................... 2.7 46.0 -6.3 774 2.1<br />
Trade, transportation, and utilities ........................................ 23.5 253.7 -.2 777 1.0<br />
Information ........................................................................... 1.6 20.1 -3.6 1,354 -3.2<br />
Financial activities ................................................................ 10.6 70.5 -3.0 1,483 4.0<br />
Pr<strong>of</strong>essional and business services ..................................... 17.9 135.6 -4.1 992 .7<br />
Education and health services ............................................. 9.4 141.7 3.9 796 3.2<br />
Leisure and hospitality ......................................................... 5.9 107.0 .1 506 1.8<br />
Other services ...................................................................... 7.6 37.2 2.5 526 1.3<br />
Government ............................................................................. .4 153.3 .2 1,062 2.5<br />
1 Average weekly wages were calculated using unrounded data.<br />
2 Percent changes were computed from quarterly employment and pay data<br />
adjusted for noneconomic county recl<strong>as</strong>sifications. See Notes on Current Labor<br />
Statistics.<br />
3 Totals for the United States do not include data for Puerto Rico or the<br />
Virgin Islands.<br />
4 Data do not meet BLS or State agency disclosure standards.<br />
NOTE: Includes workers covered by Unemployment Insurance (UI) and<br />
Unemployment Compensation for Federal Employees (UCFE) programs. Data are<br />
preliminary.
23. Quarterly Census <strong>of</strong> Employment and Wages: by State, first quarter 2008.<br />
State<br />
Establishments,<br />
first quarter<br />
2008<br />
(thousands)<br />
March<br />
2008<br />
(thousands)<br />
Employment Average weekly wage 1<br />
Percent change,<br />
March<br />
2007-08<br />
First<br />
quarter<br />
2008<br />
Percent change,<br />
first quarter<br />
2007-08<br />
United States 2 ................................... 9,112.7 134,761.1 0.4 $905 2.4<br />
Alabama ............................................ 121.7 1,947.0 -.2 740 3.2<br />
Al<strong>as</strong>ka ............................................... 21.1 303.0 1.0 866 4.2<br />
Arizona .............................................. 162.7 2,639.7 -1.3 820 2.4<br />
Arkans<strong>as</strong> ........................................... 85.2 1,178.4 -.1 667 4.1<br />
California ........................................... 1,345.1 15,561.5 .1 1,008 2.1<br />
Colorado ........................................... 178.2 2,300.0 1.7 920 3.6<br />
Connecticut ....................................... 113.2 1,683.9 1.2 1,254 -.6<br />
Delaware ........................................... 29.0 418.4 .5 987 .1<br />
District <strong>of</strong> Columbia ........................... 32.5 680.8 1.1 1,488 4.3<br />
Florida ............................................... 631.0 7,918.6 -2.2 777 1.8<br />
Georgia ............................................. 276.4 4,060.9 .1 847 1.3<br />
Hawaii ............................................... 39.0 628.1 .2 773 3.5<br />
Idaho ................................................. 57.6 645.3 .2 635 .3<br />
Illinois ................................................ 365.0 5,796.1 .1 980 2.6<br />
Indiana .............................................. 160.1 2,858.7 -.7 757 2.4<br />
Iowa .................................................. 94.2 1,469.8 .9 710 3.6<br />
Kans<strong>as</strong> .............................................. 86.0 1,363.2 1.0 737 2.4<br />
Kentucky ........................................... 112.9 1,794.0 .1 714 2.4<br />
Louisiana ........................................... 121.7 1,887.3 1.3 765 4.8<br />
Maine ................................................ 50.8 584.1 .5 701 3.5<br />
Maryland ........................................... 164.8 2,530.3 .0 963 2.8<br />
M<strong>as</strong>sachusetts .................................. 212.7 3,203.1 .9 1,143 3.3<br />
Michigan ............................................ 259.1 4,058.8 -1.8 857 .9<br />
Minnesota ......................................... 173.5 2,644.8 .6 908 4.0<br />
Mississippi ......................................... 71.0 1,138.2 .8 634 3.3<br />
Missouri ............................................. 175.2 2,708.0 .0 768 3.5<br />
Montana ............................................ 42.9 432.4 .9 625 4.3<br />
Nebr<strong>as</strong>ka ........................................... 59.1 912.2 1.4 687 3.2<br />
Nevada .............................................. 76.7 1,266.3 -1.2 839 4.7<br />
New Hampshire ................................ 48.9 621.2 .3 863 3.4<br />
New Jersey ....................................... 276.3 3,939.9 .5 1,133 3.3<br />
New Mexico ...................................... 54.5 823.8 .6 717 4.7<br />
New York .......................................... 582.3 8,555.0 1.3 1,399 .1<br />
North Carolina ................................... 258.4 4,069.1 .9 788 1.3<br />
North Dakota ..................................... 25.4 343.3 2.6 652 6.2<br />
Ohio .................................................. 294.4 5,189.1 -1.0 798 1.0<br />
Oklahoma .......................................... 100.4 1,560.0 1.6 707 4.7<br />
Oregon .............................................. 133.8 1,713.1 .3 776 2.9<br />
Pennsylvania ..................................... 341.5 5,608.8 .5 869 2.4<br />
Rhode Island ..................................... 35.9 464.8 -1.5 851 2.3<br />
South Carolina .................................. 117.4 1,888.3 .1 695 2.8<br />
South Dakota .................................... 30.3 389.4 2.0 632 5.2<br />
Tennessee ........................................ 143.4 2,746.4 .6 761 3.3<br />
Tex<strong>as</strong> ................................................ 558.7 10,420.8 2.8 903 3.6<br />
Utah .................................................. 86.7 1,220.2 1.4 718 3.2<br />
Vermont ............................................ 24.8 300.8 -.3 735 4.4<br />
Virginia .............................................. 229.2 3,653.5 .2 918 2.0<br />
W<strong>as</strong>hington ....................................... 218.9 2,928.6 2.1 899 3.7<br />
West Virginia ..................................... 48.8 700.3 .3 679 4.0<br />
Wisconsin .......................................... 159.7 2,734.3 .2 760 2.2<br />
Wyoming ........................................... 24.8 277.2 2.9 779 6.7<br />
Puerto Rico ....................................... 57.1 1,004.5 -1.6 489 2.7<br />
Virgin Islands .................................... 3.5 46.5 1.1 708 3.4<br />
1 Average weekly wages were calculated using unrounded data.<br />
2 Totals for the United States do not include data for Puerto Rico<br />
or the Virgin Islands.<br />
NOTE: Includes workers covered by Unemployment Insurance (UI)<br />
and Unemployment Compensation for Federal Employees (UCFE)<br />
programs. Data are preliminary.<br />
Monthly Labor Review • November 2008 95
Current Labor Statistics: Labor Force Data<br />
24. Annual data: Quarterly Census <strong>of</strong> Employment and Wages, by ownership<br />
Year<br />
96 Monthly Labor Review • November 2008<br />
Average<br />
establishments<br />
Average<br />
annual<br />
employment<br />
Total annual wages<br />
(in thousands)<br />
Total covered (UI and UCFE)<br />
Average annual wage<br />
per employee<br />
Average<br />
weekly<br />
wage<br />
1998 .................................................. 7,634,018 124,183,549 $3,967,072,423 $31,945 $614<br />
1999 .................................................. 7,820,860 127,042,282 4,235,579,204 33,340 641<br />
2000 .................................................. 7,879,116 129,877,063 4,587,708,584 35,323 679<br />
2001 .................................................. 7,984,529 129,635,800 4,695,225,123 36,219 697<br />
2002 .................................................. 8,101,872 128,233,919 4,714,374,741 36,764 707<br />
2003 .................................................. 8,228,840 127,795,827 4,826,251,547 37,765 726<br />
2004 .................................................. 8,364,795 129,278,176 5,087,561,796 39,354 757<br />
2005 .................................................. 8,571,144 131,571,623 5,351,949,496 40,677 782<br />
2006 .................................................. 8,784,027 133,833,834 5,692,569,465 42,535 818<br />
2007 .................................................. 8,971,897 135,366,106 6,018,089,108 44,458 855<br />
UI covered<br />
1998 .................................................. 7,586,767 121,400,660 $3,845,494,089 $31,676 $609<br />
1999 .................................................. 7,771,198 124,255,714 4,112,169,533 33,094 636<br />
2000 .................................................. 7,828,861 127,005,574 4,454,966,824 35,077 675<br />
2001 .................................................. 7,933,536 126,883,182 4,560,511,280 35,943 691<br />
2002 .................................................. 8,051,117 125,475,293 4,570,787,218 36,428 701<br />
2003 .................................................. 8,177,087 125,031,551 4,676,319,378 37,<strong>401</strong> 719<br />
2004 .................................................. 8,312,729 126,538,579 4,929,262,369 38,955 749<br />
2005 .................................................. 8,518,249 128,837,948 5,188,301,929 40,270 774<br />
2006 .................................................. 8,731,111 131,104,860 5,522,624,197 42,124 810<br />
2007 .................................................. 8,908,198 132,639,806 5,841,231,314 44,038 847<br />
Private industry covered<br />
1998 .................................................. 7,381,518 105,082,368 $3,337,621,699 $31,762 $611<br />
1999 .................................................. 7,560,567 107,619,457 3,577,738,557 33,244 639<br />
2000 .................................................. 7,622,274 110,015,333 3,887,626,769 35,337 680<br />
2001 .................................................. 7,724,965 109,304,802 3,952,152,155 36,157 695<br />
2002 .................................................. 7,839,903 107,577,281 3,930,767,025 36,539 703<br />
2003 .................................................. 7,963,340 107,065,553 4,015,823,311 37,508 721<br />
2004 .................................................. 8,093,142 108,490,066 4,245,640,890 39,134 753<br />
2005 .................................................. 8,294,662 110,611,016 4,480,311,193 40,505 779<br />
2006 .................................................. 8,505,496 112,718,858 4,780,833,389 42,414 816<br />
2007 .................................................. 8,681,001 114,012,221 5,057,840,759 44,362 853<br />
State government covered<br />
1998 .................................................. 67,347 4,240,779 $142,512,445 $33,605 $646<br />
1999 .................................................. 70,538 4,296,673 149,011,194 34,681 667<br />
2000 .................................................. 65,096 4,370,160 158,618,365 36,296 698<br />
2001 .................................................. 64,583 4,452,237 168,358,331 37,814 727<br />
2002 .................................................. 64,447 4,485,071 175,866,492 39,212 754<br />
2003 .................................................. 64,467 4,481,845 179,528,728 40,057 770<br />
2004 .................................................. 64,544 4,484,997 184,414,992 41,118 791<br />
2005 .................................................. 66,278 4,527,514 191,281,126 42,249 812<br />
2006 .................................................. 66,921 4,565,908 200,329,294 43,875 844<br />
2007 .................................................. 67,381 4,611,395 211,677,002 45,903 883<br />
Local government covered<br />
1998 .................................................. 137,902 12,077,513 $365,359,945 $30,251 $582<br />
1999 .................................................. 140,093 12,339,584 385,419,781 31,234 601<br />
2000 .................................................. 141,491 12,620,081 408,721,690 32,387 623<br />
2001 .................................................. 143,989 13,126,143 440,000,795 33,521 645<br />
2002 .................................................. 146,767 13,412,941 464,153,701 34,605 665<br />
2003 .................................................. 149,281 13,484,153 480,967,339 35,669 686<br />
2004 .................................................. 155,043 13,563,517 499,206,488 36,805 708<br />
2005 .................................................. 157,309 13,699,418 516,709,610 37,718 725<br />
2006 .................................................. 158,695 13,820,093 541,461,514 39,179 753<br />
2007 .................................................. 159,816 14,016,190 571,713,553 40,790 784<br />
Federal government covered (UCFE)<br />
1998 .................................................. 47,252 2,782,888 $121,578,334 $43,688 $840<br />
1999 .................................................. 49,661 2,786,567 123,409,672 44,287 852<br />
2000 .................................................. 50,256 2,871,489 132,741,760 46,228 889<br />
2001 .................................................. 50,993 2,752,619 134,713,843 48,940 941<br />
2002 .................................................. 50,755 2,758,627 143,587,523 52,050 1,001<br />
2003 .................................................. 51,753 2,764,275 149,932,170 54,239 1,043<br />
2004 .................................................. 52,066 2,739,596 158,299,427 57,782 1,111<br />
2005 .................................................. 52,895 2,733,675 163,647,568 59,864 1,151<br />
2006 .................................................. 52,916 2,728,974 169,945,269 62,274 1,198<br />
2007 .................................................. 63,699 2,726,300 176,857,794 64,871 1,248<br />
NOTE: Data are final. Detail may not add to total due to rounding.
25. Annual data: Quarterly Census <strong>of</strong> Employment and Wages, establishment size and employment, private ownership, by<br />
supersector, first quarter 2007<br />
Industry, establishments, and<br />
employment<br />
Total<br />
Fewer than<br />
5 workers 1<br />
5 to 9<br />
workers<br />
10 to 19<br />
workers<br />
20 to 49<br />
workers<br />
Size <strong>of</strong> establishments<br />
50 to 99<br />
workers<br />
100 to 249<br />
workers<br />
250 to 499<br />
workers<br />
500 to 999<br />
workers<br />
1,000 or<br />
more<br />
workers<br />
Total all industries 2<br />
Establishments, first quarter .................. 8,572,894 5,189,837 1,407,987 933,910 648,489 220,564 124,980 30,568 11,049 5,510<br />
Employment, March ............................... 112,536,714 7,670,620 9,326,775 12,610,385 19,566,806 15,156,364 18,718,813 10,438,705 7,479,948 11,568,298<br />
Natural resources and mining<br />
Establishments, first quarter .................. 124,002 69,260 23,451 15,289 10,137 3,250 1,842 519 190 64<br />
Employment, March ............................... 1,686,694 111,702 155,044 205,780 304,936 222,684 278,952 179,598 126,338 101,660<br />
Construction<br />
Establishments, first quarter .................. 883,409 580,647 141,835 84,679 52,336 15,341 6,807 1,326 350 88<br />
Employment, March ............................... 7,321,288 835,748 929,707 1,137,104 1,564,722 1,046,790 1,004,689 443,761 232,556 126,211<br />
Manufacturing<br />
Establishments, first quarter .................. 361,070 136,649 61,845 54,940 53,090 25,481 19,333 6,260 2,379 1,093<br />
Employment, March ............................... 13,850,738 238,848 415,276 755,931 1,657,463 1,785,569 2,971,836 2,140,531 1,613,357 2,271,927<br />
Trade, transportation, and utilities<br />
Establishments, first quarter .................. 1,905,750 1,017,012 381,434 248,880 160,549 53,721 34,536 7,315 1,792 511<br />
Employment, March ............................... 25,983,275 1,683,738 2,539,291 3,335,327 4,845,527 3,709,371 5,140,740 2,510,273 1,167,986 1,051,022<br />
Information<br />
Establishments, first quarter .................. 143,094 81,414 20,986 16,338 13,384 5,609 3,503 1,134 489 237<br />
Employment, March ............................... 3,016,454 113,901 139,730 222,710 411,218 387,996 533,877 392,350 335,998 478,674<br />
Financial activities<br />
Establishments, first quarter .................. 863,784 563,670 155,984 81,849 40,668 12,037 6,313 1,863 939 461<br />
Employment, March ............................... 8,146,274 890,816 1,029,911 1,080,148 1,210,332 822,627 945,396 645,988 648,691 872,365<br />
Pr<strong>of</strong>essional and business services<br />
Establishments, first quarter .................. 1,456,681 989,991 196,645 125,014 83,127 32,388 20,412 5,902 2,263 939<br />
Employment, March ............................... 17,612,073 1,375,429 1,292,744 1,685,085 2,520,739 2,243,595 3,102,005 2,012,609 1,535,591 1,844,276<br />
Education and health services<br />
Establishments, first quarter .................. 812,914 388,773 179,011 116,031 75,040 27,393 18,815 4,153 1,906 1,792<br />
Employment, March ............................... 17,331,231 700,195 1,189,566 1,559,689 2,258,922 1,908,595 2,828,678 1,409,073 1,319,128 4,157,385<br />
Leisure and hospitality<br />
Establishments, first quarter .................. 716,126 275,121 120,795 132,408 134,766 39,766 10,681 1,639 646 304<br />
Employment, March ............................... 12,949,319 439,080 815,688 1,858,394 4,054,666 2,648,733 1,510,212 551,528 438,008 633,010<br />
Other services<br />
Establishments, first quarter .................. 1,119,209 908,792 118,963 57,419 25,169 5,562 2,731 457 95 21<br />
Employment, March ............................... 4,402,263 1,109,065 776,354 756,783 732,313 379,320 <strong>401</strong>,371 152,994 62,295 31,768<br />
1 Includes establishments that reported no workers in March 2007.<br />
2 Includes data for uncl<strong>as</strong>sified establishments, not shown separately.<br />
NOTE: Data are final. Detail may not add to total due to rounding.<br />
Monthly Labor Review • November 2008 97
Current Labor Statistics: Labor Force Data<br />
98 Monthly Labor Review • November 2008<br />
26. Average annual wages for 2006 and 2007 for all covered workers 1 by<br />
metropolitan area<br />
Metropolitan area 2<br />
Average annual wages 3<br />
2006 2007<br />
Percent<br />
change,<br />
2006-07<br />
Metropolitan are<strong>as</strong>4 .............................................................. $44,165 $46,139 4.5<br />
Abilene, TX ............................................................................ 29,842 31,567 5.8<br />
Aguadilla-Isabela-San Seb<strong>as</strong>tian, PR ................................... 19,277 20,295 5.3<br />
Akron, OH .............................................................................. 38,088 39,499 3.7<br />
Albany, GA ............................................................................ 32,335 33,378 3.2<br />
Albany-Schenectady-Troy, NY .............................................. 41,027 42,191 2.8<br />
Albuquerque, NM ................................................................... 36,934 38,191 3.4<br />
Alexandria, LA ....................................................................... 31,329 32,757 4.6<br />
Allentown-Bethlehem-E<strong>as</strong>ton, PA-NJ .................................... 39,787 41,784 5.0<br />
Altoona, PA ............................................................................ 30,394 31,988 5.2<br />
Amarillo, TX ........................................................................... 33,574 35,574 6.0<br />
Ames, IA ................................................................................ 35,331 37,041 4.8<br />
Anchorage, AK ...................................................................... 42,955 45,237 5.3<br />
Anderson, IN .......................................................................... 32,184 32,850 2.1<br />
Anderson, SC ........................................................................ 30,373 31,086 2.3<br />
Ann Arbor, MI ........................................................................ 47,186 49,427 4.7<br />
Anniston-Oxford, AL .............................................................. 32,724 34,593 5.7<br />
Appleton, WI .......................................................................... 35,308 36,575 3.6<br />
Asheville, NC ......................................................................... 32,268 33,406 3.5<br />
Athens-Clarke County, GA .................................................... 33,485 34,256 2.3<br />
Atlanta-Sandy Springs-Marietta, GA ..................................... 45,889 48,111 4.8<br />
Atlantic City, NJ ..................................................................... 38,018 39,276 3.3<br />
Auburn-Opelika, AL ............................................................... 30,468 31,554 3.6<br />
Augusta-Richmond County, GA-SC ...................................... 35,638 36,915 3.6<br />
Austin-Round Rock, TX ......................................................... 45,737 46,458 1.6<br />
Bakersfield, CA ...................................................................... 36,020 38,254 6.2<br />
Baltimore-Towson, MD .......................................................... 45,177 47,177 4.4<br />
Bangor, ME ............................................................................ 31,746 32,829 3.4<br />
Barnstable Town, MA ............................................................ 36,437 37,691 3.4<br />
Baton Rouge, LA ................................................................... 37,245 39,339 5.6<br />
Battle Creek, MI ..................................................................... 39,362 40,628 3.2<br />
Bay City, MI ........................................................................... 35,094 35,680 1.7<br />
Beaumont-Port Arthur, TX ..................................................... 39,026 40,682 4.2<br />
Bellingham, WA ..................................................................... 32,618 34,239 5.0<br />
Bend, OR ............................................................................... 33,319 34,318 3.0<br />
Billings, MT ............................................................................ 33,270 35,372 6.3<br />
Binghamton, NY .................................................................... 35,048 36,322 3.6<br />
Birmingham-Hoover, AL ........................................................ 40,798 42,570 4.3<br />
Bismarck, ND ......................................................................... 32,550 34,118 4.8<br />
Blacksburg-Christiansburg-Radford, VA ................................ 34,024 35,248 3.6<br />
Bloomington, IN ..................................................................... 30,913 32,028 3.6<br />
Bloomington-Normal, IL ......................................................... 41,359 42,082 1.7<br />
Boise City-Nampa, ID ............................................................ 36,734 37,553 2.2<br />
Boston-Cambridge-Quincy, MA-NH ...................................... 56,809 59,817 5.3<br />
Boulder, CO ........................................................................... 50,944 52,745 3.5<br />
Bowling Green, KY ................................................................ 32,529 33,308 2.4<br />
Bremerton-Silverdale, WA ..................................................... 37,694 39,506 4.8<br />
Bridgeport-Stamford-Norwalk, CT ......................................... 74,890 79,973 6.8<br />
Brownsville-Harlingen, TX ..................................................... 25,795 27,126 5.2<br />
Brunswick, GA ....................................................................... 32,717 32,705 0.0<br />
Buffalo-Niagara Falls, NY ...................................................... 36,950 38,218 3.4<br />
Burlington, NC ....................................................................... 32,835 33,132 0.9<br />
Burlington-South Burlington, VT ............................................ 40,548 41,907 3.4<br />
Canton-M<strong>as</strong>sillon, OH ........................................................... 33,132 34,091 2.9<br />
Cape Coral-Fort Myers, FL .................................................... 37,065 37,658 1.6<br />
Carson City, NV ..................................................................... 40,115 42,030 4.8<br />
C<strong>as</strong>per, WY ........................................................................... 38,307 41,105 7.3<br />
Cedar Rapids, IA ................................................................... 38,976 41,059 5.3<br />
Champaign-Urbana, IL .......................................................... 34,422 35,788 4.0<br />
Charleston, WV ..................................................................... 36,887 38,687 4.9<br />
Charleston-North Charleston, SC .......................................... 35,267 36,954 4.8<br />
Charlotte-G<strong>as</strong>tonia-Concord, NC-SC .................................... 45,732 46,975 2.7<br />
Charlottesville, VA ................................................................. 39,051 40,819 4.5<br />
Chattanooga, TN-GA ............................................................. 35,358 36,522 3.3<br />
Cheyenne, WY ...................................................................... 35,306 36,191 2.5<br />
Chicago-Naperville-Joliet, IL-IN-WI ....................................... 48,631 50,823 4.5<br />
Chico, CA .............................................................................. 31,557 33,207 5.2<br />
Cincinnati-Middletown, OH-KY-IN ......................................... 41,447 42,969 3.7<br />
Clarksville, TN-KY ................................................................. 30,949 32,216 4.1<br />
Cleveland, TN ........................................................................ 33,075 34,666 4.8<br />
Cleveland-Elyria-Mentor, OH ................................................. 41,325 42,783 3.5<br />
Coeur d’Alene, ID .................................................................. 29,797 31,035 4.2<br />
College Station-Bryan, TX ..................................................... 30,239 32,630 7.9<br />
Colorado Springs, CO ........................................................... 38,325 39,745 3.7<br />
Columbia, MO ........................................................................ 32,207 33,266 3.3<br />
Columbia, SC ........................................................................ 35,209 36,293 3.1<br />
Columbus, GA-AL .................................................................. 32,334 34,511 6.7<br />
Columbus, IN ......................................................................... 40,107 41,078 2.4<br />
Columbus, OH ....................................................................... 41,168 42,655 3.6<br />
Corpus Christi, TX ................................................................. 35,399 37,186 5.0<br />
Corvallis, OR ......................................................................... 40,586 41,981 3.4<br />
See footnotes at end <strong>of</strong> table.
26. Continued — Average annual wages for 2006 and 2007 for all covered<br />
workers 1 by metropolitan area<br />
Metropolitan area2<br />
Average annual wages 3<br />
2006 2007<br />
Percent<br />
change,<br />
2006-07<br />
Cumberland, MD-WV ............................................................ $29,859 $31,373 5.1<br />
Dall<strong>as</strong>-Fort Worth-Arlington, TX ............................................ 47,525 49,627 4.4<br />
Dalton, GA ............................................................................. 33,266 34,433 3.5<br />
Danville, IL ............................................................................. 33,141 34,086 2.9<br />
Danville, VA ........................................................................... 28,870 30,212 4.6<br />
Davenport-Moline-Rock Island, IA-IL ..................................... 37,559 39,385 4.9<br />
Dayton, OH ............................................................................ 39,387 40,223 2.1<br />
Decatur, AL ............................................................................ 34,883 35,931 3.0<br />
Decatur, IL ............................................................................. 39,375 41,039 4.2<br />
Deltona-Daytona Beach-Ormond Beach, FL ......................... 31,197 32,196 3.2<br />
Denver-Aurora, CO ................................................................ 48,232 50,180 4.0<br />
Des Moines, IA ...................................................................... 41,358 42,895 3.7<br />
Detroit-Warren-Livonia, MI .................................................... 47,455 49,019 3.3<br />
Dothan, AL ............................................................................. 31,473 32,367 2.8<br />
Dover, DE .............................................................................. 34,571 35,978 4.1<br />
Dubuque, IA ........................................................................... 33,044 34,240 3.6<br />
Duluth, MN-WI ....................................................................... 33,677 35,202 4.5<br />
Durham, NC ........................................................................... 49,314 52,420 6.3<br />
Eau Claire, WI ....................................................................... 31,718 32,792 3.4<br />
El Centro, CA ......................................................................... 30,035 32,419 7.9<br />
Elizabethtown, KY ................................................................. 32,072 32,701 2.0<br />
Elkhart-Goshen, IN ................................................................ 35,878 36,566 1.9<br />
Elmira, NY ............................................................................. 33,968 34,879 2.7<br />
El P<strong>as</strong>o, TX ............................................................................ 29,903 31,354 4.9<br />
Erie, PA ................................................................................. 33,213 34,788 4.7<br />
Eugene-Springfield, OR ......................................................... 33,257 34,329 3.2<br />
Evansville, IN-KY ................................................................... 36,858 37,182 0.9<br />
Fairbanks, AK ........................................................................ 41,296 42,345 2.5<br />
Fajardo, PR ........................................................................... 21,002 22,075 5.1<br />
Fargo, ND-MN ....................................................................... 33,542 35,264 5.1<br />
Farmington, NM ..................................................................... 36,220 38,572 6.5<br />
Fayetteville, NC ..................................................................... 31,281 33,216 6.2<br />
Fayetteville-Springdale-Rogers, AR-MO ............................... 35,734 37,325 4.5<br />
Flagstaff, AZ .......................................................................... 32,231 34,473 7.0<br />
Flint, MI .................................................................................. 39,409 39,310 -0.3<br />
Florence, SC .......................................................................... 33,610 34,305 2.1<br />
Florence-Muscle Shoals, AL .................................................. 29,518 30,699 4.0<br />
Fond du Lac, WI .................................................................... 33,376 34,664 3.9<br />
Fort Collins-Loveland, CO ..................................................... 37,940 39,335 3.7<br />
Fort Smith, AR-OK ................................................................. 30,932 31,236 1.0<br />
Fort Walton Beach-Crestview-Destin, FL .............................. 34,409 35,613 3.5<br />
Fort Wayne, IN ...................................................................... 35,641 36,542 2.5<br />
Fresno, CA ............................................................................ 33,504 35,111 4.8<br />
Gadsden, AL .......................................................................... 29,499 30,979 5.0<br />
Gainesville, FL ....................................................................... 34,573 36,243 4.8<br />
Gainesville, GA ...................................................................... 34,765 36,994 6.4<br />
Glens Falls, NY ...................................................................... 32,780 33,564 2.4<br />
Goldsboro, NC ....................................................................... 29,331 30,177 2.9<br />
Grand Forks, ND-MN ............................................................. 29,234 30,745 5.2<br />
Grand Junction, CO ............................................................... 33,729 36,221 7.4<br />
Grand Rapids-Wyoming, MI .................................................. 38,056 38,953 2.4<br />
Great Falls, MT ...................................................................... 29,542 31,009 5.0<br />
Greeley, CO ........................................................................... 35,144 37,066 5.5<br />
Green Bay, WI ....................................................................... 36,677 37,788 3.0<br />
Greensboro-High Point, NC ................................................... 35,898 37,213 3.7<br />
Greenville, NC ....................................................................... 32,432 33,703 3.9<br />
Greenville, SC ....................................................................... 35,471 36,536 3.0<br />
Guayama, PR ........................................................................ 24,551 26,094 6.3<br />
Gulfport-Biloxi, MS ................................................................. 34,688 34,971 0.8<br />
Hagerstown-Martinsburg, MD-WV ......................................... 34,621 35,468 2.4<br />
Hanford-Corcoran, CA ........................................................... 31,148 32,504 4.4<br />
Harrisburg-Carlisle, PA .......................................................... 39,807 41,424 4.1<br />
Harrisonburg, VA ................................................................... 31,522 32,718 3.8<br />
Hartford-West Hartford-E<strong>as</strong>t Hartford, CT ............................. 51,282 54,188 5.7<br />
Hattiesburg, MS ..................................................................... 30,059 30,729 2.2<br />
Hickory-Lenoir-Morganton, NC .............................................. 31,323 32,364 3.3<br />
Hinesville-Fort Stewart, GA ................................................... 31,416 33,210 5.7<br />
Holland-Grand Haven, MI ...................................................... 36,895 37,470 1.6<br />
Honolulu, HI ........................................................................... 39,009 40,748 4.5<br />
Hot Springs, AR ..................................................................... 27,684 28,448 2.8<br />
Houma-Bayou Cane-Thibodaux, LA ...................................... 38,417 41,604 8.3<br />
Houston-Baytown-Sugar Land, TX ........................................ 50,177 53,494 6.6<br />
Huntington-Ashland, WV-KY-OH ........................................... 32,648 33,973 4.1<br />
Huntsville, AL ......................................................................... 44,659 45,763 2.5<br />
Idaho Falls, ID ....................................................................... 31,632 29,878 -5.5<br />
Indianapolis, IN ...................................................................... 41,307 42,227 2.2<br />
Iowa City, IA .......................................................................... 35,913 37,457 4.3<br />
Ithaca, NY .............................................................................. 38,337 39,387 2.7<br />
Jackson, MI ........................................................................... 36,836 38,267 3.9<br />
Jackson, MS .......................................................................... 34,605 35,771 3.4<br />
See footnotes at end <strong>of</strong> table.<br />
Monthly Labor Review • November 2008 99
Current Labor Statistics: Labor Force Data<br />
100 Monthly Labor Review • November 2008<br />
26. Continued — Average annual wages for 2006 and 2007 for all covered<br />
workers 1 by metropolitan area<br />
Metropolitan area 2<br />
Average annual wages 3<br />
2006 2007<br />
Percent<br />
change,<br />
2006-07<br />
Jackson, TN ........................................................................... $34,477 $35,059 1.7<br />
Jacksonville, FL ..................................................................... 40,192 41,437 3.1<br />
Jacksonville, NC .................................................................... 25,854 27,005 4.5<br />
Janesville, WI ........................................................................ 36,732 36,790 0.2<br />
Jefferson City, MO ................................................................. 31,771 32,903 3.6<br />
Johnson City, TN ................................................................... 31,058 31,985 3.0<br />
Johnstown, PA ....................................................................... 29,972 31,384 4.7<br />
Jonesboro, AR ....................................................................... 28,972 30,378 4.9<br />
Joplin, MO ............................................................................. 30,111 31,068 3.2<br />
Kalamazoo-Portage, MI ......................................................... 37,099 38,402 3.5<br />
Kankakee-Bradley, IL ............................................................ 32,389 33,340 2.9<br />
Kans<strong>as</strong> City, MO-KS .............................................................. 41,320 42,921 3.9<br />
Kennewick-Richland-P<strong>as</strong>co, WA ........................................... 38,750 40,439 4.4<br />
Killeen-Temple-Fort Hood, TX ............................................... 31,511 32,915 4.5<br />
Kingsport-Bristol-Bristol, TN-VA ............................................ 35,100 36,399 3.7<br />
Kingston, NY .......................................................................... 33,697 35,018 3.9<br />
Knoxville, TN ......................................................................... 37,216 38,386 3.1<br />
Kokomo, IN ............................................................................ 45,808 47,269 3.2<br />
La Crosse, WI-MN ................................................................. 31,819 32,949 3.6<br />
Lafayette, IN .......................................................................... 35,380 36,419 2.9<br />
Lafayette, LA ......................................................................... 38,170 40,684 6.6<br />
Lake Charles, LA ................................................................... 35,883 37,447 4.4<br />
Lakeland, FL .......................................................................... 33,530 34,394 2.6<br />
Lanc<strong>as</strong>ter, PA ........................................................................ 36,171 37,043 2.4<br />
Lansing-E<strong>as</strong>t Lansing, MI ...................................................... 39,890 40,866 2.4<br />
Laredo, TX ............................................................................. 28,051 29,009 3.4<br />
L<strong>as</strong> Cruces, NM ..................................................................... 29,969 31,422 4.8<br />
L<strong>as</strong> Veg<strong>as</strong>-Paradise, NV ....................................................... 40,139 42,336 5.5<br />
Lawrence, KS ........................................................................ 29,896 30,830 3.1<br />
Lawton, OK ............................................................................ 29,830 30,617 2.6<br />
Lebanon, PA .......................................................................... 31,790 32,876 3.4<br />
Lewiston, ID-WA .................................................................... 30,776 31,961 3.9<br />
Lewiston-Auburn, ME ............................................................ 32,231 33,118 2.8<br />
Lexington-Fayette, KY ........................................................... 37,926 39,290 3.6<br />
Lima, OH ............................................................................... 33,790 35,177 4.1<br />
Lincoln, NE ............................................................................ 33,703 34,750 3.1<br />
Little Rock-North Little Rock, AR ........................................... 36,169 39,305 8.7<br />
Logan, UT-ID ......................................................................... 26,766 27,810 3.9<br />
Longview, TX ......................................................................... 35,055 36,956 5.4<br />
Longview, WA ........................................................................ 35,140 37,101 5.6<br />
Los Angeles-Long Beach-Santa Ana, CA ............................. 48,680 50,480 3.7<br />
Louisville, KY-IN .................................................................... 38,673 40,125 3.8<br />
Lubbock, TX .......................................................................... 31,977 32,761 2.5<br />
Lynchburg, VA ....................................................................... 33,242 34,412 3.5<br />
Macon, GA ............................................................................. 34,126 34,243 0.3<br />
Madera, CA ........................................................................... 31,213 33,266 6.6<br />
Madison, WI ........................................................................... 40,007 41,201 3.0<br />
Manchester-N<strong>as</strong>hua, NH ....................................................... 46,659 49,235 5.5<br />
Mansfield, OH ........................................................................ 33,171 33,109 -0.2<br />
Mayaguez, PR ....................................................................... 20,619 21,326 3.4<br />
McAllen-Edinburg-Pharr, TX .................................................. 26,712 27,651 3.5<br />
Medford, OR .......................................................................... 31,697 32,877 3.7<br />
Memphis, TN-MS-AR ............................................................ 40,580 42,339 4.3<br />
Merced, CA ............................................................................ 31,147 32,351 3.9<br />
Miami-Fort Lauderdale-Miami Beach, FL .............................. 42,175 43,428 3.0<br />
Michigan City-La Porte, IN ..................................................... 31,383 32,570 3.8<br />
Midland, TX ........................................................................... 42,625 45,574 6.9<br />
Milwaukee-Waukesha-West Allis, WI .................................... 42,049 43,261 2.9<br />
Minneapolis-St. Paul-Bloomington, MN-WI ........................... 46,931 49,542 5.6<br />
Missoula, MT ......................................................................... 30,652 32,233 5.2<br />
Mobile, AL .............................................................................. 36,126 36,890 2.1<br />
Modesto, CA .......................................................................... 35,468 36,739 3.6<br />
Monroe, LA ............................................................................ 30,618 31,992 4.5<br />
Monroe, MI ............................................................................ 40,938 41,636 1.7<br />
Montgomery, AL .................................................................... 35,383 36,223 2.4<br />
Morgantown, WV ................................................................... 32,608 35,241 8.1<br />
Morristown, TN ...................................................................... 31,914 32,806 2.8<br />
Mount Vernon-Anacortes, WA ............................................... 32,851 34,620 5.4<br />
Muncie, IN ............................................................................. 30,691 31,326 2.1<br />
Muskegon-Norton Shores, MI ................................................ 33,949 34,982 3.0<br />
Myrtle Beach-Conway-North Myrtle Beach, SC .................... 27,905 28,576 2.4<br />
Napa, CA ............................................................................... 41,788 44,171 5.7<br />
Naples-Marco Island, FL ....................................................... 39,320 41,300 5.0<br />
N<strong>as</strong>hville-Davidson--Murfreesboro, TN ................................. 41,003 42,728 4.2<br />
New Haven-Milford, CT ......................................................... 44,892 47,039 4.8<br />
New Orleans-Metairie-Kenner, LA ......................................... 42,434 43,255 1.9<br />
New York-Northern New Jersey-Long Island, NY-NJ-PA ...... 61,388 65,685 7.0<br />
Niles-Benton Harbor, MI ........................................................ 36,967 38,140 3.2<br />
Norwich-New London, CT ..................................................... 43,184 45,463 5.3<br />
Ocala, FL ............................................................................... 31,330 31,623 0.9<br />
See footnotes at end <strong>of</strong> table.
26. Continued — Average annual wages for 2006 and 2007 for all covered<br />
workers 1 by metropolitan area<br />
Metropolitan area 2<br />
Average annual wages3<br />
2006 2007<br />
Percent<br />
change,<br />
2006-07<br />
Ocean City, NJ ...................................................................... $31,801 $32,452 2.0<br />
Odessa, TX ............................................................................ 37,144 41,758 12.4<br />
Ogden-Clearfield, UT ............................................................. 32,890 34,067 3.6<br />
Oklahoma City, OK ................................................................ 35,846 37,192 3.8<br />
Olympia, WA .......................................................................... 37,787 39,678 5.0<br />
Omaha-Council Bluffs, NE-IA ................................................ 38,139 39,273 3.0<br />
Orlando, FL ............................................................................ 37,776 38,633 2.3<br />
Oshkosh-Neenah, WI ............................................................ 39,538 41,014 3.7<br />
Owensboro, KY ..................................................................... 32,491 33,593 3.4<br />
Oxnard-Thousand Oaks-Ventura, CA ................................... 45,467 47,669 4.8<br />
Palm Bay-Melbourne-Titusville, FL ........................................ 39,778 40,975 3.0<br />
Panama City-Lynn Haven, FL ............................................... 33,341 33,950 1.8<br />
Parkersburg-Marietta, WV-OH .............................................. 32,213 33,547 4.1<br />
P<strong>as</strong>cagoula, MS .................................................................... 36,287 39,131 7.8<br />
Pensacola-Ferry P<strong>as</strong>s-Brent, FL ........................................... 33,530 34,165 1.9<br />
Peoria, IL ............................................................................... 42,283 43,470 2.8<br />
Philadelphia-Camden-Wilmington, PA-NJ-DE-MD ................ 48,647 50,611 4.0<br />
Phoenix-Mesa-Scottsdale, AZ ............................................... 42,220 43,697 3.5<br />
Pine Bluff, AR ........................................................................ 32,115 33,094 3.0<br />
Pittsburgh, PA ........................................................................ 40,759 42,910 5.3<br />
Pittsfield, MA .......................................................................... 36,707 38,075 3.7<br />
Pocatello, ID .......................................................................... 28,418 29,268 3.0<br />
Ponce, PR ............................................................................. 20,266 21,019 3.7<br />
Portland-South Portland-Biddeford, ME ................................ 36,979 38,497 4.1<br />
Portland-Vancouver-Beaverton, OR-WA ............................... 42,607 44,335 4.1<br />
Port St. Lucie-Fort Pierce, FL ................................................ 34,408 36,375 5.7<br />
Poughkeepsie-Newburgh-Middletown, NY ............................ 39,528 40,793 3.2<br />
Prescott, AZ ........................................................................... 30,625 32,048 4.6<br />
Providence-New Bedford-Fall River, RI-MA .......................... 39,428 40,674 3.2<br />
Provo-Orem, UT .................................................................... 32,308 34,141 5.7<br />
Pueblo, CO ............................................................................ 30,941 32,552 5.2<br />
Punta Gorda, FL .................................................................... 32,370 32,833 1.4<br />
Racine, WI ............................................................................. 39,002 40,746 4.5<br />
Raleigh-Cary, NC .................................................................. 41,205 42,801 3.9<br />
Rapid City, SD ....................................................................... 29,920 31,119 4.0<br />
Reading, PA .......................................................................... 38,048 39,945 5.0<br />
Redding, CA .......................................................................... 33,307 34,953 4.9<br />
Reno-Sparks, NV ................................................................... 39,537 41,365 4.6<br />
Richmond, VA ........................................................................ 42,495 44,530 4.8<br />
Riverside-San Bernardino-Ontario, CA ................................. 36,668 37,846 3.2<br />
Roanoke, VA ......................................................................... 33,912 35,419 4.4<br />
Rochester, MN ....................................................................... 42,941 44,786 4.3<br />
Rochester, NY ....................................................................... 39,481 40,752 3.2<br />
Rockford, IL ........................................................................... 37,424 38,304 2.4<br />
Rocky Mount, NC .................................................................. 31,556 32,527 3.1<br />
Rome, GA .............................................................................. 34,850 33,041 -5.2<br />
Sacramento--Arden-Arcade--Roseville, CA ........................... 44,552 46,385 4.1<br />
Saginaw-Saginaw Township North, MI .................................. 37,747 37,507 -0.6<br />
St. Cloud, MN ........................................................................ 33,018 33,996 3.0<br />
St. George, UT ...................................................................... 28,034 29,052 3.6<br />
St. Joseph, MO-KS ................................................................ 31,253 31,828 1.8<br />
St. Louis, MO-IL ..................................................................... 41,354 42,873 3.7<br />
Salem, OR ............................................................................. 32,764 33,986 3.7<br />
Salin<strong>as</strong>, CA ............................................................................ 37,974 39,419 3.8<br />
Salisbury, MD ........................................................................ 33,223 34,833 4.8<br />
Salt Lake City, UT .................................................................. 38,630 40,935 6.0<br />
San Angelo, TX ..................................................................... 30,168 30,920 2.5<br />
San Antonio, TX .................................................................... 36,763 38,274 4.1<br />
San Diego-Carlsbad-San Marcos, CA ................................... 45,784 47,657 4.1<br />
Sandusky, OH ....................................................................... 33,526 33,471 -0.2<br />
San Francisco-Oakland-Fremont, CA ................................... 61,343 64,559 5.2<br />
San German-Cabo Rojo, PR ................................................. 19,498 19,777 1.4<br />
San Jose-Sunnyvale-Santa Clara, CA .................................. 76,608 82,038 7.1<br />
San Juan-Cagu<strong>as</strong>-Guaynabo, PR ......................................... 24,812 25,939 4.5<br />
San Luis Obispo-P<strong>as</strong>o Robles, CA ........................................ 35,146 36,740 4.5<br />
Santa Barbara-Santa Maria-Goleta, CA ................................ 40,326 41,967 4.1<br />
Santa Cruz-Watsonville, CA .................................................. 40,776 41,540 1.9<br />
Santa Fe, NM ........................................................................ 35,320 37,395 5.9<br />
Santa Rosa-Petaluma, CA .................................................... 41,533 42,824 3.1<br />
Sar<strong>as</strong>ota-Bradenton-Venice, FL ............................................ 35,751 36,424 1.9<br />
Savannah, GA ....................................................................... 35,684 36,695 2.8<br />
Scranton--Wilkes-Barre, PA .................................................. 32,813 34,205 4.2<br />
Seattle-Tacoma-Bellevue, WA .............................................. 49,455 51,924 5.0<br />
Sheboygan, WI ...................................................................... 35,908 37,049 3.2<br />
Sherman-Denison, TX ........................................................... 34,166 35,672 4.4<br />
Shreveport-Bossier City, LA .................................................. 33,678 34,892 3.6<br />
Sioux City, IA-NE-SD ............................................................. 31,826 33,025 3.8<br />
Sioux Falls, SD ...................................................................... 34,542 36,056 4.4<br />
South Bend-Mishawaka, IN-MI .............................................. 35,089 36,266 3.4<br />
Spartanburg, SC .................................................................... 37,077 37,967 2.4<br />
See footnotes at end <strong>of</strong> table.<br />
Monthly Labor Review • November 2008 101
Current Labor Statistics: Labor Force Data<br />
102 Monthly Labor Review • November 2008<br />
26. Continued — Average annual wages for 2006 and 2007 for all covered<br />
workers 1 by metropolitan area<br />
Metropolitan area 2<br />
Average annual wages3<br />
2006 2007<br />
Percent<br />
change,<br />
2006-07<br />
Spokane, WA ......................................................................... $34,016 $35,539 4.5<br />
Springfield, IL ......................................................................... 40,679 42,420 4.3<br />
Springfield, MA ...................................................................... 37,962 39,487 4.0<br />
Springfield, MO ...................................................................... 30,786 31,868 3.5<br />
Springfield, OH ...................................................................... 31,844 32,017 0.5<br />
State College, PA .................................................................. 35,392 36,797 4.0<br />
Stockton, CA .......................................................................... 36,426 37,906 4.1<br />
Sumter, SC ............................................................................ 29,294 30,267 3.3<br />
Syracuse, NY ......................................................................... 38,081 39,620 4.0<br />
Tallah<strong>as</strong>see, FL ..................................................................... 35,018 36,543 4.4<br />
Tampa-St. Petersburg-Clearwater, FL .................................. 38,016 39,215 3.2<br />
Terre Haute, IN ...................................................................... 31,341 32,349 3.2<br />
Texarkana, TX-Texarkana, AR .............................................. 32,545 34,079 4.7<br />
Toledo, OH ............................................................................ 37,039 38,538 4.0<br />
Topeka, KS ............................................................................ 34,806 36,109 3.7<br />
Trenton-Ewing, NJ ................................................................. 54,274 56,645 4.4<br />
Tucson, AZ ............................................................................ 37,119 38,524 3.8<br />
Tulsa, OK ............................................................................... 37,637 38,942 3.5<br />
Tuscaloosa, AL ...................................................................... 35,613 36,737 3.2<br />
Tyler, TX ................................................................................ 36,173 37,184 2.8<br />
Utica-Rome, NY ..................................................................... 32,457 33,916 4.5<br />
Valdosta, GA ......................................................................... 26,794 27,842 3.9<br />
Vallejo-Fairfield, CA ............................................................... 40,225 42,932 6.7<br />
Vero Beach, FL ...................................................................... 33,823 35,901 6.1<br />
Victoria, TX ............................................................................ 36,642 38,317 4.6<br />
Vineland-Millville-Bridgeton, NJ ............................................. 37,749 39,408 4.4<br />
Virginia Beach-Norfolk-Newport News, VA-NC ..................... 36,071 37,734 4.6<br />
Visalia-Porterville, CA ............................................................ 29,772 30,968 4.0<br />
Waco, TX ............................................................................... 33,450 34,679 3.7<br />
Warner Robins, GA ............................................................... 38,087 39,220 3.0<br />
W<strong>as</strong>hington-Arlington-Alexandria, DC-VA-MD-WV ............... 58,057 60,711 4.6<br />
Waterloo-Cedar Falls, IA ....................................................... 34,329 35,899 4.6<br />
Wausau, WI ........................................................................... 34,438 35,710 3.7<br />
Weirton-Steubenville, WV-OH ............................................... 31,416 32,893 4.7<br />
Wenatchee, WA ..................................................................... 28,340 29,475 4.0<br />
Wheeling, WV-OH ................................................................. 30,620 31,169 1.8<br />
Wichita, KS ............................................................................ 38,763 39,662 2.3<br />
Wichita Falls, TX .................................................................... 30,785 32,320 5.0<br />
Williamsport, PA .................................................................... 31,431 32,506 3.4<br />
Wilmington, NC ...................................................................... 32,948 34,239 3.9<br />
Winchester, VA-WV ............................................................... 34,895 36,016 3.2<br />
Winston-Salem, NC ............................................................... 37,712 38,921 3.2<br />
Worcester, MA ....................................................................... 42,726 44,652 4.5<br />
Yakima, WA ........................................................................... 28,<strong>401</strong> 29,743 4.7<br />
Yauco, PR ............................................................................. 19,001 19,380 2.0<br />
York-Hanover, PA .................................................................. 37,226 38,469 3.3<br />
Youngstown-Warren-Boardman, OH-PA ............................... 33,852 34,698 2.5<br />
Yuba City, CA ........................................................................ 33,642 35,058 4.2<br />
Yuma, AZ ............................................................................... 28,369 30,147 6.3<br />
1 Includes workers covered by Unemployment<br />
Insurance (UI) and Unemployment Compensation<br />
for Federal Employees (UCFE) programs.<br />
2 Includes data for Metropolitan Statistical<br />
Are<strong>as</strong> (MSA) <strong>as</strong> defined by OMB Bulletin No.<br />
04-03 <strong>as</strong> <strong>of</strong> February 18, 2004.<br />
3 Each year’s total is b<strong>as</strong>ed on the MSA<br />
definition for the specific year. Annual changes<br />
include differences resulting from changes in<br />
MSA definitions.<br />
4 Totals do not include the six MSAs within<br />
Puerto Rico.
27. Annual data: Employment status <strong>of</strong> the population<br />
����������������������<br />
Employment status 1997 1998 1<br />
1999 1<br />
2000 1<br />
2001 1<br />
2002 2003 2004 2005 2006 2007<br />
Civilian noninstitutional population........... 203,133 205,220 207,753 212,577 215,092 217,570 221,168 223,357 226,082 228,815 231,867<br />
Civilian labor force............................…… 136,297 137,673 139,368 142,583 143,734 144,863 146,510 147,<strong>401</strong> 149,320 151,428 153,124<br />
Labor force participation rate............... 67.1 67.1 67.1 67.1 66.8 66.6 66.2 66 66 66.2 66<br />
Employed............................………… 129,558 131,463 133,488 136,891 136,933 136,485 137,736 139,252 141,730 144,427 146,047<br />
Employment-population ratio.......... 63.8 64.1 64.3 64.4 63.7 62.7 62.3 62.3 62.7 63.1 63<br />
Unemployed............................……… 6,739 6,210 5,880 5,692 6,801 8,378 8,774 8,149 7,591 7,001 7,078<br />
Unemployment rate........................ 4.9 4.5 4.2 4 4.7 5.8 6 5.5 5.1 4.6 4.6<br />
Not in the labor force............................… 66,837 67,547 68,385 69,994 71,359 72,707 74,658 75,956 76,762 77,387 78,743<br />
1 Not strictly comparable with prior years.<br />
28. Annual data: Employment levels by industry<br />
��������������<br />
Industry 1997 1998 1999 2000 2001 2002 2003 2004 2005 2006 2007<br />
Total private employment............................… 103,113 106,021 108,686 110,996 110,707 108,828 108,416 109,814 111,899 114,184 115,717<br />
Total nonfarm employment…………………… 122,776 125,930 128,993 131,785 131,826 130,341 129,999 131,435 133,703 136,174 137,969<br />
Goods-producing............................……… 23,886 24,354 24,465 24,649 23,873 22,557 21,816 21,882 22,190 22,570 22,378<br />
Natural resources and mining................. 654 645 598 599 606 583 572 591 628 684 722<br />
Construction............................…………… 5,813 6,149 6,545 6,787 6,826 6,716 6,735 6,976 7,336 7,689 7,624<br />
Manufacturing............................………… 17,419 17,560 17,322 17,263 16,441 15,259 14,510 14,315 14,226 14,197 14,032<br />
Private service-providing.......................... 79,227 81,667 84,221 86,346 86,834 86,271 86,599 87,932 89,709 91,615 93,339<br />
Trade, transportation, and utilities.......... 24,700 25,186 25,771 26,225 25,983 25,497 25,287 25,533 25,959 26,231 26,472<br />
Wholesale trade............................……… 5,663.90 5,795.20 5,892.50 5,933.20 5,772.70 5,652.30 5,607.50 5,662.90 5,764.40 5,897.60 6,005.30<br />
Retail trade............................………… 14,388.90 14,609.30 14,970.10 15,279.80 15,238.60 15,025.10 14,917.30 15,058.20 15,279.60 15,319.30 15,382.00<br />
Transportation and warehousing......... 4,026.50 4,168.00 4,300.30 4,410.30 4,372.00 4,223.60 4,185.40 4,248.60 4,360.90 4,465.80 4,531.20<br />
Utilities............................……………… 620.9 613.4 608.5 601.3 599.4 596.2 577 563.8 554 548.5 553.5<br />
Information............................…………… 3,084 3,218 3,419 3,631 3,629 3,395 3,188 3,118 3,061 3,055 3,087<br />
Financial activities............................…… 7,178 7,462 7,648 7,687 7,807 7,847 7,977 8,031 8,153 8,363 8,446<br />
Pr<strong>of</strong>essional and business services…… 14,335 15,147 15,957 16,666 16,476 15,976 15,987 16,395 16,954 17,552 17,920<br />
Education and health services………… 14,087 14,446 14,798 15,109 15,645 16,199 16,588 16,953 17,372 17,838 18,377<br />
Leisure and hospitality…………………… 11,018 11,232 11,543 11,862 12,036 11,986 12,173 12,493 12,816 13,143 13,565<br />
Other services…………………………… 4,825 4,976 5,087 5,168 5,258 5,372 5,<strong>401</strong> 5,409 5,395 5,432 5,472<br />
Government…………………………………… 19,664 19,909 20,307 20,790 21,118 21,513 21,583 21,621 21,804 21,990 22,252<br />
Monthly Labor Review • November 2008 103
Current Labor Statistics: Labor Force Data<br />
29. Annual data: Average hours and earnings <strong>of</strong> production or nonsupervisory workers on nonfarm<br />
payrolls, by industry<br />
Industry 1997 1998 1999 2000 2001 2002 2003 2004 2005 2006 2007<br />
Private sector:<br />
Average weekly hours.......……................................. 34.5 34.5 34.3 34.3 34 33.9 33.7 33.7 33.8 33.9 33.8<br />
Average hourly earnings (in dollars)......................... 12.51 13.01 13.49 14.02 14.54 14.97 15.37 15.69 16.13 16.76 17.41<br />
Average weekly earnings (in dollars)........................<br />
Goods-producing:<br />
431.86 448.56 463.15 481.01 493.79 506.72 518.06 529.09 544.33 567.87 589.36<br />
Average weekly hours............................................. 41.1 40.8 40.8 40.7 39.9 39.9 39.8 40 40.1 40.5 40.5<br />
Average hourly earnings (in dollars)....................... 13.82 14.23 14.71 15.27 15.78 16.33 16.8 17.19 17.6 18.02 18.64<br />
Average weekly earnings (in dollars)......................<br />
Natural resources and mining<br />
568.43 580.99 599.99 621.86 630.04 651.61 669.13 688.17 705.31 729.87 755.73<br />
Average weekly hours............................................ 46.2 44.9 44.2 44.4 44.6 43.2 43.6 44.5 45.6 45.6 45.9<br />
Average hourly earnings (in dollars)...................... 15.57 16.2 16.33 16.55 17 17.19 17.56 18.07 18.72 19.9 20.99<br />
Average weekly earnings (in dollars).....................<br />
Construction:<br />
720.11 727.28 721.74 734.92 757.92 741.97 765.94 803.82 853.71 908.01 962.54<br />
Average weekly hours............................................ 38.9 38.8 39 39.2 38.7 38.4 38.4 38.3 38.6 39 38.9<br />
Average hourly earnings (in dollars)...................... 15.67 16.23 16.8 17.48 18 18.52 18.95 19.23 19.46 20.02 20.94<br />
Average weekly earnings (in dollars).....................<br />
Manufacturing:<br />
609.48 629.75 655.11 685.78 695.89 711.82 726.83 735.55 750.22 781.04 814.83<br />
Average weekly hours............................................ 41.7 41.4 41.4 41.3 40.3 40.5 40.4 40.8 40.7 41.1 41.2<br />
Average hourly earnings (in dollars)...................... 13.14 13.45 13.85 14.32 14.76 15.29 15.74 16.15 16.56 16.8 17.23<br />
Average weekly earnings (in dollars).....................<br />
Private service-providing:<br />
548.22 557.12 573.17 590.65 595.19 618.75 635.99 658.59 673.37 690.83 710.51<br />
Average weekly hours..………................................ 32.8 32.8 32.7 32.7 32.5 32.5 32.4 32.3 32.4 32.5 32.4<br />
Average hourly earnings (in dollars)....................... 12.07 12.61 13.09 13.62 14.18 14.59 14.99 15.29 15.74 16.42 17.09<br />
Average weekly earnings (in dollars)......................<br />
Trade, transportation, and utilities:<br />
395.51 413.5 427.98 445.74 461.08 473.8 484.81 494.22 509.58 532.84 554.47<br />
Average weekly hours............................................. 34.3 34.2 33.9 33.8 33.5 33.6 33.6 33.5 33.4 33.4 33.4<br />
Average hourly earnings (in dollars)....................... 11.9 12.39 12.82 13.31 13.7 14.02 14.34 14.58 14.92 15.4 15.82<br />
Average weekly earnings (in dollars)......................<br />
Wholesale trade:<br />
407.57 423.3 434.31 449.88 459.53 471.27 481.14 488.42 498.43 514.61 528.22<br />
Average weekly hours......................................... 38.8 38.6 38.6 38.8 38.4 38 37.9 37.8 37.7 38 38.2<br />
Average hourly earnings (in dollars)................... 14.41 15.07 15.62 16.28 16.77 16.98 17.36 17.65 18.16 18.91 19.56<br />
Average weekly earnings (in dollars)..................<br />
Retail trade:<br />
559.39 582.21 602.77 631.4 643.45 644.38 657.29 667.09 685 718.3 747.7<br />
Average weekly hours......................................... 38.8 38.6 38.6 38.8 38.4 38 37.9 37.8 37.7 38 30.2<br />
Average hourly earnings (in dollars)................... 14.41 15.07 15.62 16.28 16.77 16.98 17.36 17.65 18.16 18.91 12.8<br />
Average weekly earnings (in dollars)..................<br />
Transportation and warehousing:<br />
559.39 582.21 602.77 631.4 643.45 644.38 657.29 667.09 685 718.3 747.7<br />
Average weekly hours......................................... 39.4 38.7 37.6 37.4 36.7 36.8 36.8 37.2 37 36.9 37<br />
Average hourly earnings (in dollars)................... 13.78 14.12 14.55 15.05 15.33 15.76 16.25 16.52 16.7 17.28 17.76<br />
Average weekly earnings (in dollars)..................<br />
Utilities:<br />
542.55 546.86 547.97 562.31 562.7 579.75 598.41 614.82 618.58 637.14 656.95<br />
Average weekly hours......................................... 42 42 42 42 41.4 40.9 41.1 40.9 41.1 41.4 42.4<br />
Average hourly earnings (in dollars)................... 20.59 21.48 22.03 22.75 23.58 23.96 24.77 25.61 26.68 27.42 27.93<br />
Average weekly earnings (in dollars)..................<br />
Information:<br />
865.26 902.94 924.59 955.66 977.18 979.09 1,017.27 1,048.44 1,095.90 1,136.08 1,185.08<br />
Average weekly hours......................................... 36.3 36.6 36.7 36.8 36.9 36.5 36.2 36.3 36.5 36.6 36.4<br />
Average hourly earnings (in dollars)................... 17.14 17.67 18.4 19.07 19.8 20.2 21.01 21.4 22.06 23.23 23.92<br />
Average weekly earnings (in dollars)..................<br />
Financial activities:<br />
622.4 646.52 675.32 700.89 731.11 738.17 760.81 777.05 805 850.81 871.03<br />
Average weekly hours......................................... 35.7 36 35.8 35.9 35.8 35.6 35.5 35.5 35.9 35.8 35.9<br />
Average hourly earnings (in dollars)................... 13.22 13.93 14.47 14.98 15.59 16.17 17.14 17.52 17.94 18.8 19.66<br />
Average weekly earnings (in dollars)..................<br />
Pr<strong>of</strong>essional and business services:<br />
472.37 500.95 517.57 537.37 558.02 575.51 609.08 622.87 645.1 672.4 706.01<br />
Average weekly hours......................................... 34.3 34.3 34.4 34.5 34.2 34.2 34.1 34.2 34.2 34.6 34.8<br />
Average hourly earnings (in dollars)................... 13.57 14.27 14.85 15.52 16.33 16.81 17.21 17.48 18.08 19.12 20.15<br />
Average weekly earnings (in dollars)..................<br />
Education and health services:<br />
465.51 490 510.99 535.07 557.84 574.66 587.02 597.56 618.87 662.23 700.96<br />
Average weekly hours......................................... 32.2 32.2 32.1 32.2 32.3 32.4 32.3 32.4 32.6 32.5 32.6<br />
Average hourly earnings (in dollars)................... 12.56 13 13.44 13.95 14.64 15.21 15.64 16.15 16.71 17.38 18.03<br />
Average weekly earnings (in dollars)..................<br />
Leisure and hospitality:<br />
404.65 418.82 431.35 449.29 473.39 492.74 505.69 523.78 544.59 564.95 587.2<br />
Average weekly hours......................................... 26 26.2 26.1 26.1 25.8 25.8 25.6 25.7 25.7 25.7 25.5<br />
Average hourly earnings (in dollars)................... 7.32 7.67 7.96 8.32 8.57 8.81 9 9.15 9.38 9.75 10.41<br />
Average weekly earnings (in dollars)..................<br />
Other services:<br />
190.52 200.82 208.05 217.2 220.73 227.17 230.42 234.86 241.36 250.11 265.03<br />
Average weekly hours......................................... 32.7 32.6 32.5 32.5 32.3 32 31.4 31 30.9 30.9 30.9<br />
Average hourly earnings (in dollars)................... 11.29 11.79 12.26 12.73 13.27 13.72 13.84 13.98 14.34 14.77 15.22<br />
Average weekly earnings (in dollars).................. 368.63 384.25 398.77 413.41 428.64 439.76 434.41 433.04 443.37 456.6 470.05<br />
NOTE: Data reflect the conversion to the 2002 version <strong>of</strong> the North American Industry Cl<strong>as</strong>sification System (NAICS), replacing the Standard Industrial Cl<strong>as</strong>sification<br />
(SIC) system. NAICS-b<strong>as</strong>ed data by industry are not comparable with SIC-b<strong>as</strong>ed data.<br />
104 Monthly Labor Review • November 2008
������������������������������������������ � ���������������������������������<br />
���������������������<br />
���� ���� ���� ��������������<br />
������ ����� ���� ���� ���� ����� ���� ���� ���� ����� ��������<br />
�����<br />
���������<br />
�����<br />
����������������<br />
����������<br />
� �������������������������������<br />
�������������������������������<br />
����� ����� ����� ����� ����� ����� ����� ����� ����� ��� ���<br />
��������������������������������������������������� ����� ����� ����� ����� ����� ����� ����� ����� ����� ��� ���<br />
���������������������������������������������������� ����� ����� ����� ����� ����� ����� ����� ����� ����� �� ���<br />
����������������������������������������������� ����� ����� ����� ����� ����� ����� ����� ����� ����� ��� ���<br />
���������������������������������������� ����� ����� ����� ����� ����� ����� ����� ����� ����� �� ���<br />
������������������������������������������� ����� ����� ����� ����� ����� ����� ����� ����� ����� ��� ���<br />
���������������������������������������������������� ����� ����� ����� ����� ����� ����� ����� ����� ����� �� ���<br />
��������������������������������������������������������� ����� ����� ����� ����� ����� ����� ����� ����� ����� �� ���<br />
������������������������������������������������� ����� ����� ����� ����� ����� ����� ����� ����� ����� �� ���<br />
������������������������������������������������������� ����� ����� ����� ����� ����� ����� ����� ����� ����� �� ���<br />
��������������������������������������������������������� ����� ����� ����� ����� ����� ����� ����� ����� ����� �� ���<br />
���������������������������������������� ����� ����� ����� ����� ����� ����� ����� ����� ����� �� ���<br />
����������������������������������������������������� ����� ����� ����� ����� ����� ����� ����� ����� ����� �� ���<br />
����������������������������������������� ����� ����� ����� ����� ����� ����� ����� ����� ����� ��� ���<br />
������������������� ��<br />
��������������������������������������� ����� ����� ����� ����� ����� ����� ����� ����� ����� �� ���<br />
����������������������������������������� ����� ����� ����� ����� ����� ����� ����� ����� ����� �� ���<br />
����������������������������������������� ����� ����� ����� ����� ����� ����� ����� ����� ����� �� ���<br />
�������������������������������������������������� ����� ����� ����� ����� ����� ����� ����� ����� ����� ��� ���<br />
������������������������������������������������������� ����� ����� ����� ����� ����� ����� ����� ����� ����� �� ���<br />
��������������������������������������������� ����� ����� ����� ����� ����� ����� ����� ����� ����� �� ���<br />
�������������������������������������������������������������� ����� ����� ����� ����� ����� ����� ����� ����� ����� �� ���<br />
����������������������������������������������� ����� ����� ����� ����� ����� ����� ����� ����� ����� ��� ���<br />
�������������������������������������������������������� ����� ����� ����� ����� ����� ����� ����� ����� ����� ��� ���<br />
������������������������������� � ��������������� ����� ����� ����� ����� ����� ����� ����� ����� ����� ��� ���<br />
��������������������������������������� ����� ����� ����� ����� ����� ����� ����� ����� ����� �� ���<br />
����������������������������� ��<br />
��������������������������������������������������� ����� ����� ����� ����� ����� ����� ����� ����� ����� �� ���<br />
���������������������������������������������������� ����� ����� ����� ����� ����� ����� ����� ����� ����� �� ���<br />
����������������������������������������������� ����� ����� ����� ����� ����� ����� ����� ����� ����� �� ���<br />
���������������������������������������� ����� ����� ����� ����� ����� ����� ����� ����� ����� �� ���<br />
������������������������������������������� ����� ����� ����� ����� ����� ����� ����� ����� ����� ��� ���<br />
���������������������������������������������������� ����� ����� ����� ����� ����� ����� ����� ����� ����� �� ���<br />
��������������������������������������������������������� ����� ����� ����� ����� ����� ����� ����� ����� ����� �� ���<br />
������������������������������������������������� ����� ����� ����� ����� ����� ����� ����� ����� ����� �� ���<br />
������������������������������������������������������� ����� ����� ����� ����� ����� ����� ����� ����� ����� �� ���<br />
��������������������������������������������������������� ����� ����� ����� ����� ����� ����� ����� ����� ����� �� ���<br />
��������������������������������������� ����� ����� ����� ����� ����� ����� ����� ����� ����� �� ���<br />
���������������������������������������������������� ����� ����� ����� ����� ����� ����� ����� ����� ����� �� ���<br />
����������������������������������������� ����� ����� ����� ����� ����� ����� ����� ����� ����� �� ���<br />
������������������������������������������ ��<br />
��������������������������������������������� ����� ����� ����� ����� ����� ����� ����� ����� ����� �� ���<br />
������������������������������������������������������ ����� ����� ����� ����� ����� ����� ����� ����� ����� �� ���<br />
������������������������������������������� ����� ����� ����� ����� ����� ����� ����� ����� ����� �� ���<br />
������������������������������������������������������������ ����� ����� ����� ����� ����� ����� ����� ����� ����� �� ���<br />
������������������������������������������������������������� ����� ����� ����� ����� ����� ����� ����� ����� ����� �� ���<br />
���������������������������������������� ����� ����� ����� ����� ����� ����� ����� ����� ����� �� ���<br />
����������������������������������������� ����� ����� ����� ����� ����� ����� ����� ����� ����� �� ���<br />
�������������������������������������������������������� ����� ����� ����� ����� ����� ����� ����� ����� ����� �� ���<br />
��������������������������������������������� ����� ����� ����� ����� ����� ����� ����� ����� ����� �� ���<br />
�������������������������������������������������������������� ����� ����� ����� ����� ����� ����� ����� ����� ����� �� ���<br />
��������������������������������������������������������������� ����� ����� ����� ����� ����� ����� ����� ����� ����� �� ���<br />
����������������������������������������������� ����� ����� ����� ����� ����� ����� ����� ����� ����� �� ���<br />
������������������������������������������������������ ����� ����� ����� ����� ����� ����� ����� ����� ����� �� ���<br />
������������������������������������������� ����� ����� ����� ����� ����� ����� ����� ����� ����� �� ���<br />
������������������������������������������������������������ ����� ����� ����� ����� ����� ����� ����� ����� ����� �� ���<br />
������������������������������������������������������������� ����� ����� ����� ����� ����� ����� ����� ����� ����� �� ���<br />
�������������������������������������������� ����� ����� ����� ����� ����� ����� ����� ����� ����� �� ���<br />
�������������������������������������������������������<br />
������������������������������<br />
����� ����� ����� ����� ����� ����� ����� ����� ����� �� ���<br />
Monthly Labor Review • November 2008 105
Current Labor Statistics: Compensation & Industrial Relations<br />
��������������������������������������������������� � ���������������������������������<br />
[December 2005 = 100]<br />
106 Monthly Labor Review • November 2008<br />
���� ���� ���� ��������������<br />
������ ����� ���� ���� ���� ����� ���� ���� ���� �����<br />
��������<br />
�����<br />
���������<br />
�����<br />
��������������������������������������������� 102.4 102.9 103.7 104.6 104.2 105.3 105.7 107.2 107.1<br />
����������<br />
-0.1 2.8<br />
�������������������������������������������� 101.9 102.7 102.9 103.9 105.1 106.1 106.6 107.6 108.2 .6 2.9<br />
Transportation and warehousing��������� ����� ����� ����� ����� ����� ����� ����� ����� ����� �� ���<br />
������������������������������������������� 110.1 110.4 102.8 104.7 105.0 105.6 106.5 108.1 108.1 .0 3.0<br />
����������������������������������������� ����� ����� ����� ����� ����� ����� ����� ����� ����� �� ���<br />
����������������������������������������������� 102.1 102.5 104.2 104.6 105.4 105.6 106.8 107.3 107.4 .1 1.9<br />
������������������������������������������������ ����� ����� ����� ����� ����� ����� ����� ����� ����� ��� ���<br />
Real estate and rental and le<strong>as</strong>ing�������� ����� ����� ����� ����� ����� ����� ����� ����� ����� �� ���<br />
������������������������������������������������������ 102.9 103.5 104.7 105.9 106.9 107.5 109.0 109.9 110.8 .8 3.6<br />
��������������������������������������������������� 103.2 104.1 105.1 105.7 106.9 107.7 108.6 109.4 110.3 .8 3.2<br />
������������������������������������������������ 103.2 104.2 104.5 104.9 106.7 107.5 108.1 109.1 111.4 2.1 4.4<br />
�������������������������������������������������������� ����� ����� ����� ����� ����� ����� ����� ����� ����� �� ���<br />
���������������������������������������������� 103.2 103.9 105.0 105.6 106.5 107.3 108.2 109.1 110.1 .9 3.4<br />
Leisure and hospitality�������������� 102.4 103.7 105.3 106.0 107.5 108.1 109.0 109.3 110.6 1.2 2.9<br />
������������������������������������������������������ 102.5 104.0 105.8 106.4 108.1 108.6 109.5 110.0 111.4 1.3 3.1<br />
������������������������������������������������������������� 103.6 104.0 105.7 106.1 107.1 107.6 108.7 109.4 109.9 .5 2.6<br />
�������������������������������������������� 103.2 104.1 105.1 105.7 107.6 108.4 108.9 109.4 111.3 1.7 3.4<br />
Workers by occupational group<br />
Manag����������������������������������������� 103.3 104.0 104.9 105.4 107.5 108.3 108.8 109.3 111.3 1.8 3.5<br />
������������������������������������������������ 103.4 104.0 104.8 105.3 107.5 108.2 108.6 109.1 111.1 1.8 3.3<br />
����������������������������������������� 103.3 104.1 105.6 106.2 107.9 108.6 108.8 109.3 111.0 1.6 2.9<br />
������������������������������������������������������ 103.5 104.2 105.7 106.4 108.2 108.9 109.3 109.8 111.4 1.5 3.0<br />
����������������������������������������� 103.1 104.5 105.4 106.3 108.0 109.1 109.7 110.0 111.9 1.7 3.6<br />
Workers by industry<br />
�������������������������������������������������� 103.7 104.3 104.8 105.3 107.5 108.2 108.6 109.1 111.2 1.9 3.4<br />
���������������������������������������������� ����� ����� ����� ����� ����� ����� ����� ����� ����� ��� ���<br />
������������������������������������������� 103.5 104.1 104.6 104.9 107.4 108.0 108.4 108.8 111.0 2.0 3.4<br />
Elementary and secondary�������������� 103.6 104.2 104.7 105.0 107.4 108.0 108.3 108.8 111.1 2.1 3.4<br />
������������������������������������������������������� 105.1 105.7 107.1 107.6 108.6 109.3 110.1 111.1 112.7 1.4 3.8<br />
��������������������������������������������� 103.3 104.3 105.6 106.3 107.5 108.2 109.2 109.7 110.8 1.0 3.1<br />
Public administration 3 ��������������� 102.4 103.8 105.6 106.6 108.0 109.1 109.7 110.1 111.6 1.4 3.3<br />
1<br />
Cost (cents per hour worked) me<strong>as</strong>ured in the Employment Cost Index consists <strong>of</strong><br />
wages, salaries, and <strong>employer</strong> cost <strong>of</strong> employee benefits.<br />
2<br />
Consists <strong>of</strong> private industry workers (excluding farm and household workers) and<br />
State and local government (excluding Federal Government) workers.<br />
3<br />
Consists <strong>of</strong> legislative, judicial, administrative, and regulatory activities.<br />
NOTE: <strong>The</strong> Employment Cost Index data reflect the conversion to the 2002 North<br />
American Cl<strong>as</strong>sification System (NAICS) and the 2000 Standard Occupational<br />
Cl<strong>as</strong>sification (SOC) system. <strong>The</strong> NAICS and SOC data shown prior to 2006 are for<br />
informational purposes only. Series b<strong>as</strong>ed on NAICS and SOC became the <strong>of</strong>ficial BLS<br />
estimates starting in March 2006.
���������������������������������������������������������������������������������<br />
���������������������<br />
���� ���� ���� ��������������<br />
������ ����� ���� ���� ���� ����� ���� ���� ���� �����<br />
��������<br />
�����<br />
���������<br />
�����<br />
����������������<br />
����������<br />
� �������������������������������<br />
�������������������������������<br />
����� ����� ����� ����� ����� ����� ����� ����� ����� ��� ���<br />
��������������������������������������������������� ����� ����� ����� ����� ����� ����� ����� ����� ����� ��� ���<br />
���������������������������������������������������� ����� ����� ����� ����� ����� ����� ����� ����� ����� �� ���<br />
����������������������������������������������� ����� ����� ����� ����� ����� ����� ����� ����� ����� ��� ���<br />
���������������������������������������� ����� ����� ����� ����� ����� ����� ����� ����� ����� �� ���<br />
������������������������������������������� ����� ����� ����� ����� ����� ����� ����� ����� ����� ��� ���<br />
���������������������������������������������������� ����� ����� ����� ����� ����� ����� ����� ����� ����� �� ���<br />
��������������������������������������������������������� ����� ����� ����� ����� ����� ����� ����� ����� ����� �� ���<br />
������������������������������������������������� ����� ����� ����� ����� ����� ����� ����� ����� ����� �� ���<br />
������������������������������������������������������� ����� ����� ����� ����� ����� ����� ����� ����� ����� �� ���<br />
��������������������������������������������������������� ����� ����� ����� ����� ����� ����� ����� ����� ����� �� ���<br />
���������������������������������������� ����� ����� ����� ����� ����� ����� ����� ����� ����� �� ���<br />
����������������������������������������������������� ����� ����� ����� ����� ����� ����� ����� ����� ����� �� ���<br />
����������������������������������������� ����� ����� ����� ����� ����� ����� ����� ����� ����� ��� ���<br />
������������������� ��<br />
��������������������������������������� ����� ����� ����� ����� ����� ����� ����� ����� ����� �� ���<br />
����������������������������������������� ����� ����� ����� ����� ����� ����� ����� ����� ����� �� ���<br />
����������������������������������������� ����� ����� ����� ����� ����� ����� ����� ����� ����� �� ���<br />
�������������������������������������������������� ����� ����� ����� ����� ����� ����� ����� ����� ����� ��� ���<br />
������������������������������������������������������� ����� ����� ����� ����� ����� ����� ����� ����� ����� �� ���<br />
��������������������������������������������� ����� ����� ����� ����� ����� ����� ����� ����� ����� ��� ���<br />
�������������������������������������������������������������� ����� ����� ����� ����� ����� ����� ����� ����� ����� �� ���<br />
����������������������������������������������� ����� ����� ����� ����� ����� ����� ����� ����� ����� ��� ���<br />
�������������������������������������������������������� ����� ����� ����� ����� ����� ����� ����� ����� ����� ��� ���<br />
������������������������������� � ��������������� ����� ����� ����� ����� ����� ����� ����� ����� ����� ��� ���<br />
��������������������������������������� ����� ����� ����� ����� ����� ����� ����� ����� ����� �� ���<br />
����������������������������� ��<br />
��������������������������������������������������� ����� ����� ����� ����� ����� ����� ����� ����� ����� �� ���<br />
���������������������������������������������������� ����� ����� ����� ����� ����� ����� ����� ����� ����� �� ���<br />
����������������������������������������������� ����� ����� ����� ����� ����� ����� ����� ����� ����� �� ���<br />
���������������������������������������� ����� ����� ����� ����� ����� ����� ����� ����� ����� �� ���<br />
������������������������������������������� ����� ����� ����� ����� ����� ����� ����� ����� ����� ��� ���<br />
���������������������������������������������������� ����� ����� ����� ����� ����� ����� ����� ����� ����� �� ���<br />
��������������������������������������������������������� ����� ����� ����� ����� ����� ����� ����� ����� ����� �� ���<br />
������������������������������������������������� ����� ����� ����� ����� ����� ����� ����� ����� ����� �� ���<br />
������������������������������������������������������� ����� ����� ����� ����� ����� ����� ����� ����� ����� �� ���<br />
��������������������������������������������������������� ����� ����� ����� ����� ����� ����� ����� ����� ����� �� ���<br />
��������������������������������������� ����� ����� ����� ����� ����� ����� ����� ����� ����� �� ���<br />
���������������������������������������������������� ����� ����� ����� ����� ����� ����� ����� ����� ����� �� ���<br />
����������������������������������������� ����� ����� ����� ����� ����� ����� ����� ����� ����� �� ���<br />
������������������������������������������ ��<br />
��������������������������������������������� ����� ����� ����� ����� ����� ����� ����� ����� ����� �� ���<br />
������������������������������������������������������ ����� ����� ����� ����� ����� ����� ����� ����� ����� �� ���<br />
������������������������������������������� ����� ����� ����� ����� ����� ����� ����� ����� ����� �� ���<br />
������������������������������������������������������������ ����� ����� ����� ����� ����� ����� ����� ����� ����� �� ���<br />
������������������������������������������������������������� ����� ����� ����� ����� ����� ����� ����� ����� ����� �� ���<br />
���������������������������������������� ����� ����� ����� ����� ����� ����� ����� ����� ����� �� ���<br />
����������������������������������������� ����� ����� ����� ����� ����� ����� ����� ����� ����� �� ���<br />
�������������������������������������������������������� ����� ����� ����� ����� ����� ����� ����� ����� ����� �� ���<br />
��������������������������������������������� ����� ����� ����� ����� ����� ����� ����� ����� ����� �� ���<br />
�������������������������������������������������������������� ����� ����� ����� ����� ����� ����� ����� ����� ����� �� ���<br />
��������������������������������������������������������������� ����� ����� ����� ����� ����� ����� ����� ����� ����� �� ���<br />
����������������������������������������������� ����� ����� ����� ����� ����� ����� ����� ����� ����� �� ���<br />
������������������������������������������������������ ����� ����� ����� ����� ����� ����� ����� ����� ����� �� ���<br />
������������������������������������������� ����� ����� ����� ����� ����� ����� ����� ����� ����� �� ���<br />
������������������������������������������������������������ ����� ����� ����� ����� ����� ����� ����� ����� ����� �� ���<br />
������������������������������������������������������������� ����� ����� ����� ����� ����� ����� ����� ����� ����� �� ���<br />
�������������������������������������������� ����� ����� ����� ����� ����� ����� ����� ����� ����� �� ���<br />
������������������������������������������������������� ����� ����� ����� ����� ����� ����� ����� ����� ����� �� ���<br />
Monthly Labor Review • November 2008 107
Current Labor Statistics: Compensation & Industrial Relations<br />
������������������������������������������������������������������������������������������<br />
[December 2005 = 100]<br />
108 Monthly Labor Review • November 2008<br />
���� ���� ���� ��������������<br />
������ ����� ���� ���� ���� ����� ���� ���� ���� �����<br />
��������<br />
�����<br />
���������<br />
�����<br />
��������������������������������������������� 102.7 103.0 103.8 104.8 104.0 105.2 105.2 107.2 106.8<br />
����������<br />
-0.4 2.7<br />
�������������������������������������������� 101.9 102.8 103.1 104.2 105.1 106.1 106.4 107.6 108.1 .5 2.9<br />
Transportation and warehousing��������� ����� ����� ����� ����� ����� ����� ����� ����� ����� �� ���<br />
������������������������������������������� 103.0 103.5 104.3 105.5 106.1 106.8 108.0 109.3 109.3 .0 3.0<br />
����������������������������������������� ����� ����� ����� ����� ����� ����� ����� ����� ����� �� ���<br />
����������������������������������������������� 102.5 102.8 104.7 104.9 106.0 105.9 107.2 107.7 107.7 .0 1.6<br />
������������������������������������������������ ����� ����� ����� ����� ����� ����� ����� ����� ����� ��� ���<br />
Real estate and rental and le<strong>as</strong>ing�������� ����� ����� ����� ����� ����� ����� ����� ����� ����� �� ���<br />
������������������������������������������������������ 103.0 103.5 104.8 105.9 106.7 107.5 109.1 110.0 111.0 .9 4.0<br />
��������������������������������������������������� 103.0 104.0 104.8 105.6 106.9 107.7 108.6 109.2 110.2 .9 3.1<br />
������������������������������������������������ 103.1 104.1 104.2 104.6 106.4 107.4 107.9 108.6 110.8 2.0 4.1<br />
�������������������������������������������������������� ����� ����� ����� ����� ����� ����� ����� ����� ����� �� ���<br />
���������������������������������������������� 102.9 103.7 104.6 105.4 106.5 107.2 108.2 109.2 110.3 1.0 3.6<br />
Leisure and hospitality�������������� 102.3 103.7 105.7 106.4 108.1 108.8 109.7 109.9 111.4 1.4 3.1<br />
������������������������������������������������������ 102.2 103.8 106.0 106.5 108.4 109.0 110.0 110.4 111.9 1.4 3.2<br />
������������������������������������������������������������� 103.4 103.8 105.7 106.1 107.3 107.9 109.2 109.9 110.4 .5 2.9<br />
�������������������������������������������� 102.8 103.5 104.1 104.6 106.4 107.1 107.7 108.2 110.1 1.8 3.5<br />
Workers by occupational group<br />
Manag����������������������������������������� 102.9 103.5 104.0 104.3 106.3 107.0 107.6 108.2 110.1 1.8 3.6<br />
������������������������������������������������ 103.0 103.6 103.9 104.2 106.3 107.0 107.5 108.1 110.1 1.9 3.6<br />
����������������������������������������� 102.6 103.2 104.5 104.8 106.3 107.0 107.4 107.9 109.3 1.3 2.8<br />
������������������������������������������������������ 102.7 103.4 104.7 105.0 106.5 107.3 107.8 108.3 109.7 1.3 3.0<br />
����������������������������������������� 102.4 103.9 104.5 105.2 106.5 107.7 108.3 108.6 110.4 1.7 3.7<br />
Workers by industry<br />
�������������������������������������������������� 103.1 103.6 104.0 104.2 106.3 107.1 107.5 108.1 110.2 1.9 3.7<br />
���������������������������������������������� ����� ����� ����� ����� ����� ����� ����� ����� ����� ��� ���<br />
������������������������������������������� 103.0 103.4 103.6 103.9 106.1 106.8 107.2 107.7 109.9 2.0 3.6<br />
Elementary and secondary�������������� 103.0 103.4 103.6 103.8 106.0 106.6 106.9 107.5 109.8 2.1 3.6<br />
������������������������������������������������������� 104.8 105.5 106.6 107.2 108.2 109.2 110.1 111.0 112.8 1.6 4.3<br />
��������������������������������������������� 103.1 104.4 105.7 106.5 107.6 108.6 109.8 110.3 111.4 1.0 3.5<br />
Public administration 2 ��������������� 102.0 103.5 104.5 105.2 106.4 107.4 108.2 108.6 109.9 1.2 3.3<br />
1 Consists <strong>of</strong> private industry workers (excluding farm and household workers) and<br />
State and local government (excluding Federal Government) workers.<br />
2 Consists <strong>of</strong> legislative, judicial, administrative, and regulatory activities.<br />
NOTE: <strong>The</strong> Employment Cost Index data reflect the conversion to the 2002 North<br />
American Cl<strong>as</strong>sification System (NAICS) and the 2000 Standard Occupational<br />
Cl<strong>as</strong>sification (SOC) system. <strong>The</strong> NAICS and SOC data shown prior to 2006 are for<br />
informational purposes only. Series b<strong>as</strong>ed on NAICS and SOC became the <strong>of</strong>ficial<br />
BLS estimates starting in March 2006.
����������������������������������������������������������������������<br />
[December 2005 = 100]<br />
���� ���� ���� ��������������<br />
������ ����� ���� ���� ���� ����� ���� ���� ���� �����<br />
��������<br />
�����<br />
����������<br />
���������<br />
�����<br />
������������������������������������ 102.8 103.6 104.0 105.1 106.1 106.8 107.6 108.1 108.9 0.7 2.6<br />
����������������������������������������<br />
Workers by occupational group<br />
102.5 103.1 103.2 104.3 105.0 105.6 106.5 107.0 107.5 .5 2.4<br />
Manag����������������������������������������� 102.8 103.4 103.8 104.9 105.6 106.0 107.3 107.9 108.5 .6 2.7<br />
���������������������������������������� 102.0 102.9 103.4 104.3 105.2 106.0 106.5 107.0 107.6 .6 2.3<br />
��������������������������������������������������������� 103.5 104.0 103.4 104.8 105.3 105.9 106.5 107.0 107.5 .5 2.1<br />
Production, transportation, and material moving����� 101.6 102.0 101.2 102.4 102.7 103.7 104.4 104.5 104.8 .3 2.0<br />
�����������������������������������������<br />
Workers by industry<br />
103.0 103.6 104.2 105.1 106.0 106.7 107.6 108.5 108.7 .2 2.5<br />
Goods-producing������������������ ����� ����� ����� ����� ����� ����� ����� ����� ����� �� ���<br />
Manufacturing������������������� 100.5 100.8 99.6 101.0 100.7 101.7 102.3 102.2 102.3 .1 1.6<br />
Service-providing������������������ 103.0 103.7 104.1 105.2 106.0 106.6 107.6 108.1 108.7 .6 2.5<br />
�������������������������������������������� 104.1 105.2 107.0 108.0 110.3 111.0 111.4 111.8 113.9 1.9 3.3<br />
NOTE: <strong>The</strong> Employment Cost Index data reflect the conversion to<br />
the 2002 North American Cl<strong>as</strong>sification System (NAICS) and the 2000<br />
Standard Occupational Cl<strong>as</strong>sification (SOC) system. <strong>The</strong> NAICS and<br />
SOC data shown prior<br />
to 2006 are for informational purposes only. Series b<strong>as</strong>ed on NAICS and SOC became the <strong>of</strong>ficial<br />
BLS estimates starting in March 2006.<br />
Monthly Labor Review • November 2008 109
Current Labor Statistics: Compensation & Industrial Relations<br />
33. Employment Cost Index, private industry workers by bargaining status and region<br />
[December 2005 = 100]<br />
110 Monthly Labor Review • November 2008<br />
2006 2007 2008 Percent change<br />
Series Sept. Dec. Mar. June Sept. Dec. Mar. June Sept.<br />
3 months<br />
ended<br />
12 months<br />
ended<br />
Sept. 2008<br />
COMPENSATION<br />
Workers by bargaining status 1<br />
������������������������������ 102.4 103.0 102.7 103.9 104.4 105.1 105.9 106.7 107.4 0.7 2.9<br />
Goods-producing������������������� 101.8 102.2 101.5 102.8 103.1 104.0 104.6 105.6 106.2 .6 3.0<br />
Manufacturing������������������� ����� ����� ���� ����� ����� ����� ����� ����� ����� �� ���<br />
Service-providing������������������� 102.9 103.6 103.7 104.7 105.4 106.0 107.0 107.5 108.3 .7 2.8<br />
������������������������������� 102.6 103.2 104.2 105.1 105.9 106.5 107.5 108.3 108.9 .6 2.8<br />
Goods-producing������������������� 102.0 102.5 103.3 104.2 104.8 105.4 106.5 107.1 107.6 .5 2.7<br />
Manufacturing������������������� ����� ����� ����� ����� ����� ����� ����� ����� ����� �� ���<br />
Service-providing������������������� 102.7 103.4 104.4 105.3 106.2 106.8 107.7 108.6 109.2 .6 2.8<br />
Workers by region 1<br />
�������������������������������� 102.5 103.3 104.0 105.1 106.2 106.8 107.4 108.1 108.7 .6 2.4<br />
������������������������������ 102.8 103.5 104.3 105.3 106.1 106.7 107.8 108.5 109.1 .6 2.8<br />
������������������������������� 102.3 102.8 103.3 104.2 104.6 105.3 106.0 107.0 107.4 .4 2.7<br />
����������������������������� 102.5 103.0 104.2 104.9 105.7 106.5 107.8 108.4 109.3 .8 3.4<br />
WAGES AND SALARIES<br />
Workers by bargaining status 1<br />
������������������������������ 101.7 102.3 102.8 103.7 104.4 104.7 105.5 106.7 107.4 .7 2.9<br />
Goods-producing������������������� 101.9 102.3 102.7 103.6 104.3 104.3 105.2 106.4 107.1 .7 2.7<br />
Manufacturing������������������� ����� ����� ����� ����� ����� ����� ����� ����� ����� �� ���<br />
Service-providing������������������� 101.6 102.2 102.9 103.8 104.6 104.9 105.8 106.9 107.7 .7 3.0<br />
������������������������������� 102.7 103.3 104.5 105.3 106.2 106.9 107.9 108.7 109.4 .6 3.0<br />
Goods-producing������������������� 102.4 103.0 104.2 105.0 105.8 106.4 107.7 108.4 109.0 .6 3.0<br />
Manufacturing������������������� ����� ����� ����� ����� ����� ����� ����� ����� ����� �� ���<br />
Service-providing������������������� 102.7 103.4 104.6 105.4 106.3 107.0 107.9 108.8 109.4 .6 2.9<br />
Workers by region 1<br />
�������������������������������� 102.5 103.1 104.0 105.0 106.1 106.6 107.5 108.2 108.7 .5 2.5<br />
������������������������������ 102.9 103.6 104.6 105.6 106.5 107.0 108.1 109.1 109.8 .6 3.1<br />
������������������������������� 102.0 102.6 103.6 104.4 105.0 105.6 106.3 107.5 107.9 .4 2.8<br />
����������������������������� 102.7 103.2 104.8 105.4 106.2 107.0 108.3 108.9 109.9 .9 3.5<br />
1 <strong>The</strong> indexes are calculated differently from those for the<br />
occupation and industry groups. For a detailed description <strong>of</strong><br />
the index calculation, see the Monthly Labor Review Technical<br />
Note, "Estimation procedures for the Employment Cost Index,"<br />
May 1982.<br />
NOTE: <strong>The</strong> Employment Cost Index data reflect the conversion to the 2002 North American<br />
Cl<strong>as</strong>sification System (NAICS) and the 2000 Standard Occupational Cl<strong>as</strong>sification (SOC) system. <strong>The</strong><br />
NAICS and SOC data shown prior to 2006 are for informational purposes only. Series b<strong>as</strong>ed on NAICS<br />
and SOC became the <strong>of</strong>ficial BLS estimates starting in March 2006.
�������������������������������������������������������������������������������<br />
�������������������������������������������������������������<br />
Series<br />
Year<br />
2003 2004 2005 2006 2007 1<br />
All retirement<br />
Percentage <strong>of</strong> workers with access<br />
All workers……………………………………………………… 57 59 60 60 61<br />
White-collar occupations 2 …………………………………… 67 69 70 69 -<br />
Management, pr<strong>of</strong>essional, and related ………………. - - - - 76<br />
Sales and <strong>of</strong>fice …………………………………………… - - - - 64<br />
Blue-collar occupations 2 ……………………………………… 59 59 60 62 -<br />
Natural resources, construction, and maintenance...… - - - - 61<br />
Production, transportation, and material moving…...… - - - - 65<br />
Service occupations…………………………………………… 28 31 32 34 36<br />
Full-time………………………………………………………… 67 68 69 69 70<br />
Part-time……………………………………………………… 24 27 27 29 31<br />
Union…………………………………………………………… 86 84 88 84 84<br />
Non-union……………………………………………………… 54 56 56 57 58<br />
Average wage less than $15 per hour……...……………… 45 46 46 47 47<br />
Average wage $15 per hour or higher……...……………… 76 77 78 77 76<br />
Goods-producing industries………………………………… 70 70 71 73 70<br />
Service-providing industries………………………………… 53 55 56 56 58<br />
Establishments with 1-99 workers…………………………… 42 44 44 44 45<br />
Establishments with 100 or more workers………………… 75 77 78 78 78<br />
Percentage <strong>of</strong> workers participating<br />
All workers……………………………………………………… 49 50 50 51 51<br />
White-collar occupations 2 …………………………………… 59 61 61 60 -<br />
Management, pr<strong>of</strong>essional, and related ………………. - - - - 69<br />
Sales and <strong>of</strong>fice …………………………………………… - - - - 54<br />
Blue-collar occupations 2 ……………………………………… 50 50 51 52 -<br />
Natural resources, construction, and maintenance…... - - - - 51<br />
Production, transportation, and material moving…...… - - - - 54<br />
Service occupations…………………………………………… 21 22 22 24 25<br />
Full-time………………………………………………………… 58 60 60 60 60<br />
Part-time……………………………………………………… 18 20 19 21 23<br />
Union…………………………………………………………… 83 81 85 80 81<br />
Non-union……………………………………………………… 45 47 46 47 47<br />
Average wage less than $15 per hour……...……………… 35 36 35 36 36<br />
Average wage $15 per hour or higher……...……………… 70 71 71 70 69<br />
Goods-producing industries………………………………… 63 63 64 64 61<br />
Service-providing industries………………………………… 45 47 47 47 48<br />
Establishments with 1-99 workers…………………………… 35 37 37 37 37<br />
Establishments with 100 or more workers………………… 65 67 67 67 66<br />
Take-up rate (all workers) 3 …………………………………… - - 85 85 84<br />
Defined Benefit<br />
Percentage <strong>of</strong> workers with access<br />
All workers……………………………………………………… 20 21 22 21 21<br />
White-collar occupations 2 …………………………………… 23 24 25 23 -<br />
Management, pr<strong>of</strong>essional, and related ………………. - - - - 29<br />
Sales and <strong>of</strong>fice …………………………………………… - - - - 19<br />
Blue-collar occupations 2 ……………………………………… 24 26 26 25 -<br />
Natural resources, construction, and maintenance...… - - - - 26<br />
Production, transportation, and material moving…...… - - - - 26<br />
Service occupations…………………………………………… 8 6 7 8 8<br />
Full-time………………………………………………………… 24 25 25 24 24<br />
Part-time……………………………………………………… 8 9 10 9 10<br />
Union…………………………………………………………… 74 70 73 70 69<br />
Non-union……………………………………………………… 15 16 16 15 15<br />
Average wage less than $15 per hour……...……………… 12 11 12 11 11<br />
Average wage $15 per hour or higher……...……………… 34 35 35 34 33<br />
Goods-producing industries………………………………… 31 32 33 32 29<br />
Service-providing industries………………………………… 17 18 19 18 19<br />
Establishments with 1-99 workers…………………………… 9 9 10 9 9<br />
Establishments with 100 or more workers…………………<br />
See footnotes at end <strong>of</strong> table.<br />
34 35 37 35 34<br />
Monthly Labor Review • November 2008 111
Current Labor Statistics: Compensation & Industrial Relations<br />
��������������������������������������������������������������������������������������<br />
����������������������������������������������������������������<br />
Series<br />
112 Monthly Labor Review • November 2008<br />
2003 2004 2005 2006 2007 1<br />
Percentage <strong>of</strong> workers participating<br />
All workers……………………………………………………… 20 21 21 20 20<br />
White-collar occupations 2 …………………………………… 22 24 24 22 -<br />
Management, pr<strong>of</strong>essional, and related ………………. - - - - 28<br />
Sales and <strong>of</strong>fice …………………………………………… - - - - 17<br />
Blue-collar occupations 2 …………………………………… 24 25 26 25 -<br />
Natural resources, construction, and maintenance...… - - - - 25<br />
Production, transportation, and material moving…...… - - - - 25<br />
Service occupations………………………………………… 7 6 7 7 7<br />
Full-time……………………………………………………… 24 24 25 23 23<br />
Part-time……………………………………………………… 8 9 9 8 9<br />
Union…………………………………………………………… 72 69 72 68 67<br />
Non-union……………………………………………………… 15 15 15 14 15<br />
Average wage less than $15 per hour……...……………… 11 11 11 10 10<br />
Average wage $15 per hour or higher……...……………… 33 35 34 33 32<br />
Goods-producing industries………………………………… 31 31 32 31 28<br />
Service-providing industries………………………………… 16 18 18 17 18<br />
Establishments with 1-99 workers………………………… 8 9 9 9 9<br />
Establishments with 100 or more workers………………… 33 34 36 33 32<br />
Take-up rate (all workers) 3 …………………………………… - - 97 96 95<br />
Defined Contribution<br />
Percentage <strong>of</strong> workers with access<br />
All workers……………………………………………………… 51 53 53 54 55<br />
White-collar occupations 2 …………………………………… 62 64 64 65 -<br />
Management, pr<strong>of</strong>essional, and related ………………. - - - - 71<br />
Sales and <strong>of</strong>fice …………………………………………… - - - - 60<br />
Blue-collar occupations 2 …………………………………… 49 49 50 53 -<br />
Natural resources, construction, and maintenance...… - - - - 51<br />
Production, transportation, and material moving…...… - - - - 56<br />
Service occupations………………………………………… 23 27 28 30 32<br />
Full-time……………………………………………………… 60 62 62 63 64<br />
Part-time……………………………………………………… 21 23 23 25 27<br />
Union…………………………………………………………… 45 48 49 50 49<br />
Non-union……………………………………………………… 51 53 54 55 56<br />
Average wage less than $15 per hour……...……………… 40 41 41 43 44<br />
Average wage $15 per hour or higher……...……………… 67 68 69 69 69<br />
Goods-producing industries………………………………… 60 60 61 63 62<br />
Service-providing industries………………………………… 48 50 51 52 53<br />
Establishments with 1-99 workers………………………… 38 40 40 41 42<br />
Establishments with 100 or more workers………………… 65 68 69 70 70<br />
Percentage <strong>of</strong> workers participating<br />
All workers……………………………………………………… 40 42 42 43 43<br />
White-collar occupations 2 …………………………………… 51 53 53 53 -<br />
Management, pr<strong>of</strong>essional, and related ………………. - - - - 60<br />
Sales and <strong>of</strong>fice …………………………………………… - - - - 47<br />
Blue-collar occupations 2 …………………………………… 38 38 38 40 -<br />
Natural resources, construction, and maintenance...… - - - - 40<br />
Production, transportation, and material moving…...… - - - - 41<br />
Service occupations………………………………………… 16 18 18 20 20<br />
Full-time……………………………………………………… 48 50 50 51 50<br />
Part-time……………………………………………………… 14 14 14 16 18<br />
Union…………………………………………………………… 39 42 43 44 41<br />
Non-union……………………………………………………… 40 42 41 43 43<br />
Average wage less than $15 per hour……...……………… 29 30 29 31 30<br />
Average wage $15 per hour or higher……...……………… 57 59 59 58 57<br />
Goods-producing industries………………………………… 49 49 50 51 49<br />
Service-providing industries………………………………… 37 40 39 40 41<br />
Establishments with 1-99 workers………………………… 31 32 32 33 33<br />
Establishments with 100 or more workers………………… 51 53 53 54 53<br />
Take-up rate (all workers) 3 ……………………………………<br />
See footnotes at end <strong>of</strong> table.<br />
- - 78 79 77<br />
Year
��������������������������������������������������������������������������������������<br />
����������������������������������������������������������������<br />
Series<br />
2003 2004 2005 2006 2007 1<br />
Employee Contribution Requirement<br />
Employee contribution required………………………… - - 61 61 65<br />
Employee contribution not required……………………… - - 31 33 35<br />
Not determinable…………………………………………… - - 8 6 0<br />
Percent <strong>of</strong> establishments<br />
Offering retirement plans…………………………………… 47 48 51 48 46<br />
Offering defined benefit plans……………………………… 10 10 11 10 10<br />
Offering defined contribution plans………………………. 45 46 48 47 44<br />
1 <strong>The</strong> 2002 North American Industry Cl<strong>as</strong>sification System (NAICS) replaced the 1987 Standard Industrial Cl<strong>as</strong>sification (SIC)<br />
System. Estimates for goods-producing and service-providing (formerly service-producing) industries are considered comparable.<br />
Also introduced w<strong>as</strong> the 2000 Standard Occupational Cl<strong>as</strong>sification (SOC) to replace the 1990 Census <strong>of</strong> Population system.<br />
Only service occupations are considered comparable.<br />
2 <strong>The</strong> white-collar and blue-collar occupation series were discontinued effective 2007.<br />
Year<br />
3 <strong>The</strong> take-up rate is an estimate <strong>of</strong> the percentage <strong>of</strong> workers with access to a plan who participate in the plan.<br />
Note: Where applicable, d<strong>as</strong>hes indicate no employees in this category or data do not meet publication criteria.<br />
Monthly Labor Review • November 2008 113
Current Labor Statistics: Compensation & Industrial Relations<br />
���������������������������������������������������������������������������������<br />
��������������������������������������������������������<br />
2003 2004 2005 2006 2007 1<br />
Medical insurance<br />
Percentage <strong>of</strong> workers with access<br />
All workers………………………………………………………………………… 60 69 70 71 71<br />
White-collar occupations 2 ……………………………………………………… 65 76 77 77 -<br />
Management, pr<strong>of</strong>essional, and related ………………………………… - - - - 85<br />
Sales and <strong>of</strong>fice……………………………………………………………… - - - - 71<br />
Blue-collar occupations 2 Series<br />
Year<br />
……………………………………………………… 64 76 77 77 -<br />
Natural resources, construction, and maintenance……………………… - - - - 76<br />
Production, transportation, and material moving………………………… - - - - 78<br />
Service occupations…………………………………………………………… 38 42 44 45 46<br />
Full-time………………………………………………………………………… 73 84 85 85 85<br />
Part-time………………………………………………………………………… 17 20 22 22 24<br />
Union……………………………………………………………………………… 67 89 92 89 88<br />
Non-union………………………………………………………………………… 59 67 68 68 69<br />
Average wage less than $15 per hour………………………………………… 51 57 58 57 57<br />
Average wage $15 per hour or higher………………………………………… 74 86 87 88 87<br />
Goods-producing industries…………………………………………………… 68 83 85 86 85<br />
Service-providing industries…………………………………………………… 57 65 66 66 67<br />
Establishments with 1-99 workers……………………………………………… 49 58 59 59 59<br />
Establishments with 100 or more workers…………………………………… 72 82 84 84 84<br />
Percentage <strong>of</strong> workers participating<br />
All workers………………………………………………………………………… 45 53 53 52 52<br />
White-collar occupations 2 ……………………………………………………… 50 59 58 57 -<br />
Management, pr<strong>of</strong>essional, and related ………………………………… - - - - 67<br />
Sales and <strong>of</strong>fice……………………………………………………………… - - - - 48<br />
Blue-collar occupations 2 ……………………………………………………… 51 60 61 60 -<br />
Natural resources, construction, and maintenance……………………… - - - - 61<br />
Production, transportation, and material moving………………………… - - - - 60<br />
Service occupations…………………………………………………………… 22 24 27 27 28<br />
Full-time………………………………………………………………………… 56 66 66 64 64<br />
Part-time………………………………………………………………………… 9 11 12 13 12<br />
Union……………………………………………………………………………… 60 81 83 80 78<br />
Non-union………………………………………………………………………… 44 50 49 49 49<br />
Average wage less than $15 per hour………………………………………… 35 40 39 38 37<br />
Average wage $15 per hour or higher………………………………………… 61 71 72 71 70<br />
Goods-producing industries…………………………………………………… 57 69 70 70 68<br />
Service-providing industries…………………………………………………… 42 48 48 47 47<br />
Establishments with 1-99 workers……………………………………………… 36 43 43 43 42<br />
Establishments with 100 or more workers…………………………………… 55 64 65 63 62<br />
Take-up rate (all workers) 3 ……………………………………………………… - - 75 74 73<br />
Dental<br />
Percentage <strong>of</strong> workers with access<br />
All workers………………………………………………………………………… 40 46 46 46 46<br />
White-collar occupations 2 ……………………………………………………… 47 53 54 53 -<br />
Management, pr<strong>of</strong>essional, and related ………………………………… - - - - 62<br />
Sales and <strong>of</strong>fice……………………………………………………………… - - - - 47<br />
Blue-collar occupations 2 ……………………………………………………… 40 47 47 46 -<br />
Natural resources, construction, and maintenance……………………… - - - - 43<br />
Production, transportation, and material moving………………………… - - - - 49<br />
Service occupations…………………………………………………………… 22 25 25 27 28<br />
Full-time………………………………………………………………………… 49 56 56 55 56<br />
Part-time………………………………………………………………………… 9 13 14 15 16<br />
Union……………………………………………………………………………… 57 73 73 69 68<br />
Non-union………………………………………………………………………… 38 43 43 43 44<br />
Average wage less than $15 per hour………………………………………… 30 34 34 34 34<br />
Average wage $15 per hour or higher………………………………………… 55 63 62 62 61<br />
Goods-producing industries…………………………………………………… 48 56 56 56 54<br />
Service-providing industries…………………………………………………… 37 43 43 43 44<br />
Establishments with 1-99 workers……………………………………………… 27 31 31 31 30<br />
Establishments with 100 or more workers……………………………………<br />
See footnotes at end <strong>of</strong> table.<br />
55 64 65 64 64<br />
114 Monthly Labor Review • November 2008
35. Continued—National Compensation Survey: Health insurance benefits in<br />
private industry by access, particpation, and selected series, 2003-2007<br />
Series<br />
2003 2004 2005 2006 2007 1<br />
Percentage <strong>of</strong> workers participating<br />
All workers…………………………………………………………………………… 32 37 36 36 36<br />
White-collar occupations 2 ……………………………………………………… 37 43 42 41 -<br />
Management, pr<strong>of</strong>essional, and related …………………………………… - - - - 51<br />
Sales and <strong>of</strong>fice………………………………………………………………… - - - - 33<br />
Blue-collar occupations 2 ………………………………………………………… 33 40 39 38 -<br />
Natural resources, construction, and maintenance………………………… - - - - 36<br />
Production, transportation, and material moving…………………………… - - - - 38<br />
Service occupations……………………………………………………………… 15 16 17 18 20<br />
Full-time…………………………………………………………………………… 40 46 45 44 44<br />
Part-time…………………………………………………………………………… 6 8 9 10 9<br />
Union……………………………………………………………………………… 51 68 67 63 62<br />
Non-union………………………………………………………………………… 30 33 33 33 33<br />
Average wage less than $15 per hour………………………………………… 22 26 24 23 23<br />
Average wage $15 per hour or higher………………………………………… 47 53 52 52 51<br />
Goods-producing industries……………………………………………………… 42 49 49 49 45<br />
Service-providing industries……………………………………………………… 29 33 33 32 33<br />
Establishments with 1-99 workers……………………………………………… 21 24 24 24 24<br />
Establishments with 100 or more workers……………………………………… 44 52 51 50 49<br />
Take-up rate (all workers) 3 ………………………………………………………… - - 78 78 77<br />
Vision care<br />
Percentage <strong>of</strong> workers with access……………………………………………… 25 29 29 29 29<br />
Percentage <strong>of</strong> workers participating……………………………………………… 19 22 22 22 22<br />
Outpatient Prescription drug coverage<br />
Percentage <strong>of</strong> workers with access……………………………………………… - - 64 67 68<br />
Percentage <strong>of</strong> workers participating……………………………………………… - - 48 49 49<br />
Percent <strong>of</strong> estalishments <strong>of</strong>fering healthcare benefits …………………......… 58 61 63 62 60<br />
Percentage <strong>of</strong> medical premium paid by<br />
Employer and Employee<br />
Single coverage<br />
Employer share…………………………………………………………………… 82 82 82 82 81<br />
Employee share…………………………………………………………………<br />
Family coverage<br />
18 18 18 18 19<br />
Employer share…………………………………………………………………… 70 69 71 70 71<br />
Employee share………………………………………………………………… 30 31 29 30 29<br />
1 <strong>The</strong> 2002 North American Industry Cl<strong>as</strong>sification System (NAICS) replaced the 1987 Standard Industrial Cl<strong>as</strong>sification (SIC)<br />
System. Estimates for goods-producing and service-providing (formerly service-producing) industries are considered comparable.<br />
Also introduced w<strong>as</strong> the 2000 Standard Occupational Cl<strong>as</strong>sification (SOC) to replace the 1990 Census <strong>of</strong> Population system.<br />
Only service occupations are considered comparable.<br />
2 <strong>The</strong> white-collar and blue-collar occupation series were discontinued effective 2007.<br />
3 <strong>The</strong> take-up rate is an estimate <strong>of</strong> the percentage <strong>of</strong> workers with access to a plan who participate in the plan.<br />
Note: Where applicable, d<strong>as</strong>hes indicate no employees in this category or data do not meet publication criteria.<br />
Year<br />
Monthly Labor Review • November 2008 115
Current Labor Statistics: Compensation & Industrial Relations<br />
������������������������������������������������������������������������<br />
��������������������������������������������<br />
Benefit<br />
116 Monthly Labor Review • November 2008<br />
2003 2004 2005 2006 2007<br />
Life insurance…………………………………………………… 50 51 52 52 58<br />
Short-term disabilty insurance………………………………… 39 39 40 39 39<br />
Long-term disability insurance………………………………… 30 30 30 30 31<br />
Long-term care insurance……………………………………… 11 11 11 12 12<br />
Flexible work place………………………………………………<br />
Section 125 cafeteria benefits<br />
4 4 4 4 5<br />
Flexible benefits……………………………………………… - - 17 17 17<br />
Dependent care reimbursement account…………..……… - - 29 30 31<br />
Healthcare reimbursement account……………………...… - - 31 32 33<br />
Health Savings Account………………………………...……… - - 5 6 8<br />
Employee <strong>as</strong>sistance program……………………….…………<br />
Paid leave<br />
- - 40 40 42<br />
Holidays…………………………………………...…………… 79 77 77 76 77<br />
Vacations……………………………………………..……… 79 77 77 77 77<br />
Sick leave………………………………………..…………… - 59 58 57 57<br />
Personal leave…………………………………………..……<br />
Family leave<br />
- - 36 37 38<br />
Paid family leave…………………………………………….… - - 7 8 8<br />
Unpaid family leave………………………………………..… - - 81 82 83<br />
Employer <strong>as</strong>sistance for child care…………………….……… 18 14 14 15 15<br />
Nonproduction bonuses………………………...……………… 49 47 47 46 47<br />
Note: Where applicable, d<strong>as</strong>hes indicate no employees in this category or data do not<br />
meet publication criteria.<br />
���������������������������������������������������<br />
Me<strong>as</strong>ure<br />
2007 2008<br />
2006 2007 Sept. Oct. Nov. Dec. Jan. Feb. Mar. Apr. May June July Aug. Sept. p<br />
Annual average<br />
Number <strong>of</strong> stoppages:<br />
Beginning in period............................. 20 21 5 3 1 2 0 2 2 1 2 2 1 2 2<br />
In effect during period…......................<br />
Workers involved:<br />
23 23 6 3 2 4 1 3 4 2 4 2 1 2 2<br />
Beginning in period (in thousands)….. 70.1 189.2 108.3 41.7 10.5 6.5 0.0 6.2 5.7 2.3 3.4 4.2 8.5 7.0 28.2<br />
In effect during period (in thousands)…<br />
Days idle:<br />
191.0 220.9 108.3 41.7 14.2 20.7 10.5 16.7 11.9 6.0 9.4 4.2 8.5 7.0 28.2<br />
Number (in thousands)….................... 2,687.5 1,264.8 261.5 73.9 284.0 254.8 220.5 148.8 140.9 104.4 125.0 12.3 42.5 102.4 469.8<br />
Percent <strong>of</strong> estimated working time 1 …… 0.01 0.01 0.01 0 0.01 0.01 0.01 0.01 0 0 0 0 0 0 0.02<br />
1 Agricultural and government employees are included in the total employed<br />
and total working time; private household, forestry, and fishery employees are<br />
excluded. An explanation <strong>of</strong> the me<strong>as</strong>urement <strong>of</strong> idleness <strong>as</strong> a percentage <strong>of</strong><br />
the total time<br />
Year<br />
worked is found in "Total economy me<strong>as</strong>ures <strong>of</strong> strike idleness," Monthly Labor Review ,<br />
October 1968, pp. 54–56.<br />
NOTE: p = preliminary.
38. Consumer Price Indexes for All Urban Consumers and for Urban Wage Earners and Clerical Workers:<br />
U.S. city average, by expenditure category and commodity or service group<br />
�������������������������������������������<br />
CONSUMER PRICE INDEX<br />
FOR ALL URBAN CONSUMERS<br />
2006 2007 Sept.<br />
2007<br />
Oct. Nov. Dec. Jan. Feb. Mar. Apr.<br />
2008<br />
May June July Aug. Sept.<br />
A����������������������������������������������������������������������������������� ����� ������� ������� ������� ������� ������� ������� ������� ������� ������� ������� ������� ������� ������� �������<br />
A��������������������������������������������������������������������������� ����� ������� ������� ������� ������� ������� ������� ������� ������� ������� ������� ������� ������� ������� �������<br />
�������������������������������������������������������������������������� ����� ������� ������� ������� ������� ������� ������� ������� ������� ������� ������� ������� ������� ������� �������<br />
���������������������������������������������������������������������������������� ����� ������� ������� ������� ������� ������� ������� ������� ������� ������� ������� ������� ������� ������� �������<br />
���������������������������������������������������������������������������� ����� ������� ������� ������� ������� ������� ������� ������� ������� ������� ������� ������� ������� ������� �������<br />
������������������������������������������������������������������� ����� ������� ������� ������� ������� ������� ������� ������� ������� ������� ������� ������� ������� ������� �������<br />
��������������������������������������������������������������������� ����� ������� ������� ������� ������� ������� ������� ������� ������� ������� ������� ������� ������� ������� �������<br />
��������������������������������� 1 �������������� ����� ������� ������� ������� ������� ������� ������� ������� ������� ������� ������� ������� ������� ������� �������<br />
�������������������������������������������������������������������������<br />
������������������������������������������<br />
����� ������� ������� ������� ������� ������� ������� ������� ������� ������� ������� ������� ������� ������� �������<br />
��������������������������������������������������������������������������������� ����� ������� ������� ������� ������� ������� ������� ������� ������� ������� ������� ������� ������� ������� �������<br />
������������������������������������������������������������������������� ����� ������� ������� ������� ������� ������� ������� ������� ������� ������� ������� ������� ������� ������� �������<br />
�������������������������������������������������������������������������� ����� ������� ������� ������� ������� ������� ������� ������� ������� ������� ������� ������� ������� ������� �������<br />
������������������������������������������������������������������������������� ����� ������� ������� ������� ������� ������� ������� ������� ������� ������� ������� ������� ������� ������� �������<br />
������������������������������������������������������������������������������� ����� ������� ������� ������� ������� ������� ������� ������� ������� ������� ������� ������� ������� ������� �������<br />
������������������������������������� ��� ����������� ����� ������� ������� ������� ������� ������� ������� ������� ������� ������� ������� ������� ������� ������� �������<br />
������������������������ 1 ����������������� ����� ������� ������� ������� ������� ������� ������� ������� ������� ������� ������� ������� ������� ������� �������<br />
��������������������������������� ��� ������������ ����� ������� ������� ������� ������� ������� ������� ������� ������� ������� ������� ������� ������� ������� �������<br />
������������������������������������������������������������������������� ����� ������� ������� ������� ������� ������� ������� ������� ������� ������� ������� ������� ������� ������� �������<br />
����������������������������������������������������������������������������������� ����� ������� ������� ������� ������� ������� ������� ������� ������� ������� ������� ������� ������� ������� �������<br />
���������������������������������������������������������������������������������� ����� ������� ������� ������� ������� ������� ������� ������� ������� ������� ������� ������� ������� ������� �������<br />
���������������������������������������������������������������������� ����� ������� ������� ������� ������� ������� ������� ������� ������� ������� ������� ������� ������� ������� �������<br />
����������������������������������������� ����� ������� ������� ������� ������� ������� ������� ������� ������� ������� ������� ������� ������� ������� �������<br />
����������������������������������������������������<br />
� ���� ����� ������� ������� ������� ������� ������� ������� ������� ������� ������� ������� ������� ������� ������� �������<br />
���������������������������������������� ��� ��������� ����� ������� ������� ������� ������� ������� ������� ������� ������� ������� ������� ������� ������� ������� �������<br />
������������������������������������������������������������������������������ ����� ������� ������� ������� ������� ������� ������� ������� ������� ������� ������� ������� ������� ������� �������<br />
����������������������������������������������������������������������������������� ����� ������� ������� ������� ������� ������� ������� ������� ������� ������� ������� ������� ������� ������� �������<br />
�������������������������������������������������������������������������� ����� ������� ������� ������� ������� ������� ������� ������� ������� ������� ������� ������� ������� ������� �������<br />
������������������������������������������������������������������������ ����� ������� ������� ������� ������� ������� ������� ������� ������� ������� ������� ������� ������� ������� �������<br />
�������������������������������������������������������������� ����� ������� ������� ������� ������� ������� ������� ������� ������� ������� ������� ������� ������� ������� �������<br />
������������������������������������������������������������������������������������ ����� ������� ������� ������� ������� ������� ������� ������� ������� ������� ������� ������� ������� ������� �������<br />
����������������������������������������������������������������������� ����� ������� ������� ������� ������� ������� ������� ������� ������� ������� ������� ������� ������� ������� �������<br />
��������������������������������������������������������������������� ����� ������� ������� ������� ������� ������� ������� ������� ������� ������� ������� ������� ������� ������� �������<br />
�������������������������������������� 1 ������������� ����� ������� ������� ������� ������� ������� ������� ������� ������� ������� ������� ������� ������� ������� �������<br />
������������������������������������������������������������������������������� ����� ������� ������� ������� ������� ������� ������� ������� ������� ������� ������� ������� ������� ������� �������<br />
�������������������������������������������������������������������������������� ����� ������� ������� ������� ������� ������� ������� ������� ������� ������� ������� ������� ������� ������� �������<br />
�������������������������������������������������������������������������� ����� ������� ������� ������� ������� ������� ������� ������� ������� ������� ������� ������� ������� ������� �������<br />
����������������������������������� 2 ������������ ���� ������ ������ ������ ������ ������ ������ ������ ������ ������ ������ ������ ������ ������ ������<br />
����������������������������������������������������������������������������� ����� ������� ������� ������� ������� ������� ������� ������� ������� ������� ������� ������� ������� ������� �������<br />
������������������������������ 1 ���������������� ����� ������� ������� ������� ������� ������� ������� ������� ������� ������� ������� ������� ������� ������� �������<br />
�������������������������������������������������������������������������������� ����� ������� ������� ������� ������� ������� ������� ������� ������� ������� ������� ������� ������� ������� �������<br />
���������������������������������������������������������������������������� ����� ������� ������� ������� ������� ������� ������� ������� ������� ������� ������� ������� ������� ������� �������<br />
���������������������������������������������������������������� ����� ������� ������� ������� ������� ������� ������� ������� ������� ������� ������� ������� ������� ������� �������<br />
�������������������������������������������������������������� ����� ������� ������� ������� ������� ������� ������� ������� ������� ������� ������� ������� ������� ������� �������<br />
��������������������������������������������������������������������������� ����� ������� ������� ������� ������� ������� ������� ������� ������� ������� ������� ������� ������� ������� �������<br />
��������������������������������������������������������������������������������� ����� ������� ������� ������� ������� ������� ������� ������� ������� ������� ������� ������� ������� ������� �������<br />
��������������������������������������������������������������������� ����� ������� ������� ������� ������� ������� ������� ������� ������� ������� ������� ������� ������� ������� �������<br />
������������������������������������������������������������������������� ����� ������� ������� ������� ������� ������� ������� ������� ������� ������� ������� ������� ������� ������� �������<br />
������������������������������������������������������������������������� ����� ������� ������� ������� ������� ������� ������� ������� ������� ������� ������� ������� ������� ������� �������<br />
��������������������������������������������������������������������� ����� ������� ������� ������� ������� ������� ������� ������� ������� ������� ������� ������� ������� ������� �������<br />
������������� 2 ������������������������ ����� ������� ������� ������� ������� ������� ������� ������� ������� ������� ������� ������� ������� ������� �������<br />
����������� ��� ����� ��� ������������������� ����� ������� ������� ������� ������� ������� ������� ������� ������� ������� ������� ������� ������� ������� �������<br />
������������ ��� ������������� 2 ������������� ����� ������� ������� ������� ������� ������� ������� ������� ������� ������� ������� ������� ������� ������� �������<br />
���������������� 2 ������������������������ ����� ������� ������� ������� ������� ������� ������� ������� ������� ������� ������� ������� ������� ������� �������<br />
������������������������������������������������������������������ ����� ������� ������� ������� ������� ������� ������� ������� ������� ������� ������� ������� ������� ������� �������<br />
���������������������������������������������������������������� ����� ������� ������� ������� ������� ������� ������� ������� ������� ������� ������� ������� ������� ������� �������<br />
������������� ��� ������������������� ���� ������ ������ ������ ������ ������ ������ ������ ������ ������ ������ ������ ������ ������ ������<br />
����������������������������������������������� ��� ������ ���� ������ ������ ������ ������ ������ ������ ������ ������ ������ ������ ������ ������ ������ ������<br />
������������������������������ ��� ���������������<br />
��������������������������������������������������<br />
���� ������ ������ ������ ������ ������ ������ ������ ������ ������ ������ ������� ������� ������� �������<br />
������������������������������������������� ��� ���������<br />
��������������������������������������������������<br />
���� ������ ������ ������ ������ ������ ������ ������ ������ ������ ������ ������ ������ ������ �����<br />
���������������������������� ��� ������������������ ����� ������� ������� ������� ������� ������� ������� ������� ������� ������ ������ ������ ������ ������ ������<br />
������������������������������������������������������������������������ ����� ������� ������� ������� ������� ������� ������� ������� ������� ������� ������� ������� ������� ������� �������<br />
���������������������������������������������������������������� ����� ������� ������� ������� ������� ������� ������� ������� ������� ������� ������� ������� ������� ������� �������<br />
������������������� 1 ���������������������� ����� ������� ������� ������� ������� ������� ������� ������� ������� ������� ������� ������� ������� ������� �������<br />
������������������������������ 1 ��������������� ����� ������� ������� ������� ������� ������� ������� ������� ������� ������� ������� ������� ������� ������� �������<br />
������������������������������� 1 Series<br />
Annual average<br />
���������������<br />
������������������������������<br />
����� ������� ������� ������� ������� ������� ������� ������� ������� ������� ������� ������� ������� ������� �������<br />
Monthly Labor Review • November 2008 117
Current Labor Statistics: Price Data<br />
��������������������������������������������������������������������������������������������������������������<br />
����������������������������������������������������������������������������������<br />
�������������������������������������������<br />
��������������<br />
2007 2008<br />
������<br />
���� ���� ����� ���� ���� ���� ���� ���� ���� ���. ��� ���� ���� �u�� �����<br />
�����������������������������������������������������������<br />
������������������������������<br />
����� ������� ������� ������� ������� ������� ������� ������� ������� ������� ������� ������� ������� ������� �������<br />
���������������������������������������������������������������������� ����� ������� ������� ������� ������� ������� ������� ������� ������� ������� ������� ������� ������� ������� �������<br />
����������������������������������������������������������������� ����� ������� ������� ������� ������� ������� ������� ������� ������� ������� ������� ������� ������� ������� �������<br />
������������������������������������������������������ ����� ������� ������� ������� ������� ������� ������� ������� ������� ������� ������� ������� ������� ������� �������<br />
������������������������������������������������������� ����� ������� ������� ������� ������� ������� ������� ������� ������� ������� ������� ������� ������� ������� �������<br />
��������������������������������������������������������������������������� ����� ������� ������� ������� ������� ������� ������� ������� ������� ������� ������� ������� ������� ������� �������<br />
������������������������������������������������������������������������ ����� ������� ������� ������� ������� ������� ������� ������� ������� ������� ������� ������� ������� ������� �������<br />
�������������������������������������������������������������������������� ����� ������� ������� ������� ������� ������� ������� ������� ������� ������� ������� ������� ������� ������� �������<br />
�������������������������������������������������������������������������� ����� ������� ������� ������� ������� ������� ������� ������� ������� ������� ������� ������� ������� ������� �������<br />
��������������������� 3 ������������������ ����� ������� ������� ������� ������� ������� ������� ������� ������� ������� ������� ������� ������� ������� �������<br />
������������������������������������������������������������������ ����� ������� ������� ������� ������� ������� ������� ������� ������� ������� ������� ������� ������� ������� �������<br />
�����������������������������������������������������������������������<br />
��������������������<br />
����� ������� ������� ������� ������� ������� ������� ������� ������� ������� ������� ������� ������� ������� �������<br />
���������������������������������������������������������������������� ����� ������� ������� ������� ������� ������� ������� ������� ������� ������� ������� ������� ������� ������� �������<br />
��������������������������������������������������������������������� ����� ������� ������� ������� ������� ������� ������� ������� ������� ������� ������� ������� ������� ������� �������<br />
����������������������������������������������������������������� ����� ������� ������� ������� ������� ������� ������� ������� ������� ������� ������� ������� ������� ������� �������<br />
����������������������������������������������������������������� ����� ������� ������� ������� ������� ������� ������� ������� ������� ������� ������� ������� ������� ������� �������<br />
����������������������������������������������������������������� ����� ������� ������� ������� ������� ������� ������� ������� ������� ������� ������� ������� ������� ������� �������<br />
��������������������������������������������������������� ����� ������� ������� ������� ������� ������� ������� ������� ������� ������� ������� ������� ������� ������� �������<br />
����������������������������������������������������������������������� ����� ������� ������� ������� ������� ������� ������� ������� ������� ������� ������� ������� ������� ������� �������<br />
����������������������������������� 3 ����������� ����� ������� ������� ������� ������� ������� ������� ������� ������� ������� ������� ������� ������� ������� �������<br />
���������������������������������������������������������� ����� ������� ������� ������� ������� ������� ������� ������� ������� ������� ������� ������� ������� ������� �������<br />
��������������������������������������������������������������������������� ����� ������� ������� ������� ������� ������� ������� ������� ������� ������� ������� ������� ������� ������� �������<br />
�������������������������������������������������������������������� ����� ������� ������� ������� ������� ������� ������� ������� ������� ������� ������� ������� ������� ������� �������<br />
�������������������������������������������������������������� ����� ������� ������� ������� ������� ������� ������� ������� ������� ������� ������� ������� ������� ������� �������<br />
��������������������������������������������������������� ����� ������� ������� ������� ������� ������� ������� ������� ������� ������� ������� ������� ������� ������� �������<br />
�������������������������������������������������������������������� ����� ������� ������� ������� ������� ������� ������� ������� ������� ������� ������� ������� ������� ������� �������<br />
�������������������������������������������������������������������<br />
������������������������������<br />
���������������������������������<br />
����� ������� ������� ������� ������� ������� ������� ������� ������� ������� ������� ������� ������� ������� �������<br />
������������������������������������������������������������������������������ ����� ������� ������� ������� ������� ������� ������� ������� ������� ������� ������� ������� ������� ������� �������<br />
�����������(����������)����������������������������������������������� ����� ������� ������� ������� ������� ������� ������� ������� ������� ������� ������� ������� ������� ������� �������<br />
�������������������������������������������������������������������� ����� ������� ������� ������� ������� ������� ������� ������� ������� ������� ������� ������� ������� ������� �������<br />
���������������������������������������������������������������������������� ����� ������� ������� ������� ������� ������� ������� ������� ������� ������� ������� ������� ������� ������� �������<br />
���������������������������������������������������������������������� ����� ������� ������� ������� ������� ������� ������� ������� ������� ������� ������� ������� ������� ������� �������<br />
������������������������������������������������������������� ����� ������� ������� ������� ������� ������� ������� ������� ������� ������� ������� ������� ������� ������� �������<br />
��������������������������������������������������������������� ����� ������� ������� ������� ������� ������� ������� ������� ������� ������� ������� ������� ������� ������� �������<br />
��������������������������������� 1 ������������ ����� ������� ������� ������� ������� ������� ������� ������� ������� ������� ������� ������� ������� ������� �������<br />
�������������������������������������������������������������������<br />
������������������������������������������<br />
����� ������� ������� ������� ������� ������� ������� ������� ������� ������� ������� ������� ������� ������� �������<br />
��������������������������������������������������������������������������� ����� ������� ������� ������� ������� ������� ������� ������� ������� ������� ������� ������� ������� ������� �������<br />
������������������������������������������������������������������<br />
����� ������� ������� ������� ������� ������� ������� ������� ������� ������� ������� ������� ������� ������� �������<br />
������������������������������������������������������������������� ����� ������� ������� ������� ������� ������� ������� ������� ������� ������� ������� ������� ������� ������� �������<br />
������������������������������������������������������������������������� ����� ������� ������� ������� ������� ������� ������� ������� ������� ������� ������� ������� ������� ������� �������<br />
������������������������������������������������������������������������ ����� ������� ������� ������� ������� ������� ������� ������� ������� ������� ������� ������� ������� ������� �������<br />
������������������������������������� ��� ��������� ����� ������� ������� ������� ������� ������� ������� ������� ������� ������� ������� ������� ������� ������� �������<br />
����������������������� 1 ��������������� ����� ������� ������� ������� ������� ������� ������� ������� ������� ������� ������� ������� ������� ������� �������<br />
��������������������������������� ��� ���������� ����� ������� ������� ������� ������� ������� ������� ������� ������� ������� ������� ������� ������� ������� �������<br />
������������������������������������������������������������������� ����� ������� ������� ������� ������� ������� ������� ������� ������� ������� ������� ������� ������� ������� �������<br />
����������������������������������������������������������������������������� ����� ������� ������� ������� ������� ������� ������� ������� ������� ������� ������� ������� ������� ������� �������<br />
���������������������������������������������������������������������������� ����� ������� ������� ������� ������� ������� ������� ������� ������� ������� ������� ������� ������� ������� �������<br />
���������������������������������������������������������������� ����� ������� ������� ������� ������� ������� ������� ������� ������� ������� ������� ������� ������� ������� �������<br />
����������������������������� 2 ������������ ����� ������� ������� ������� ������� ������� ������� ������� ������� ������� ������� ������� ������� ������� �������<br />
����������������q���������������������������������� 3 � ����� ������� ������� ������� ������� ������� ������� ������� ������� ������� ������� ������� ������� ������� �������<br />
��������������������������������������� ��� ������ ����� ������� ������� ������� ������� ������� ������� ������� ������� ������� ������� ������� ������� ������� �������<br />
�����������������������������������������������������������������������<br />
����� ������� ������� ������� ������� ������� ������� ������� ������� ������� ������� ������� ������� ������� �������<br />
���������������������������������������������������������������������������� ����� ������� ������� ������� ������� ������� ������� ������� ������� ������� ������� ������� ������� ������� �������<br />
�������������������������������������������������������������������� ����� ������� ������� ������� ������� ������� ������� ������� ������� ������� ������� ������� ������� ������� �������<br />
���������������(�����)������������������������������������������� ����� ������� ������� ������� ������� ������� ������� ������� ������� ������� ������� ������� ������� ������� �������<br />
�������������������������������������������������������� ����� ������� ������� ������� ������� ������� ������� ������� ������� ������� ������� ������� ������� ������� �������<br />
����������������������������������������������������������������������������� ����� ������� ������� ������� ������� ������� ������� ������� ������� ������� ������� ������� ������� ������� �������<br />
���������������������������������������������������������������� ����� ������� ������� ������� ������� ������� ������� ������� ������� ������� ������� ������� ������� ������� �������<br />
��������������������������������������������������������������� ����� ������� ������� ������� ������� ������� ������� ������� ������� ������� ������� ������� ������ ������� �������<br />
������������������������������������� 1 ���������� ����� ������� ������� ������� ������� ������� ������� ������� ������� ������� ������� ������� ������� ������� �������<br />
������������������������������������������������������������������������� ����� ������� ������� ������� ������� ������� ������� ������� ������� ������� ������� ������� ������� ������� �������<br />
�������������������������������������������������������������������������� ����� ������� ������� ������� ������� ������� ������� ������� ������� ������� ������� ������� ������� ������� �������<br />
�������������������������������������������������������������������� ����� ������� ������� ������� ������� ������� ������� ������� ������� ������� ������� ������� ������� ������� �������<br />
���������������������������������� 2 ����������<br />
������������������������������<br />
���� ������ ������ ������ ������ ������ ������ ������ ������ ������ ������ ������ ������ ������ ������<br />
118 Monthly Labor Review • November 2008
��������������������������������������������������������������������������������������������������������������������������<br />
�����������������������������������������������������������������������<br />
�������������������������������������������<br />
���� ���� �����<br />
2007<br />
���� ���� ���� ���� ���� ���� ���� ��� ���� ���� ���� �����<br />
������������������������������������������������������������������ ����� ������� ������� ������� ������� ������� ������� ������� ������� ������� ������� ������� ������� ������� �������<br />
����������������������������� 1 ������������ ����� ������� ������� ������� ������� ������� ������� ������� ������� ������� ������� ������� ������� ������� �������<br />
��������������������������������������������������������������������� ����� ������� ������� ������� ������� ������� ������� ������� ������� ������� ������� ������� ������� ������� �������<br />
������������������(�����y���)����������������������������������� ����� ������� ������� ������� ������� ������� ������� ������� ������� ������� ������� ������� ������� ������� �������<br />
����������������������������������������������������� ����� ������� ������� ������� ������� ������� ������� ������� ������� ������� ������� ������� ������� ������� �������<br />
��������������������������������������������������� ����� ������� ������� ������� ������� ������� ������� ������� ������� ������� ������� ������� ������� ������� �������<br />
��������������������������������������������������������������� ����� ������� ������� ������� ������� ������� ������� ������� ������� ������� ������� ������� ������� ������� �������<br />
��������������������������������������������������������������������� ����� ������� ������� ������� ������� ������� ������� ������� ������� ������� ������� ������� ������� ������� �������<br />
��������������������������������������������������������� ����� ������� ������� ������� ������� ������� ������� ������� ������� ������� ������� ������� ������� ������� �������<br />
������������������������������������������������������������� ����� ������� ������� ������� ������� ������� ������� ������� ������� ������� ������� ������� ������� ������� �������<br />
�������������������������������������������������������������� ����� ������� ������� ������� ������� ������� ������� ������� ������� ������� ������� ������� ������� ������� �������<br />
���������������������������������������������������������� ����� ������� ������� ������� ������� ������� ������� ������� ������� ������� ������� ������� ������� ������� �������<br />
������������� 2 ������������������� ����� ������� ������� ������� ������� ������� ������� ������� ������� ������� ������� ������� ������� ������� �������<br />
��������������������� ��� ��������������� ����� ������� ������� ������� ������� ������� ������� ������� ������� ������� ������� ������� ������� ������� �������<br />
������������������������������ 2 ��������� ����� ������� ������� ������� ������� ������� ������� ������� ������� ������� ������� ������� ������� ������� �������<br />
��������������� 2 ������������������� ����� ������� ������� ������� ������� ������� ������� ������� ������� ������� ������� ������� ������� ������� �������<br />
������������������������������������������������������ ����� ������� ������� ������� ������� ������� ������� ������� ������� ������� ������� ������� ������� ������� �������<br />
���������������������������������������������������� ����� ������� ������� ������� ������� ������� ������� ������� ������� ������� ������� ������� ������� ������� �������<br />
������������������� ��� ��������������� ���� ������ ������ ������ ������ ������ ������ ������ ������ ������ ������ ������ ������ ������ ������<br />
�������������������������������������p��������g ��� � ���� ������ ������ ������ ������ ������ ������ ������ ������ ������ ������ ������ ������ ������ ������<br />
����������������p������������� ��� �����������<br />
��������������������������������������������������<br />
���� ������ ������ ������ ������ ������ ������ ������ ������ ������ ������ ������� ������� ������� �������<br />
������������������������������������������� ��� �����<br />
��������������������������������������������������<br />
���� ������ ������ ������ ������ ������ ������ ������ ������ ������ ������ ������ ������ ������ ������<br />
�����������������������p���� ��� ������������� ����� ������� ������� ������� ������� ������� ������� ������� ������� ������ ������ ������ ������ ������ ������<br />
��������g��������������������������������������������������� ����� ������� ������� ������� ������� ������� ������� ������� ������� ������� ������� ������� ������� ������� �������<br />
�����������������������g����������������������������� ����� ������� ������� ������� ������� ������� ������� ������� ������� ������� ������� ������� ������� ������� �������<br />
������������������ 1 ����������������� ����� ������� ������� ������� ������� ������� ������� ������� ������� ������� ������� ������� ������� ������� �������<br />
����������������������p������� 1 ����������� ����� ������� ������� ������� ������� ������� ������� ������� ������� ������� ������� ������� ������� ������� �������<br />
������������������������������ 1 ����������� ����� ������� ������� ������� ������� ������� ������� ������� ������� ������� ������� ������� ������� ������� �������<br />
�������������������������������������������������������<br />
������������������������������<br />
����� ������� ������� ������� ������� ������� ������� ������� ������� ������� ������� ������� ������� ������� �������<br />
����������������������������������������������������������������� ����� ������� ������� ������� ������� ������� ������� ������� ������� ������� ������� ������� ������� ������� �������<br />
��������������������g��������������������������������������� ����� ������� ������� ������� ������� ������� ������� ������� ������� ������� ������� ������� ������� ������� �������<br />
�������������������������������������g����������� ����� ������� ������� ������� ������� ������� ������� ������� ������� ������� ������� ������� ������� ������� �������<br />
���������������������������������������g��������� ����� ������� ������� ������� ������� ������� ������� ������� ������� ������� ������� ������� ������� ������� �������<br />
���������������������������������������������������������������������<br />
������������������������������������������<br />
����� ������� ������� ������� ������� ������� ������� ������� ������� ������� ������� ������� ������� ������� �������<br />
������������������������������������������������������������������� ����� ������� ������� ������� ������� ������� ������� ������� ������� ������� ������� ������� ������� ������� �������<br />
�������������������������������������������������������������������� ����� ������� ������� ������� ������� ������� ������� ������� ������� ������� ������� ������� ������� ������� �������<br />
��������������������������������������������������������������������� ����� ������� ������� ������� ������� ������� ������� ������� ������� ������� ������� ������� ������� ������� �������<br />
��������������������� 3 ���������������� ����� ������� ������� ������� ������� ������� ������� ������� ������� ������� ������� ������� ������� ������� �������<br />
����������������������������������������������������������� ����� ������� ������� ������� ������� ������� ������� ������� ������� ������� ������� ������� ������� ������� �������<br />
������������������������������������������������������������������<br />
��������������������<br />
����� ������� ������� ������� ������� ������� ������� ������� ������� ������� ������� ������� ������� ������� �������<br />
����������������������������������������������������������������� ����� ������� ������� ������� ������� ������� ������� ������� ������� ������� ������� ������� ������� ������� �������<br />
���������������������������������������������������������������� ����� ������� ������� ������� ������� ������� ������� ������� ������� ������� ������� ������� ������� ������� �������<br />
����������������������������������������������������������� ����� ������� ������� ������� ������� ������� ������� ������� ������� ������� ������� ������� ������� ������� �������<br />
����������������������������������������������������������� ����� ������� ������� ������� ������� ������� ������� ������� ������� ������� ������� ������� ������� ������� �������<br />
������������������������������������������������������������ ����� ������� ������� ������� ������� ������� ������� ������� ������� ������� ������� ������� ������� ������� �������<br />
���������������������������������������������������� ����� ������� ������� ������� ������� ������� ������� ������� ������� ������� ������� ������� ������� ������� �������<br />
����������������������������������������������������������������� ����� ������� ������� ������� ������� ������� ������� ������� ������� ������� ������� ������� ������� ������� �������<br />
����������������������������������� 3 ������ ������<br />
�������������e<br />
2008<br />
��������� ����� ������� ������� ������� ������� ������� ������� ������� ������� ������� ������� ������� ������� ������� �������<br />
����������������������������������������������������� ����� ������� ������� ������� ������� ������� ������� ������� ������� ������� ������� ������� ������� ������� �������<br />
����������gy��������������������������������������������������������� ����� ������� ������� ������� ������� ������� ������� ������� ������� ������� ������� ������� ������� ������� �������<br />
�������������������������gy������������������������������������ ����� ������� ������� ������� ������� ������� ������� ������� ������� ������� ������� ������� ������� ������� �������<br />
������������������������������������gy������������������� ����� ������� ������� ������� ������� ������� ������� ������� ������� ������� ������� ������� ������� ������� �������<br />
����������������������������������������gy��������� ����� ������� ������� ������� ������� ������� ������� ������� ������� ������� ������� ������� ������� ������� �������<br />
����������������gy��������������������������������������������� ����� ������� ������� ������� ������� ������� ������� ������� ������� ������� ������� ������� ������� ������� �������<br />
����������������������������gy�������������������������������� ����� ������� ������� ������� ������� ������� ������� ������� ������� ������� ������� ������� ������� ������� �������<br />
1 ��������������������������<br />
2 ����������������������������������������<br />
3 ����������������������������������������<br />
� ����������������������������������������<br />
���������������������������������������������������������������������<br />
Monthly Labor Review • November 2008 119
Current Labor Statistics: Price Data<br />
39. Consumer Price Index: U.S. city average and available local area data: all items<br />
�������������������������������������������<br />
Pricing All Urban Consumers Urban Wage Earners<br />
sched- 2008 2008<br />
ule 1 Apr. May June July Aug. Sept. Apr. May June July Aug. Sept.<br />
��������������y������g������������������<br />
Region and area size<br />
� ������� ������� ������� ������� ������� ������� ������� ������� ������� ������� ������� �������<br />
2<br />
��������������������������������������� � ������� ������� ������� ������� ������� ������� ������� ������� ������� ������� ������� �������<br />
������������������������������������������������������������������������� � ������� ������� ������� ������� ������� ������� ������� ������� ������� ������� ������� �������<br />
�������������������������������� � �������������� � ������� ������� ������� ������� ������� ������� ������� ������� ������� ������� ������� �������<br />
������������� � ������������������������ � ������� ������� ������� ������� ������� ������� ������� ������� ������� ������� ������� �������<br />
������������������������������������������������������������������������� � ������� ������� ������� ������� ������� ������� ������� ������� ������� ������� ������� �������<br />
�������������������������������� � �������������� � ������� ������� ������� ������� ������� ������� ������� ������� ������� ������� ������� �������<br />
���������������������������(����������������)��������� � ������� ������� ������� ������� ������� ������� ������� ������� ������� ������� ������� �������<br />
������������������������������������������������������������������������������ � ������� ������� ������� ������� ������� ������� ������� ������� ������� ������� ������� �������<br />
������������������������������������������������������������������������� � ������� ������� ������� ������� ������� ������� ������� ������� ������� ������� ������� �������<br />
�������������������������������� � �������������� � ������� ������� ������� ������� ������� ������� ������� ������� ������� ������� ������� �������<br />
������������� ��<br />
����� � �������������������������������� � ������� ������� ������� ������� ������� ������� ������� ������� ������� ������� ������� �������<br />
������� � ������������������������������ � ������� ������� ������� ������� ������� ������� ������� ������� ������� ������� ������� �������<br />
���������������������������������������������������������������������<br />
Selected local are<strong>as</strong><br />
� ������� ������� ������� ������� ������� ������� ������� ������� ������� ������� ������� �������<br />
6<br />
�����g�����y������������������������������ M ������� ������� ������� ������� ������� ������� ������� ������� ������� ������� ������� �������<br />
������g�������������������g�������y������������ � ������� ������� ������� ������� ������� ������� ������� ������� ������� ������� ������� �������<br />
����������������������������g��������������������� M ������� ������� ������� ������� ������� ������� ������� ������� ������� ������� ������� �������<br />
������������������������������������������� � � ������� � ������� � ������� � ������� � ������� � �������<br />
������������������������������������ � � ������� � ������� � ������� � ������� � ������� � �������<br />
������������������������������������� � � ������� � ������� � ������� � ������� � ������� � �������<br />
������g�������������������������� � ��������� � � ������� � ������� � ������� � ������� � ������� � �������<br />
���������������������������������� � ������� � ������� � ������� � ������� � ������� � ������� �<br />
����������������������������������������� � ������� � ������� � ������� � ������� � ������� � ������� �<br />
������������������������������������������ � ������� � ������� � ������� � ������� � ������� � ������� �<br />
����������������������������������������� � ������� � ������� � ������� � ������� � ������� � ������� �<br />
�������������������g����������������y��������������� � ������� � ������� � ������� � ������� � ������� � ������� �<br />
�������������������������������������������� � ������� � ������� � ������� � ������� � ������� � ������� �<br />
������������������������������������������ � ������� � ������� � ������� � ������� � ������� � ������� �<br />
1<br />
������ ������ ��� ������� ����� ����� ������ ����� ����� �� ��� ������ ���� �����<br />
���������������������������������������<br />
����������������<br />
�������������������������������������������������������<br />
���������������������������������������������������������<br />
2<br />
����������������������������������������������<br />
�<br />
����������������������������������������<br />
�<br />
��� ������ �������� ������ ��� ���� ������� ��� ��������� ������ �� ��� ������<br />
��������������������������������������������������������<br />
�<br />
����������������������������������������<br />
�<br />
�� ��������� ��� ��������� ������������ ����� ��� ��������� ������������ ���<br />
������������������������������������������������������������������������ ��� ��������<br />
120 Monthly Labor Review • November 2008<br />
������ � ���������� ��� ������������ ��������� ������ ����� ������<br />
����������������� ��� ��������������� ����� ������ ����������� ��� ����������������<br />
���������������������������������������������������������������������������<br />
� �����������������������������������������<br />
����� ����� ���� ��� ������� ��� ���������� �� ��� �������� ��� �������� ���� �����<br />
����� ��� � ������� ������ ���� ��� ��� ���������� ������� �� ������������� ���� ��������<br />
��� ����� ����������� ������ �� � ������� ����� ���� ������� ���� ������� ���������� ����<br />
��� �������� ������ �������� ����� ��������� ������ ��� �������� ���������� ��� ������ ��<br />
����� ���������� �������� ����� ����� �� �������� �������� ��� �������� ������� ��� ��� ���<br />
�� ����� ��������� �������� ����� ������� �� � ����� �� � ������ ��� �� ��� �������� �����<br />
�����������������������������������
40. Annual data: Consumer Price Index, U.S. city average, all items and major groups<br />
���������������<br />
Series 1997 1998 1999 2000 2001 2002 2003 2004 2005 2006 2007<br />
���������������������������������������������<br />
������������<br />
������������������������������������������������������������������������������ ����� ����� ����� ����� ����� ����� ����� ����� ����� ����� �������<br />
������������������g������������������������������������� ��� ��� ��� ��� ��� ��� ��� ��� ��� ��� ���<br />
������������������g���<br />
������������������������������������������������������������������������������ ����� ����� ����� ����� ����� ����� ����� ����� ����� ����� �������<br />
������������������g������������������������������������� ��� ��� ��� ��� ��� ��� ��� ��� ��� ��� ���<br />
���������g�<br />
�������������������������������������������������������������������� ����� ����� ����� ����� ����� ����� ����� ����� ����� ����� �������<br />
������������������g������������������������������������� ��� ��� ��� ��� ��� ��� ��� ��� ��� ��� ���<br />
�����������<br />
������������������������������������������������������������������������������ ����� ����� ����� ����� ����� ����� ����� ����� ����� ����� �������<br />
������������������g������������������������������������� �� �� ���� ���� ���� ���� ���� ��� ��� �� ����<br />
������������������<br />
���������������������������������������������������������������������������� ����� ����� ����� ����� ����� ����� ����� ����� ����� ����� �������<br />
������������������g������������������������������������� ��� ���� ��� ��� ��� ��� ��� ��� ��� ��� ���<br />
����������������<br />
������������������������������������������������������������������������������ ����� ����� ����� ����� ����� ����� ����� ����� ����� ����� �������<br />
������������������g������������������������������������� ��� ��� ��� ��� ��� ��� ��� ��� ��� ��� ���<br />
���������g������������������<br />
������������������������������������������������������������������������������ ����� ����� ����� ����� ����� ����� ����� ����� ����� ����� �������<br />
������������������g������������������������������������� ��� ��� ��� ��� ��� ��� ��� ��� ��� ��� ���<br />
�������������������������������������������<br />
������������������������<br />
������������<br />
����������������������������������������������������������������������� ����� ����� ����� ����� ����� ����� ����� ����� ����� ����� �������<br />
������������������g������������������������������������� ��� ��� ��� ��� ��� ��� ��� ��� ��� ��� ���<br />
Monthly Labor Review • November 2008 121
Current Labor Statistics: Price Data<br />
���������������������������������������������������<br />
������������<br />
122 Monthly Labor Review • November 2008<br />
2007 2008<br />
2006 2007 Sept. Oct. Nov. Dec. Jan. Feb. Mar. Apr. May June p July p Aug. p Sept. p<br />
Annual average<br />
Finished goods....…………………………… 160.4 166.6 167.4 168.6 171.4 170.4 172.0 172.3 175.1 176.5 179.8 182.5 185.0 182.1 182.0<br />
Finished consumer goods......................... 166.0 173.5 174.8 175.9 179.4 178.2 180.1 180.4 184.2 185.8 190.3 193.9 197.1 193.1 192.7<br />
Finished consumer foods........................<br />
Finished consumer goods<br />
156.7 167.0 168.4 169.7 169.5 172.2 174.5 173.6 176.0 175.5 177.6 180.1 180.9 181.4 182.0<br />
excluding foods..................................... 169.2 175.6 177.0 177.9 182.9 180.1 181.9 182.7 187.1 189.6 195.0 199.1 203.2 197.4 196.7<br />
Nondurable goods less food................. 182.6 191.7 194.6 194.5 201.5 197.9 200.3 201.4 208.2 211.7 220.0 226.5 232.5 223.8 222.6<br />
Durable goods...................................... 136.9 138.3 136.7 139.8 140.2 139.5 140.1 140.2 139.9 140.5 140.3 139.8 140.3 139.9 140.1<br />
Capital equipment...................................<br />
Intermediate materials,<br />
146.9 149.5 148.9 150.6 151.0 150.7 151.4 151.8 151.8 152.4 152.7 152.7 153.6 153.7 154.3<br />
supplies, and components........…………<br />
Materials and components<br />
164.0 170.7 172.2 172.2 176.2 175.7 177.8 179.1 184.5 187.3 192.8 196.9 202.5 200.2 198.7<br />
for manufacturing...................................... 155.9 162.4 163.3 164.4 166.1 166.3 168.4 170.1 173.1 175.5 179.1 181.6 186.6 190.6 187.1<br />
Materials for food manufacturing.............. 146.2 161.4 166.6 166.3 166.6 169.8 173.6 176.7 180.0 180.3 182.7 185.7 187.7 187.4 185.2<br />
Materials for nondurable manufacturing... 175.0 184.0 186.0 189.4 195.1 195.1 199.3 201.5 206.0 209.5 215.9 220.1 231.9 243.8 236.9<br />
Materials for durable manufacturing......... 180.5 189.8 189.1 189.0 188.6 188.1 189.5 193.1 200.3 205.6 211.9 216.3 219.4 220.1 213.0<br />
Components for manufacturing................<br />
Materials and components<br />
134.5 136.3 136.5 136.6 136.7 136.8 137.4 137.8 137.9 138.6 139.4 139.9 141.4 142.1 142.5<br />
for construction......................................... 188.4 192.5 193.2 193.2 193.2 193.4 194.4 195.7 197.3 200.2 203.3 206.3 209.9 213.1 214.4<br />
Processed fuels and lubricants................... 162.8 173.9 178.4 175.5 189.7 186.3 188.6 189.0 206.1 211.8 227.3 238.6 249.6 224.2 223.2<br />
Containers.................................................. 175.0 180.3 181.0 182.3 183.2 183.4 185.1 185.7 185.9 187.0 187.6 188.5 191.6 194.2 198.1<br />
Supplies...................................................... 157.0 161.7 162.3 163.0 163.9 164.6 166.8 168.1 170.0 171.3 173.1 174.3 177.7 179.4 179.9<br />
Crude materials for further<br />
processing.......................………………… 184.8 207.1 204.6 211.8 225.6 229.0 235.5 245.5 262.1 274.6 293.1 305.2 317.9 280.0 257.8<br />
Foodstuffs and feedstuffs........................... 119.3 146.7 151.9 150.0 152.9 158.5 162.6 165.4 169.2 168.1 173.2 178.9 179.3 170.4 168.0<br />
Crude nonfood materials............................<br />
Special groupings:<br />
230.6 246.3 237.4 252.0 274.1 275.4 283.8 299.9 327.7 352.4 382.4 399.6 423.3 360.5 320.8<br />
Finished goods, excluding foods................ 161.0 166.2 166.9 168.1 171.6 169.6 171.0 171.7 174.6 176.4 180.1 182.8 185.9 182.0 181.7<br />
Finished energy goods............................... 145.9 156.3 159.7 159.1 170.4 163.8 166.6 167.2 177.5 182.4 194.8 204.3 213.0 198.2 195.5<br />
Finished goods less energy........................ 157.9 162.8 163.0 164.7 164.9 165.5 166.7 167.0 167.6 168.0 168.8 169.5 170.4 170.7 171.3<br />
Finished consumer goods less energy....... 162.7 168.7 169.2 170.8 171.0 172.0 173.5 173.7 174.7 174.9 175.9 177.0 177.8 178.3 178.9<br />
Finished goods less food and energy.........<br />
Finished consumer goods less food<br />
158.7 161.7 161.5 163.2 163.6 163.5 164.4 165.0 165.1 165.7 166.1 166.2 167.1 167.3 167.9<br />
and energy................................................<br />
Consumer nondurable goods less food<br />
166.7 170.0 170.0 171.8 172.2 172.2 173.2 174.0 174.1 174.8 175.2 175.4 176.2 176.6 177.2<br />
and energy.............................................. 191.5 197.0 198.3 199.0 199.3 200.0 201.4 203.0 203.6 204.3 205.4 206.4 207.6 208.8 209.8<br />
Intermediate materials less foods<br />
and feeds.................................................. 165.4 171.5 172.9 172.9 177.0 176.3 178.2 179.4 184.7 187.7 193.3 197.4 203.0 200.5 199.1<br />
Intermediate foods and feeds..................... 135.2 154.4 158.2 159.6 161.4 164.6 170.6 175.0 180.3 180.5 184.5 186.8 194.6 194.0 192.2<br />
Intermediate energy goods......................... 162.8 174.6 179.5 177.4 191.1 187.8 190.5 191.5 208.6 213.4 228.7 240.5 253.0 230.3 226.2<br />
Intermediate goods less energy..................<br />
Intermediate materials less foods<br />
162.1 167.6 168.2 168.9 170.2 170.4 172.3 173.7 176.0 178.4 181.4 183.4 187.3 190.1 189.4<br />
and energy................................................ 163.8 168.4 168.9 169.5 170.8 170.9 172.5 173.7 175.8 178.3 181.2 183.2 186.9 189.9 189.3<br />
Crude energy materials.............................. 226.9 232.8 219.9 237.7 267.1 268.3 273.6 291.7 325.4 346.1 386.1 409.7 437.9 352.7 311.4<br />
Crude materials less energy....................... 152.3 182.6 188.3 187.4 189.2 194.1 200.9 205.9 211.7 218.5 223.9 229.1 232.2 223.2 213.3<br />
Crude nonfood materials less energy......... 244.5 282.6 289.9 292.8 289.9 291.7 307.3 319.7 332.1 366.7 372.4 374.5 387.2 379.1 342.6<br />
������������������<br />
Grouping
�����������������������������������������������������������������������<br />
�������������������������������������������������<br />
NAICS<br />
Industry<br />
2007 2008<br />
Sept. Oct. Nov. Dec. Jan. Feb. Mar. Apr. May June p July p Aug. p Sept. p<br />
Total mining industries (December 1984=100)............................. 214.3 228.3 249.3 249.5 254.2 263.8 287.2 301.6 329.0 345.9 368.9 306.9 276.2<br />
����� ��� Oil and g<strong>as</strong> extraction (December 1985=100) ............................. 256.2 279.6 314.8 315.9 321.9 335.0 371.6 390.8 436.2 463.5 499.4 395.4 345.1<br />
����� ��� Mining, except oil and g<strong>as</strong>…………………………………………… 162.2 162.4 161.3 161.2 164.9 170.3 174.8 186.1 184.7 185.1 189.3 191.6 189.4<br />
����� ��� Mining support activities……………………………………………… 169.7 168.5 168.7 164.9 167.2 168.8 169.8 170.1 172.2 174.6 176.5 178.8 178.3<br />
Total manufacturing industries (December 1984=100)................ 163.7 164.5 168.0 166.9 168.5 169.6 173.4 175.3 179.4 182.0 185.6 183.0 183.1<br />
����� ��� Food manufacturing (December 1984=100)………………………… 160.8 160.7 161.4 162.8 165.8 167.5 169.8 171.2 174.0 176.3 180.1 180.8 180.2<br />
����� ��� Beverage and tobacco manufacturing........................................... 110.3 111.1 111.1 111.2 112.1 112.7 112.7 112.9 114.2 114.2 115.2 114.9 115.2<br />
����� ��� Textile mills.................................................................................... 108.7 108.9 109.1 109.3 110.1 110.3 110.4 110.6 111.4 111.7 112.6 113.9 115.1<br />
����� ��� Apparel manufacturing………………………………...……………… 101.3 101.5 101.5 101.5 101.8 101.8 102.0 102.2 102.2 102.2 102.4 102.8 102.6<br />
����� ��� Leather and allied product manufacturing (December 1984=100) 150.0 150.4 150.5 151.1 152.0 152.4 152.6 152.7 152.4 153.9 154.4 154.8 154.2<br />
����� ��� Wood products manufacturing……………………………………… 107.2 106.5 106.1 106.1 105.7 105.5 105.9 106.2 108.2 109.5 109.0 109.2 109.6<br />
����� ��� Paper manufacturing..................................................................... 116.1 117.1 117.8 118.0 118.5 119.2 119.6 120.2 120.5 120.8 121.6 124.2 126.5<br />
����� ��� Printing and related support activities........................................... 107.0 107.1 107.2 107.4 107.8 108.1 108.2 109.0 109.2 109.5 110.0 110.4 110.5<br />
����� ��� Petroleum and coal products manufacturing<br />
(December 1984=100)………………………………….…………<br />
267.4 266.9 305.5 288.4 294.9 298.4 337.1 347.7 384.1 406.0 428.9 383.9 381.6<br />
����� ��� Chemical manufacturing (December 1984=100)…………………… 205.0 206.4 209.2 210.4 213.6 215.8 218.4 221.1 224.5 227.8 233.7 240.0 241.2<br />
����� ��� Pl<strong>as</strong>tics and rubber products manufacturing<br />
(December 1984=100)………….…………………………………<br />
151.2 151.6 152.2 153.2 154.8 155.6 156.4 156.8 158.3 159.5 162.7 165.0 166.4<br />
����� ��� Primary metal manufacturing (December 1984=100)……………… 188.8 188.6 188.9 188.6 190.4 194.2 202.4 211.5 221.1 228.5 233.2 235.1 227.4<br />
����� ��� Fabricated metal product manufacturing (December 1984=100)… 162.8 163.3 163.7 164.3 165.6 166.8 168.3 171.1 173.0 174.7 177.3 178.9 180.3<br />
����� ��� Machinery manufacturing………………………..…………………… 112.5 112.7 113.0 113.1 113.8 114.3 114.6 115.1 115.8 116.5 117.9 118.5 119.0<br />
����� ��� Computer and electronic products manufacturing………………… 93.3 93.1 92.8 92.6 92.6 92.8 92.7 92.7 92.8 92.8 93.0 93.0 92.9<br />
����� ��� Electrical equipment, appliance, and components manufacturing 123.7 124.2 124.5 124.4 125.2 125.9 127.1 127.3 127.8 128.4 129.0 129.9 129.9<br />
����� ��� Transportation equipment manufacturing…………………………… 103.8 106.3 106.6 106.0 106.6 106.6 106.1 106.7 106.6 105.9 106.5 106.3 106.5<br />
����� ��� Furniture and related product manufacturing<br />
(December 1984=100)………………………………………………<br />
165.9 166.1 166.6 166.4 167.1 167.8 168.3 169.5 170.2 171.7 172.1 172.7 173.6<br />
����� ��� Miscellaneous manufacturing…………………………………………<br />
Retail trade<br />
107.1 107.2 107.5 107.7 108.5 108.7 109.2 109.3 109.4 110.0 110.4 110.8 110.7<br />
����� ��� Motor <strong>vehicle</strong> and parts dealers……………………………………… 116.0 115.3 116.1 118.0 118.3 118.4 117.9 118.9 118.3 118.6 118.1 118.8 118.7<br />
����� ��� Furniture and home furnishings stores……………………………… 119.0 120.1 121.1 119.0 119.6 118.8 120.1 119.4 120.2 119.8 120.3 120.8 122.0<br />
����� ��� Electronics and appliance stores…………………………………… 107.8 111.1 114.9 89.3 109.0 110.2 113.4 119.7 118.7 111.3 110.1 109.9 109.5<br />
����� ��� Health and personal care stores……………………………………… 123.9 123.5 123.8 123.8 124.8 124.5 125.5 127.2 127.3 128.0 135.4 133.1 134.2<br />
����� ��� G<strong>as</strong>oline stations (June 2001=100)………………………………… 73.7 78.0 73.7 66.6 67.1 61.6 60.6 65.7 59.3 67.3 80.1 84.3 85.3<br />
����� ��� Nonstore retailers………………………………………………………<br />
Transportation and warehousing<br />
126.0 130.2 125.7 134.7 136.0 133.8 133.1 136.4 136.5 138.0 140.9 167.6 159.5<br />
����� ��� Air transportation (December 1992=100)…………………………… 180.5 187.2 189.4 187.1 192.0 191.8 198.6 199.5 203.7 211.7 211.4 213.0 208.8<br />
����� ��� Water transportation…………………………………………………… 115.3 117.2 116.5 116.4 119.0 119.2 120.6 121.1 124.7 127.0 129.3 132.2 134.6<br />
����� ��� Postal service (June 1989=100)……………………………………… 175.5 175.5 175.5 175.5 175.5 175.5 175.5 175.5 180.5 180.5 180.5 180.5 180.5<br />
����� ���<br />
Utilities<br />
Utilities…………………………………………………………………… 129.3<br />
Health care and social <strong>as</strong>sistance<br />
127.2 126.6 127.4 127.8 129.7 131.1 134.5 137.0 141.1 146.3 146.2 140.7<br />
���� Office <strong>of</strong> physicians (December 1996=100)………………………… 122.9 122.9 121.5 122.7 123.3 123.3 123.3 123.2 123.2 123.2 123.2 123.4 123.4<br />
���� Medical and diagnostic laboratories………………………………… 107.6 107.7 106.7 106.7 107.3 107.3 107.3 107.3 106.9 106.6 106.9 106.9 106.9<br />
���� Home health care services (December 1996=100)………………… 124.1 125.1 125.3 125.3 125.4 125.5 125.5 125.4 125.4 125.4 125.4 126.8 126.4<br />
��� Hospitals (December 1992=100)…………………………………… 158.2 161.3 161.9 161.9 162.4 162.6 162.9 162.7 162.7 162.8 163.2 163.1 163.4<br />
���� Nursing care facilities………………………………………………… 115.8 116.4 116.5 117.0 117.9 118.0 118.3 118.5 118.6 118.1 119.1 119.4 119.4<br />
����� Residential mental retardation facilities……………………………… 113.5<br />
Other services industries<br />
113.9 114.3 114.6 115.4 117.2 117.7 118.2 118.5 117.6 117.8 118.1 118.3<br />
����� ��� Publishing industries, except Internet ……………………………… 108.4 108.5 108.5 108.5 109.7 109.8 110.4 110.9 110.7 110.2 110.8 111.3 110.3<br />
����� ��� Broadc<strong>as</strong>ting, except Internet………………………………………… 99.6 101.0 102.3 103.6 104.4 104.6 105.2 106.4 105.5 102.7 103.3 104.3 104.3<br />
����� ��� Telecommunications…………………………………………………… 102.0 101.8 101.2 100.7 100.6 100.9 100.6 101.0 101.3 101.1 101.0 101.7 101.4<br />
���� Data processing and related services……………………………… 100.4 100.3 100.5 100.4 100.4 100.5 100.5 100.4 100.8 100.9 101.0 101.1 101.1<br />
����� ��� Security, commodity contracts, and like activity……………………<br />
����� Lessors or nonresidental buildings (except miniwarehouse)………<br />
121.1<br />
109.0<br />
121.4<br />
108.5<br />
124.2<br />
108.5<br />
123.0<br />
110.0<br />
122.5<br />
108.1<br />
122.9<br />
108.2<br />
121.0<br />
109.7<br />
119.6<br />
109.5<br />
119.6<br />
110.5<br />
120.7<br />
109.7<br />
118.8<br />
110.2<br />
119.4<br />
111.5<br />
119.0<br />
111.9<br />
���� Offices <strong>of</strong> real estate agents and brokers…………………………… 110.7 110.5 110.5 109.9 110.3 109.8 110.0 110.2 106.9 105.4 107.0 105.4 105.5<br />
���� Real estate support activities………………………………………… 102.9 103.5 106.1 105.6 106.6 106.0 106.8 107.3 108.3 107.4 109.7 110.8 108.7<br />
���� Automotive equipment rental and le<strong>as</strong>ing (June 2001=100)……… 117.2 118.9 118.4 119.1 121.3 121.3 125.1 120.3 122.0 125.2 132.6 133.4 128.8<br />
���� Legal services (December 1996=100)……………………………… 154.3 154.8 155.1 155.1 159.9 160.3 160.7 161.1 160.9 160.9 161.5 161.7 161.5<br />
������ Offices <strong>of</strong> certified public accountants……………………………… 112.4 113.1 112.9 113.0 115.6 114.1 113.8 112.7 114.0 112.4 115.8 116.3 115.9<br />
���� Architectural, engineering, and related services<br />
(December 1996=100)……………………………………………… 140.7 140.8 140.8 140.8 139.2 140.3 140.3 140.5 140.5 141.9 141.5 141.5 141.6<br />
����� Advertising agencies…………………………………………………… 105.1 105.1 105.1 105.1 105.2 105.3 105.3 105.7 106.3 105.7 105.7 105.7 106.3<br />
���� Employment services (December 1996=100)……………………… 122.0 122.4 122.3 122.2 122.3 123.0 123.0 122.9 122.7 122.9 123.1 123.5 123.2<br />
����� Travel agencies………………………………………………………… 100.9 102.5 101.7 100.2 98.8 98.8 98.8 98.8 98.8 98.8 98.8 98.8 99.9<br />
����� Janitorial services……………………………………………………… 106.8 106.9 107.1 108.7 108.9 109.1 108.9 108.9 109.0 109.2 109.1 109.8 109.5<br />
���� W<strong>as</strong>te collection………………………………………………………… 108.9 108.9 109.5 108.4 110.7 112.1 112.0 112.2 111.9 112.8 112.1 113.1 113.9<br />
����� ��� Accommodation (December 1996=100)…………………………… 145.0 145.8 144.7 143.7 145.4 145.2 145.3 145.6 144.9 149.6 152.8 152.4 144.7<br />
������������������<br />
Monthly Labor Review • November 2008 123
Current Labor Statistics: Price Data<br />
43. Annual data: Producer Price Indexes, by stage <strong>of</strong> processing<br />
������������<br />
Index<br />
Finished goods<br />
1997 1998 1999 2000 2001 2002 2003 2004 2005 2006 2007<br />
������������������������������������������������������������������������������������ ����� ����� ����� ����� ����� ����� ����� ����� ����� ����� �����<br />
������������������������������������������������� ����� ����� ����� ����� ����� ����� ����� ����� ����� ����� �����<br />
��������������������������������������� ���� ���� ���� ���� ���� ���� ����� ����� ����� ����� �����<br />
����������������������������������������������������<br />
Intermediate materials, supplies, and<br />
components<br />
����� ����� ����� ����� ����� ����� ����� ����� ����� ����� �����<br />
������������������������������������������������������������������������������������ ����� ����� ����� ����� ����� ����� ����� ����� ����� ����� �����<br />
�������������������������������������� ����� ����� ����� ����� ����� ����� ����� ����� ����� ����� �����<br />
���������������������������������������������������� ���� ���� ���� ����� ����� ���� ����� ����� ����� ����� �����<br />
���������������������������������������������������<br />
Crude materials for further processing<br />
����� ����� ����� ����� ����� ����� ����� ����� ����� ����� �����<br />
������������������������������������������������������������������������������������ ����� ���� ���� ����� ����� ����� ����� ����� ����� ����� �����<br />
������������������������������������������������� ����� ����� ���� ����� ����� ���� ����� ����� ����� ����� �����<br />
��������������������������������������� ���� ���� ���� ����� ����� ����� ����� ����� ����� ����� �����<br />
���������������������������������������������������� ����� ���� ���� ����� ����� ����� ����� ����� ����� ����� �����<br />
���������������������������������������������������<br />
[2000 = 100]<br />
Category<br />
2007 2008<br />
Sept. Oct. Nov. Dec. Jan. Feb. Mar. Apr. May June July Aug. Sept.<br />
ALL COMMODITIES…………….................................... 116.7 117.6 118.7 119.3 120.7 121.8 123.8 124.4 124.8 126.1 128.0 125.8 124.6<br />
Foods, feeds, and beverages……………...…………… 157.8 164.1 165.9 171.1 180.5 188.7 196.9 192.8 193.3 198.0 211.1 189.1 189.1<br />
Agricultural foods, feeds, and beverages…............. 160.8 167.6 169.8 175.2 185.0 193.8 202.6 198.2 198.9 204.0 218.5 194.2 194.4<br />
Nonagricultural (fish, beverages) food products…… 133.0 134.2 133.1 136.1 142.0 144.7 148.3 146.4 145.5 146.1 146.9 145.6 143.5<br />
Industrial supplies and materials……………...………… 148.8 150.5 153.9 154.1 157.1 159.1 165.5 167.9 169.6 173.2 177.7 173.7 169.1<br />
Agricultural industrial supplies and materials…........ 140.0 142.7 144.9 144.7 146.0 150.6 159.3 157.9 156.9 158.0 162.8 161.5 158.0<br />
Fuels and lubricants…...............................…………<br />
Nonagricultural supplies and materials,<br />
200.9 204.8 224.7 222.8 232.1 225.6 249.5 259.3 275.8 297.2 313.0 275.2 268.8<br />
excluding fuel and building materials…………...… 145.0 146.5 147.9 148.5 150.9 154.1 158.2 160.1 160.1 161.6 164.9 165.0 160.3<br />
Selected building materials…...............................… 114.4 114.2 113.8 113.7 113.3 113.8 114.2 114.1 113.9 113.8 113.9 114.4 113.8<br />
Capital goods……………...…………………………….… 99.9 100.1 100.3 100.6 100.9 101.3 101.2 101.5 101.6 102.0 101.9 102.0 101.9<br />
Electric and electrical generating equipment…........ 106.7 107.1 107.2 107.5 107.7 108.3 108.6 108.7 108.6 108.9 109.2 109.2 109.6<br />
Nonelectrical machinery…...............................……… 93.1 93.2 93.4 93.6 93.7 93.9 93.7 93.9 93.9 94.2 94.0 94.1 93.9<br />
Automotive <strong>vehicle</strong>s, parts, and engines……………... 106.3 106.5 106.5 106.7 106.9 107.0 107.1 107.5 107.5 107.4 107.7 107.8 107.9<br />
Consumer goods, excluding automotive……………... 106.2 106.4 106.8 107.3 107.3 107.4 108.0 108.1 108.1 108.2 108.6 108.6 108.3<br />
Nondurables, manufactured…...............................… 107.0 107.4 108.0 108.2 108.1 108.2 109.3 109.8 110.0 110.1 110.0 109.9 109.0<br />
Durables, manufactured…………...………..........…… 104.2 104.2 104.4 105.2 105.2 105.5 105.4 105.1 105.1 105.2 106.1 106.3 106.4<br />
Agricultural commodities……………...………………… 156.8 162.8 165.0 169.3 177.5 185.6 194.3 190.5 190.8 195.2 207.8 187.9 187.4<br />
Nonagricultural commodities……………...…………… 113.8 114.4 115.4 115.7 116.6 117.3 118.8 119.6 120.1 121.2 122.3 121.4 120.2<br />
124 Monthly Labor Review • November 2008
��������������������������������������������������<br />
[2000 = 100]<br />
Category<br />
2007 2008<br />
Sept. Oct. Nov. Dec. Jan. Feb. Mar. Apr. May June July Aug. Sept.<br />
ALL COMMODITIES…………….................................... 121.8 123.6 127.5 127.3 129.2 129.5 133.5 137.3 141.2 145.5 147.6 143.8 139.5<br />
Foods, feeds, and beverages……………...…………… 131.8 133.2 133.4 134.4 138.1 137.8 141.8 143.7 145.0 147.7 149.9 150.8 148.3<br />
Agricultural foods, feeds, and beverages…............. 144.4 146.5 147.1 148.3 153.1 152.6 157.3 159.8 162.2 165.1 167.9 168.5 165.4<br />
Nonagricultural (fish, beverages) food products…… 103.5 103.2 102.5 103.0 104.3 104.4 106.8 107.2 105.9 108.4 109.1 111.0 109.6<br />
Industrial supplies and materials……………...………… 190.7 197.2 212.8 211.3 218.2 219.0 234.5 248.7 265.0 283.0 291.1 274.1 256.2<br />
Fuels and lubricants…...............................………… 250.0 262.4 294.8 290.3 301.9 300.0 329.0 354.6 388.3 423.7 438.2 399.4 362.4<br />
Petroleum and petroleum products…………...…… 264.4 277.7 312.2 306.7 319.6 315.6 347.5 375.8 412.2 450.3 465.6 427.2 388.9<br />
Paper and paper b<strong>as</strong>e <strong>stock</strong>s…...............................<br />
Materials <strong>as</strong>sociated with nondurable<br />
111.2 112.2 108.0 109.2 112.5 113.4 114.1 116.2 117.1 117.3 119.0 119.9 119.8<br />
supplies and materials…...............................……… 128.2 131.4 133.7 135.3 143.6 146.6 147.8 148.7 149.6 152.9 157.2 159.3 160.0<br />
Selected building materials…...............................… 116.9 115.7 115.6 116.0 115.9 113.8 114.1 114.3 116.2 119.2 121.3 122.1 122.5<br />
Unfinished metals <strong>as</strong>sociated with durable goods… 209.1 211.0 214.8 217.2 215.3 224.5 241.5 259.2 263.6 273.2 275.1 271.5 260.1<br />
Nonmetals <strong>as</strong>sociated with durable goods…........... 102.5 103.0 103.3 103.8 105.4 105.9 105.2 106.2 107.3 107.6 110.8 111.9 111.8<br />
Capital goods……………...…………………………….… 91.9 92.0 92.1 92.2 91.9 92.0 92.2 93.0 93.3 93.2 93.5 93.4 93.3<br />
Electric and electrical generating equipment…........ 106.5 106.8 107.5 107.9 107.7 108.7 109.3 111.5 111.7 112.0 112.7 113.0 112.9<br />
Nonelectrical machinery…...............................……… 87.7 87.7 87.7 87.7 87.4 87.4 87.5 88.0 88.4 88.2 88.4 88.3 88.1<br />
Automotive <strong>vehicle</strong>s, parts, and engines……………... 105.2 105.6 106.2 106.8 107.1 107.2 107.4 107.8 107.8 107.9 108.0 108.1 108.0<br />
Consumer goods, excluding automotive……………... 102.1 102.2 102.4 102.6 103.1 103.5 104.0 104.6 104.8 104.9 105.1 105.2 105.1<br />
Nondurables, manufactured…...............................… 105.0 105.1 105.3 105.5 106.5 106.8 107.5 107.9 108.0 107.9 108.1 108.4 108.1<br />
Durables, manufactured…………...………..........…… 98.8 99.0 99.2 99.3 99.6 100.0 100.4 101.1 101.3 101.5 101.7 101.7 101.8<br />
Nonmanufactured consumer goods…………...……… 103.4 103.3 103.3 103.8 104.0 104.1 104.3 105.6 105.8 106.6 106.7 106.6 106.6<br />
��������������������������������������������������������������������������<br />
[2000 = 100, unless indicated otherwise]<br />
Category<br />
2006 2007 2008<br />
Sept. Dec. Mar. June Sept. Dec. Mar. June Sept.<br />
Import air freight……………........................................... 133.1 131.2 130.7 132.3 134.2 141.8 144.4 158.7 156.8<br />
Export air freight……………...…………………………… 117.9 116.7 117.0 117.0 119.8 127.1 132.0 140.8 146.2<br />
Import air p<strong>as</strong>senger fares (Dec. 2006 = 100)…………… 130.9 125.4 122.9 144.6 140.2 135.3 131.3 171.6 161.3<br />
Export air p<strong>as</strong>senger fares (Dec. 2006 = 100)…............ 142.4 137.3 140.2 147.3 154.6 155.7 156.4 171.4 174.9<br />
Monthly Labor Review • November 2008 125
Current Labor Statistics: Productivity Data<br />
������������������������������������������������������������������������������������������������������<br />
[1992 = 100]<br />
���� 2005 2006 2007 2008<br />
III IV I II III IV I II III IV I II III<br />
��������<br />
Output per hour <strong>of</strong> all persons........................................ 135.6 135.3 136.1 136.6 135.9 135.9 135.9 137.6 139.7 139.7 140.5 141.8 142.2<br />
Compensation per hour…………………………….……… 164.1 165.8 168.0 168.1 169.0 172.6 174.7 175.5 177.0 178.9 180.6 182.2 184.3<br />
Real compensation per hour……………………………… 119.6 119.6 120.7 119.7 119.1 122.1 122.4 121.6 121.9 121.7 121.5 121.2 120.6<br />
Unit labor costs…...............................…………………… 121.1 122.6 123.5 123.1 124.3 127.0 128.5 127.5 126.7 128.1 128.5 128.6 129.6<br />
Unit nonlabor payments…………...………..........……… 131.6 132.4 133.4 136.2 136.2 133.4 134.3 137.4 139.7 139.2 140.2 140.9 143.1<br />
Implicit price deflator………………………………………<br />
����������������<br />
125.0 126.3 127.2 128.0 128.8 129.4 130.7 131.2 131.6 132.2 132.9 133.2 134.7<br />
Output per hour <strong>of</strong> all persons........................................ 134.6 134.2 135.1 135.7 135.0 135.0 135.0 136.4 138.3 138.6 139.5 140.8 141.1<br />
Compensation per hour…………………………….……… 163.2 164.7 166.8 167.1 167.9 171.7 173.7 174.1 175.5 177.8 179.5 181.1 183.1<br />
Real compensation per hour……………………………… 118.9 118.8 119.8 118.9 118.3 121.4 121.8 120.7 120.8 120.9 120.8 120.4 119.8<br />
Unit labor costs…...............................…………………… 121.2 122.7 123.5 123.2 124.4 127.1 128.7 127.7 126.9 128.3 128.7 128.6 129.8<br />
Unit nonlabor payments…………...………..........……… 133.2 134.2 135.5 138.6 138.3 134.8 135.2 138.2 140.3 139.8 141.0 141.9 144.4<br />
Implicit price deflator………………………………………<br />
�������������������������<br />
125.6 126.9 127.9 128.8 129.5 130.0 131.1 131.5 131.8 132.5 133.2 133.5 135.2<br />
Output per hour <strong>of</strong> all employees................................... 142.8 144.8 146.3 146.0 147.0 146.0 146.2 147.4 148.1 148.8 148.7 151.8 –<br />
Compensation per hour…………………………….……… 160.8 161.2 164.5 164.5 165.1 167.8 170.3 171.3 172.5 175.0 176.2 177.8 –<br />
Real compensation per hour……………………………… 117.2 116.3 118.1 117.0 116.3 118.7 119.4 118.7 118.7 119.0 118.6 118.2 –<br />
Total unit costs…...............................…………………… 113.5 111.8 112.5 113.1 112.8 115.3 116.7 116.5 116.8 117.9 118.6 117.7 –<br />
Unit labor costs............................................................. 112.6 111.4 112.4 112.6 112.3 114.9 116.5 116.2 116.5 117.6 118.5 117.1 –<br />
Unit nonlabor costs...................................................... 115.7 113.1 112.9 114.4 114.2 116.2 117.2 117.4 117.8 118.9 119.0 119.1 –<br />
Unit pr<strong>of</strong>its...................................................................... 152.2 177.4 182.5 183.1 193.0 173.9 171.8 172.5 166.8 155.9 150.3 147.0 –<br />
Unit nonlabor payments…………...………..........……… 125.5 130.3 131.5 132.8 135.3 131.6 131.8 132.2 130.9 128.8 127.4 126.6 –<br />
Implicit price deflator………………………………………<br />
��������������<br />
116.9 117.7 118.8 119.4 120.0 120.5 121.6 121.5 121.3 121.3 121.5 120.3 –<br />
Output per hour <strong>of</strong> all persons........................................ 172.9 172.8 172.6 172.7 174.5 175.4 177.0 178.7 180.6 182.5 184.0 183.1 182.6<br />
Compensation per hour…………………………….……… 166.5 165.3 170.9 169.5 170.3 174.6 176.9 176.4 176.4 179.7 181.4 183.1 185.3<br />
Real compensation per hour……………………………… 121.3 119.2 122.7 120.7 120.0 123.5 124.0 122.3 121.4 122.2 122.1 121.7 121.2<br />
Unit labor costs…...............................……………………<br />
�����������������������������������������<br />
96.3 95.6 99.0 98.2 97.6 99.5 100.0 98.7 97.6 98.5 98.6 100.0 101.5<br />
126 Monthly Labor Review • November 2008
48. Annual indexes <strong>of</strong> multifactor productivity and related me<strong>as</strong>ures, selected years<br />
����������������������������������������<br />
Item 1995 1996 1997 1998 1999 2000 2001 2002 2003 2004 2005 2006 2007<br />
Private business<br />
�������������<br />
Output per hour <strong>of</strong> all persons......…………….............. 87.4 90.0 91.7 94.3 97.2 100.0 102.8 107.1 111.2 114.5 116.8 118.0 120.2<br />
Output per unit <strong>of</strong> capital services……………………… 104.6 104.7 104.9 103.5 102.3 100.0 96.0 94.8 95.6 97.5 98.6 99.1 98.1<br />
Multifactor productivity…………………………………… 93.7 95.3 96.2 97.5 98.7 100.0 100.1 101.8 104.4 107.0 108.8 109.4 110.1<br />
Output…...............................………………………….……<br />
Inputs:<br />
79.2 82.8 87.2 91.5 96.2 100.0 100.5 102.0 105.2 109.7 113.8 117.4 120.1<br />
Labor input................................................................... 88.8 90.7 94.2 96.4 99.0 100.0 98.6 97.2 97.0 98.4 100.2 102.8 103.8<br />
Capital services…………...………..........………….…… 75.7 79.1 83.2 88.4 94.1 100.0 104.6 107.6 110.0 112.5 115.4 118.5 122.3<br />
Combined units <strong>of</strong> labor and capital input……………… 84.4 86.9 90.6 93.9 97.5 100.0 100.3 100.2 100.7 102.5 104.6 107.4 109.2<br />
Capital per hour <strong>of</strong> all persons.......................……………<br />
Private nonfarm business<br />
83.6 85.9 87.4 91.1 95.0 100.0 107.0 112.9 116.3 117.4 118.4 119.1 122.3<br />
�������������<br />
Output per hour <strong>of</strong> all persons........……………………… 88.2 90.5 92.0 94.5 97.3 100.0 102.7 107.1 111.0 114.2 116.4 117.6 119.7<br />
Output per unit <strong>of</strong> capital services……………………… 105.6 105.5 105.3 103.9 102.5 100.0 96.0 94.7 95.4 97.3 98.3 98.7 97.9<br />
Multifactor productivity…………………………………… 94.5 95.9 96.5 97.8 98.8 100.0 100.1 101.8 104.3 106.8 108.6 109.0 109.7<br />
Output…...............................………………………….……<br />
Inputs:<br />
79.3 82.8 87.2 91.5 96.3 100.0 100.5 102.1 105.2 109.6 113.7 117.4 120.1<br />
Labor input................................................................... 88.2 90.2 93.9 96.2 99.0 100.0 98.7 97.2 97.1 98.6 100.4 103.1 104.1<br />
Capital services…………...………..........………….…… 75.0 78.5 82.7 88.1 93.9 100.0 104.7 107.8 110.3 112.7 115.6 118.9 122.8<br />
Combined units <strong>of</strong> labor and capital input……………… 83.9 86.4 90.3 93.6 97.4 100.0 100.5 100.2 100.8 102.6 104.7 107.6 109.4<br />
Capital per hour <strong>of</strong> all persons......………………………… 83.5 85.8 87.3 91.0 94.9 100.0 107.0 113.1 116.4 117.4 118.4 119.1 122.4<br />
Manufacturing [1996 = 100]<br />
�������������<br />
Output per hour <strong>of</strong> all persons...………………………… 79.8 82.7 87.3 92.0 96.1 100.0 101.6 108.6 115.3 117.9 123.5 125.0 –<br />
Output per unit <strong>of</strong> capital services……………………… 98.7 98.0 100.6 100.7 100.4 100.0 93.5 92.3 93.2 95.4 98.9 100.2 –<br />
Multifactor productivity…………………………………… 90.8 91.2 93.8 95.9 96.7 100.0 98.7 102.4 105.2 108.0 108.4 110.1 –<br />
Output…...............................………………………….……<br />
Inputs:<br />
80.3 83.1 89.2 93.8 97.4 100.0 94.9 94.3 95.2 96.9 100.4 102.3 –<br />
Hours <strong>of</strong> all persons..................................................... 100.6 100.4 102.2 101.9 101.3 100.0 93.5 86.8 82.6 82.2 81.3 81.8 –<br />
Capital services…………...………..........………….…… 81.4 84.8 88.7 93.2 97.0 100.0 101.5 102.1 102.1 101.6 101.5 102.0 –<br />
Energy……………….………......................................... 113.7 110.4 108.2 105.4 105.5 100.0 90.6 89.3 84.4 84.0 91.6 86.6 –<br />
Nonenergy materials.................................................... 78.9 86.0 92.9 97.7 102.6 100.0 93.3 88.4 87.7 87.3 92.4 91.5 –<br />
Purch<strong>as</strong>ed business services....................................... 88.8 88.5 92.1 95.0 100.0 100.0 100.7 98.2 99.1 97.0 104.5 106.6 –<br />
Combined units <strong>of</strong> all factor inputs…………...………...<br />
�����������������������������������������<br />
88.5 91.1 95.1 97.8 100.7 100.0 96.2 92.1 90.5 89.7 92.7 92.9 –<br />
Monthly Labor Review • November 2008 127
Current Labor Statistics: Productivity Data<br />
49. Annual indexes <strong>of</strong> productivity, hourly compensation, unit costs, and prices, selected years<br />
������������<br />
Item<br />
Business<br />
1962 1972 1982 1992 1999 2000 2001 2002 2003 2004 2005 2006 2007<br />
���������������������������������������������������������������������� ���� ���� ���� ����� ����� ����� ����� ����� ����� ����� ����� ����� �����<br />
������������������������������������ ���� ���� ���� ����� ����� ����� ����� ����� ����� ����� ����� ����� �����<br />
�������������������������������������� ���� ���� ���� ����� ����� ����� ����� ����� ����� ����� ����� ����� �����<br />
�������������������������������������������������������� ���� ���� ���� ����� ����� ����� ����� ����� ����� ����� ����� ����� �����<br />
��������������������������������������������� ���� ���� ���� ����� ����� ����� ����� ����� ����� ����� ����� ����� �����<br />
��������������������������������������<br />
Nonfarm business<br />
���� ���� ���� ����� ����� ����� ����� ����� ����� ����� ����� ����� �����<br />
���������������������������������������������������������������������� ���� ���� ���� ����� ����� ����� ����� ����� ����� ����� ����� ����� �����<br />
������������������������������������ ���� ���� ���� ����� ����� ����� ����� ����� ����� ����� ����� ����� �����<br />
�������������������������������������� ���� ���� ���� ����� ����� ����� ����� ����� ����� ����� ����� ����� �����<br />
�������������������������������������������������������� ���� ���� ���� ����� ����� ����� ����� ����� ����� ����� ����� ����� �����<br />
��������������������������������������������� ���� ���� ���� ����� ����� ����� ����� ����� ����� ����� ����� ����� �����<br />
��������������������������������������<br />
Nonfinancial corporations<br />
���� ���� ���� ����� ����� ����� ����� ����� ����� ����� ����� ����� �����<br />
������������������������������������������������������������������� ���� ���� ���� ����� ����� ����� ����� ����� ����� ����� ����� ����� �����<br />
������������������������������������ ���� ���� ���� ����� ����� ����� ����� ����� ����� ����� ����� ����� �����<br />
�������������������������������������� ���� ���� ���� ����� ����� ����� ����� ����� ����� ����� ����� ����� �����<br />
�������������������������������������������������������� ���� ���� ���� ����� ����� ����� ����� ����� ����� ����� ����� ����� �����<br />
������������������������������������������������������������������������������� ���� ���� ���� ����� ����� ����� ����� ����� ����� ����� ����� ����� �����<br />
��������������������������������������������������������������������������� ���� ���� ���� ����� ����� ����� ����� ����� ����� ����� ����� ����� �����<br />
���������������������������������������������������������������������������������� ���� ���� ���� ����� ����� ����� ���� ���� ����� ����� ����� ����� �����<br />
��������������������������������������������� ���� ���� ���� ����� ����� ����� ����� ����� ����� ����� ����� ����� �����<br />
��������������������������������������<br />
Manufacturing<br />
���� ���� ���� ����� ����� ����� ����� ����� ����� ����� ����� ����� �����<br />
���������������������������������������������������������������������� � � � ����� ����� ����� ����� ����� ����� ����� ����� ����� �����<br />
������������������������������������ � � � ����� ����� ����� ����� ����� ����� ����� ����� ����� �����<br />
�������������������������������������� � � � ����� ����� ����� ����� ����� ����� ����� ����� ����� �����<br />
�������������������������������������������������������� � � � ����� ���� ���� ���� ���� ���� ���� ���� ���� �����<br />
��������������������������������������������� � � � ����� ����� ����� ����� ����� ����� ����� ����� ����� �<br />
�������������������������������������� � � � ����� ���� ����� ����� ���� ����� ����� ����� ����� �<br />
������������������������������������<br />
128 Monthly Labor Review • November 2008
50. Annual indexes <strong>of</strong> output per hour for selected NAICS industries<br />
[1997=100]<br />
NAICS Industry 1987 1997 1998 1999 2000 2001 2002 2003 2004 2005 2006 2007<br />
Mining<br />
21 ��������������������������� ����� ������ ������ ������ ������ ������ ������ ������ ������ ����� ����� �<br />
211 ������������������������������������ ����� ������ ������ ������ ������ ������ ������ ������ ������ ������ ������ �<br />
2111 ������������������������������������ ����� ������ ������ ������ ������ ������ ������ ������ ������ ������ ������ �<br />
212 �������������������������������������� ����� ������ ������ ������ ������ ������ ������ ������ ������ ������ ������ �<br />
2121 ����������������������������� ����� ������ ������ ������ ������ ������ ������ ������ ������ ������ ������ �<br />
2122 �������������������������������� ����� ������ ������ ������ ������ ������ ������ ������ ������ ������ ������ �<br />
���� ��������������������������������������������� ����� ������ ������ ������ ����� ����� ������ ������ ������ ������ ������ �<br />
Utilities<br />
���� �������������������������������������� ����� ������ ������ ������ ������ ������ ������ ������ ������ ������ ������ �<br />
���� ������������������������������������� ����� ������ ����� ������ ������ ������ ������ ������ ������ ������ ������ �<br />
Manufacturing<br />
��� ������������������������� ����� ������ ������ ������ ������ ������ ������ ������ ������ ������ ������ �<br />
���� ����������������������������� ����� ������ ������ ������ ������ ������ ������ ������ ������ ������ ������ �<br />
���� �������������������������������������� ����� ������ ������ ������ ������ ������ ������ ������ ������ ������ ������ �<br />
���� ����������������������������������������� ����� ������ ������ ������ ������ ������ ������ ������ ������ ������ ������ �<br />
���� ������������������������������������������������ ����� ������ ������ ������ ������ ������ ������ ������ ������ ������ ������ �<br />
���� ������������������������������� ����� ������ ������ ����� ����� ����� ������ ������ ������ ������ ������ �<br />
���� ������������������������������������������ ����� ������ ������ ������ ������ ������ ������ ������ ������ ������ ������ �<br />
���� ��������������������������������������������� ������ ������ ������ ������ ������ ������ ������ ������ ������ ������ ������ �<br />
���� ������������������������������������������� ������ ������ ������ ������ ������ ������ ������ ������ ������ ������ ������ �<br />
���� ���������������������������������� ����� ������ ������ ������ ������ ������ ������ ������ ������ ������ ������ �<br />
��� ��������������������������������������� ����� ������ ����� ����� ����� ����� ����� ����� ����� ������ ����� �<br />
���� ���������������������������� ����� ������ ����� ����� ����� ����� ����� ������ ������ ������ ������ �<br />
���� �������������������������������������� ����� ������ ����� ����� ����� ����� ����� ����� ����� ����� ����� �<br />
��� ������������������������������� ����� ������ ������ ������ ������ ������ ������ ������ ������ ������ ������ �<br />
���� ���������������������������������������� ����� ������ ������ ������ ������ ������ ������ ������ ������ ������ ������ �<br />
���� ������������������������������ ����� ������ ������ ������ ������ ������ ������ ������ ������ ������ ������ �<br />
���� �������������������������������������������� ����� ������ ������ ������ ������ ������ ������ ������ ������ ������ ������ �<br />
��� ������������������������������������ ����� ������ ����� ������ ������ ������ ������ ������ ������ ������ ������ �<br />
���� �������������������������������������� ����� ������ ����� ����� ������ ������ ������ ������ ������ ������ ������ �<br />
���� ��������������������������������������� ����� ������ ����� ������ ������ ������ ������ ������ ������ ������ ������ �<br />
��� ��������������������������� ����� ������ ������ ������ ������ ������ ������ ������ ������ ������ ������ �<br />
���� ������������������������������������ ����� ������ ����� ������ ������ ������ ������ ������ ����� ������ ������ �<br />
���� ��������������������������������� ����� ������ ������ ������ ������ ������ ������ ������ ������ ������ ������ �<br />
���� ��������������������������������������� ����� ������ ������ ����� ����� ������ ����� ����� ����� ����� ����� �<br />
��� �������������������������������������� ����� ������ ������ ������ ������ ������ ����� ����� ������ ������ ������ �<br />
���� ��������������������������������������������� ����� ������ ������ ����� ������ ������ ����� ����� ����� ������ ������ �<br />
���� ��������������������������� ����� ������ ������ ������ ������ ������ ������ ������ ������ ������ ������ �<br />
���� ������������������������������������ ����� ������ ������ ������ ������ ������ ����� ������ ������ ������ ������ �<br />
��� ������������������������������ ����� ������ ������ ������ ������ ������ ������ ������ ������ ������ ������ �<br />
���� ��������������������������������������� ����� ������ ������ ������ ������ ������ ������ ������ ������ ������ ������ �<br />
���� ������������������������������������������ ����� ������ ������ ����� ����� ������ ������ ������ ������ ������ ������ �<br />
���� ��������������������������������� ������ ������ ������ ������ ������ ������ ������ ������ ������ ������ ������ �<br />
��� Paper and paper product������������ ���� 100�0 102�� ����1 ����� ����� ����2 ����9 ����� ����� 127��� �<br />
���� ������������������������������������������ ����� ������ ������ ������ ������ ������ ������ ������ ������ ������ ������ �<br />
���� ������������������������������������ ����� ������ ������ ������ ������ ������ ������ ������ ������ ������ ������ �<br />
��� ���������������������������������������������� ����� ������ ������ ������ ������ ������ ������ ������ ������ ������ ������ �<br />
���� ���������������������������������������������� ����� ������ ������ ������ ������ ������ ������ ������ ������ ������ ������ �<br />
��� �������������������������������������� ����� ������ ������ ������ ������ ������ ������ ������ ������ ������ ������ �<br />
���� �������������������������������������� ����� ������ ������ ������ ������ ������ ������ ������ ������ ������ ������ �<br />
��� ���������������������������� ����� ������ ����� ������ ������ ������ ������ ������ ������ ������ ������ �<br />
���� ������������������������������� ����� ������ ������ ������ ������ ������ ������ ������ ������ ������ ������ �<br />
���� ��������������������������������������������� ����� ������ ������ ������ ������ ������ ������ ������ ������ ������ ������ �<br />
���� ������������������������������������ ����� ������ ����� ����� ����� ����� ����� ������ ������ ������ ������ �<br />
���� �������������������������������������� ����� ������ ����� ����� ����� ����� ����� ������ ������ ������ ������ �<br />
���� ���������������������������������������� ����� ������ ������ ������ ������ ������ ������ ������ ������ ������ ������ �<br />
���� ��������������������������������������������� ����� ������ ����� ����� ������ ������ ������ ������ ������ ������ ������ �<br />
���� ��������������������������������������������� ����� ������ ����� ������ ������ ������ ������ ������ ������ ������ ������ �<br />
��� ��������������������������������������� ����� ������ ������ ������ ������ ������ ������ ������ ������ ������ ������ �<br />
���� ��������������������������������� ����� ������ ������ ������ ������ ������ ������ ������ ������ ������ ������ �<br />
���� ������������������������������� ����� ������ ����� ������ ������ ������ ������ ������ ������ ������ ������ �<br />
��� ��������������������������������������� ����� ������ ������ ������ ������ ������ ������ ������ ������ ������ ������ �<br />
���� ���������������������������������������� ����� ������ ������ ������ ������ ����� ����� ������ ������ ������ ������ �<br />
���� ������������������������������������ ����� ������ ������ ������ ������ ������ ������ ������ ������ ������ ������ �<br />
���� �������������������������������������� ����� ������ ������ ������ ������ ����� ������ ������ ������ ������ ������ �<br />
Monthly Labor Review • November 2008 129
Current Labor Statistics: Productivity Data<br />
50. Continued - Annual indexes <strong>of</strong> output per hour for selected NAICS industries<br />
[1997=100]<br />
NAICS Industry 1987 1997 1998 1999 2000 2001 2002 2003 2004 2005 2006 2007<br />
���� ������������������������������������ 88.2 100.0 114.9 104.4 98.5 101.8 99.0 107.1 104.7 119.3 116.5 -<br />
���� ������������������������������������������ 83.0 100.0 99.0 95.6 96.6 98.6 106.9 113.6 110.6 118.9 116.3 -<br />
��� ������������������������������� 81.0 100.0 102.0 102.8 101.3 101.0 115.2 118.2 132.0 135.5 134.3 -<br />
���� �������������������������������������������������� 64.8 100.0 101.3 104.8 106.0 104.4 125.1 130.4 164.9 163.1 163.5 -<br />
���� ������������������������������������������� 79.7 100.0 100.6 93.8 96.4 97.9 96.8 93.9 88.6 90.8 86.1 -<br />
���� ��������������������������������������� ����� ������ ������ ������ ����� ����� ������ ������ ������ ������ ������ �<br />
���� ����������������������������������������� ����� ������ ������ ������ ������ ����� ������ ������ ������ ������ ������ �<br />
���� ���������������������������� 81.4 100.0 101.2 104.5 103.6 107.4 116.7 116.3 123.9 128.6 131.8 -<br />
��� ������������������������������������� 87.3 100.0 101.3 103.0 104.8 104.8 110.9 114.4 113.4 116.9 119.7 -<br />
���� ���������������������������������� 85.4 100.0 103.5 110.9 121.1 120.7 125.0 133.1 142.0 147.6 152.7 -<br />
���� ����������������������������������� 86.3 100.0 99.9 108.0 105.9 110.3 113.4 113.2 107.6 114.1 116.6 -<br />
���� ������������������������������������������� ����� ������ ������ ������ ������ ������ ������ ������ ������ ������ ������ �<br />
���� ��������������������������������������������� ����� ������ ������ ����� ����� ����� ����� ������ ����� ����� ����� �<br />
���� ��������������������������� 88.7 100.0 100.5 105.2 114.3 113.5 115.5 125.4 126.0 131.8 131.1 -<br />
���� ������������������������������������ ����� ������ ������ ������ ������ ������ ������ ������ ������ ������ ������ �<br />
���� ������������������������������������������ 76.9 100.0 99.6 104.2 108.2 108.8 114.8 115.7 114.6 116.3 117.1 -<br />
���� ������������������������������������������������ 75.5 100.0 100.9 101.0 105.5 107.3 116.1 118.3 125.3 136.5 135.5 -<br />
���� ����������������������������������������� 91.0 100.0 101.9 99.6 99.9 96.7 106.5 111.6 111.2 112.5 117.7 -<br />
��� ���������������������������� 82.3 100.0 102.9 104.7 111.5 109.0 116.6 125.2 127.0 134.1 137.4 -<br />
���� ������������������������������������������������� ����� ������ ������ ����� ������ ������ ������ ������ ������ ������ ������ �<br />
���� ����������������������������������� 75.1 100.0 95.1 105.8 130.0 105.8 117.6 117.0 126.5 122.4 135.3 -<br />
���� ��������������������������������������������� 87.0 100.0 106.3 110.0 101.3 94.5 97.8 104.7 106.5 115.1 122.3 -<br />
���� ���������������������������������������������� 84.0 100.0 106.2 110.2 107.9 110.8 118.6 130.0 132.8 137.1 133.4 -<br />
���� ����������������������������������� 85.1 100.0 99.1 100.3 106.1 103.3 112.7 115.2 117.1 127.3 128.3 -<br />
���� �������������������������������������������� ����� ������ ������ ������ ������ ������ ������ ������ ������ ������ ������ �<br />
���� ���������������������������������������� 83.5 100.0 103.7 106.0 113.7 110.5 117.9 128.1 127.1 138.4 143.8 -<br />
��� ����������������������������������������� 28.4 100.0 118.4 149.5 181.8 181.4 188.0 217.2 244.3 259.6 282.2 -<br />
���� ����������������������������������������� 11.0 100.0 140.4 195.9 235.0 252.2 297.4 373.4 415.1 543.3 715.7 -<br />
���� ����������������������������������� 39.8 100.0 107.1 135.4 164.1 152.9 128.2 143.1 148.4 143.7 178.2 -<br />
���� ������������������������������������ ����� ������ ������ ������ ������ ������ ������ ������ ������ ������ ������ �<br />
���� �������������������������������������������� 17.0 100.0 125.8 173.9 232.2 230.0 263.1 321.6 360.0 381.6 380.4 -<br />
���� ������������������������������������ 70.2 100.0 102.3 106.7 116.7 119.3 118.1 125.3 145.4 146.6 150.6 -<br />
3346 Magnetic media manufacturing and reproduction� 85.7 100.0 106.4 108.9 105.8 99.8 110.4 126.1 142.6 142.1 137.7 -<br />
��� ������������������������������������������� 75.5 100.0 103.9 106.6 111.5 111.4 113.4 117.2 123.3 130.0 129.4 -<br />
���� ��������������������������������������� 91.1 100.0 104.4 102.8 102.0 106.7 112.4 111.4 122.7 130.3 136.7 -<br />
���� ���������������������������������� 73.3 100.0 105.2 104.0 117.2 124.6 132.3 146.7 159.6 164.5 173.2 -<br />
���� ����������������������������������� 68.7 100.0 100.2 98.7 99.4 101.0 101.8 103.4 110.8 118.5 118.1 -<br />
���� ��������������������������������������������� 78.8 100.0 105.8 114.7 119.7 113.1 114.0 116.2 115.6 121.6 115.7 -<br />
��� ������������������������������������ 81.6 100.0 109.7 118.0 109.4 113.6 127.4 137.5 134.9 140.9 142.4 -<br />
���� ������������������������������� 75.4 100.0 113.4 122.6 109.7 110.0 126.0 140.7 142.1 148.4 163.8 -<br />
���� ������������������������������������������ 85.0 100.0 102.9 103.1 98.8 88.7 105.4 109.8 110.7 114.2 110.9 -<br />
���� ���������������������������������� 78.7 100.0 104.9 110.0 112.3 114.8 130.5 137.0 138.0 144.1 143.7 -<br />
���� �������������������������������������� 87.2 100.0 119.1 120.8 103.4 115.7 118.6 119.0 113.2 125.0 117.9 -<br />
���� ������������������������������������ 55.6 100.0 103.3 116.5 118.5 126.1 146.1 139.8 131.5 137.3 148.0 -<br />
���� ������������������������������������ 95.5 100.0 99.3 112.0 122.0 121.5 131.0 133.9 138.7 131.7 127.3 -<br />
���� ���������������������������������������� 73.8 100.0 111.5 113.8 132.4 140.2 150.9 163.0 168.3 184.1 197.8 -<br />
��� ���������������������������������������� 84.8 100.0 102.0 101.6 101.4 103.4 112.6 117.0 118.4 125.0 127.8 -<br />
���� ��������������������������������������������� 85.2 100.0 102.2 103.1 101.9 105.5 111.8 114.7 113.6 120.8 124.0 -<br />
���� ����������������������������������������� 85.8 100.0 100.0 98.2 100.2 98.0 115.9 125.2 130.7 134.9 134.4 -<br />
���� ������������������������������������������ 86.3 100.0 106.9 102.0 99.5 105.0 110.2 110.0 121.3 128.3 130.8 -<br />
��� �������������������������������������� 81.1 100.0 105.2 107.8 114.7 116.6 124.2 132.7 134.9 144.6 149.8 -<br />
���� ��������������������������������������� 76.3 100.0 109.0 111.1 115.5 120.7 129.1 138.9 139.5 148.5 152.8 -<br />
���� �����������������������������������������<br />
Wholesale trade<br />
85.4 100.0 102.1 105.0 113.6 111.8 118.0 124.7 128.6 137.8 143.2 -<br />
�� ������������������������������� ����� ������ ������ ������ ������ ������ ������ ������ ������ ������ ������ ������<br />
��� ������������������������������ 62.3 100.0 107.1 119.2 125.0 128.9 140.2 146.6 161.5 167.4 174.5 178.4<br />
���� ������������������������������������� 74.5 100.0 106.4 120.4 116.7 120.0 133.4 137.6 143.5 146.5 162.7 161.8<br />
���� ������������������������������������� ����� ������ ����� ������ ������ ������ ������ ������ ������ ������ ������ ������<br />
���� ����������������������������������������� 109.1 100.0 105.4 109.3 107.7 116.6 123.9 133.0 139.4 140.2 135.4 124.5<br />
���� ��������������������������������� 28.0 100.0 125.5 162.0 181.9 217.9 264.9 299.1 352.8 402.0 447.3 508.5<br />
���� ���������������������������������� 101.7 100.0 100.9 94.0 93.9 94.4 96.3 97.5 106.3 104.2 99.9 94.4<br />
���� ������������������������������� 42.8 100.0 105.9 127.5 152.8 147.6 159.5 165.7 194.1 204.6 222.1 235.1<br />
���� ���������������������������������� 82.2 100.0 101.8 104.4 103.7 100.5 102.6 103.9 107.3 104.5 105.6 105.8<br />
���� ����������������������������������� 74.1 100.0 104.3 102.9 105.5 102.9 100.3 103.4 112.4 117.6 121.2 121.5<br />
���� �������������������������������������� 89.8 100.0 100.8 113.7 114.7 116.8 124.6 119.6 135.0 135.5 122.3 118.4<br />
��� ������������������������������� ����� ������ ����� ������ ������ ������ ������ ������ ������ ������ ������ ������<br />
130 Monthly Labor Review • November 2008
50. Continued - Annual indexes <strong>of</strong> output per hour for selected NAICS industries<br />
[1997=100]<br />
NAICS Industry 1987 1997 1998 1999 2000 2001 2002 2003 2004 2005 2006 2007<br />
���� ������������������������������������ 85.6 100.0 98.4 100.1 100.9 104.6 116.6 119.7 130.9 141.7 136.9 146.5<br />
���� �������������������������������� 70.7 100.0 94.2 93.1 85.9 84.9 89.8 100.2 105.8 112.1 109.7 104.3<br />
���� ����������������������������������� ����� ������ ������ ������ ������ ������ ������ ������ ������ ������ ������ ������<br />
���� ��������������������������������������� 87.9 100.0 101.1 101.0 102.4 101.9 98.6 104.9 104.1 103.4 103.8 109.7<br />
���� ������������������������������������� ����� ������ ����� ������ ������ ������ ����� ����� ������ ������ ������ ������<br />
���� ���������������������������� 90.4 100.0 97.1 93.3 87.9 85.3 89.1 92.2 91.2 87.4 85.1 86.4<br />
���� ���������������������������� 84.4 100.0 88.5 102.9 138.1 140.6 153.6 151.1 163.2 153.3 149.4 149.1<br />
���� ���������������������������������� 99.3 100.0 106.5 105.6 108.4 106.4 106.8 107.9 103.1 104.0 107.4 108.5<br />
���� ��������������������������������������� 111.2 100.0 105.4 106.8 115.0 111.9 106.1 109.8 120.7 124.1 121.9 117.1<br />
��� ���������������������������������������������� 64.3 100.0 102.4 112.3 120.1 110.7 109.8 104.5 101.6 91.5 95.0 98.3<br />
���� ����������������������������������������������<br />
Retail trade<br />
64.3 100.0 102.4 112.3 120.1 110.7 109.8 104.5 101.6 91.5 95.0 98.3<br />
����� ������������������������������ ����� ������ ������ ������ ������ ������ ������ ������ ������ ������ ������ ������<br />
��� ����������������������������������������� 78.4 100.0 106.4 115.1 114.3 116.0 119.9 124.3 127.3 126.7 129.3 132.2<br />
���� ��������������������������������� 79.2 100.0 106.5 116.3 113.7 115.5 117.2 119.5 124.7 123.5 125.8 129.8<br />
���� �������������������������������������� 74.1 100.0 109.6 114.8 115.3 124.6 133.6 133.8 143.3 134.6 142.6 146.9<br />
���� ���������������������������������������������� 71.8 100.0 105.1 107.6 108.4 101.3 107.7 115.1 110.1 115.5 115.9 112.0<br />
��� �������������������������������������������� 75.1 100.0 104.1 110.8 115.9 122.4 129.3 134.6 146.7 150.5 158.2 168.7<br />
���� ��������������������������������� 77.3 100.0 104.3 107.5 112.0 119.7 125.2 128.8 139.2 142.3 151.1 156.6<br />
���� ������������������������������������ 71.3 100.0 104.1 115.2 121.0 126.1 134.9 142.6 156.8 161.4 168.3 184.6<br />
��� ����������������������������������������� 38.0 100.0 122.6 150.6 173.7 196.7 233.5 292.7 334.1 367.5 412.0 471.1<br />
���� ����������������������������������������� 38.0 100.0 122.6 150.6 173.7 196.7 233.5 292.7 334.1 367.5 412.0 471.1<br />
��� ����������������������������������������������� 75.8 100.0 107.4 113.8 113.3 116.8 120.8 127.1 134.6 134.8 137.9 142.2<br />
���� ��������������������������������������������� 77.6 100.0 108.3 115.3 115.1 116.7 121.3 127.4 134.0 134.9 138.0 140.0<br />
4442 Lawn and garden equipment and supplies stores� 66.9 100.0 102.4 105.5 103.1 118.4 118.3 125.7 140.1 134.7 138.3 162.1<br />
��� ������������������������������������ 110.8 100.0 99.9 101.9 101.0 103.8 104.7 107.2 112.9 117.9 120.6 123.8<br />
���� ������������������������������� 111.1 100.0 99.6 102.5 101.1 103.3 104.8 106.7 112.2 116.8 118.2 120.6<br />
���� ����������������������������������� 138.5 100.0 100.5 96.4 98.5 108.2 105.3 112.2 120.3 125.3 139.4 145.4<br />
���� ���������������������������������������� 93.6 100.0 104.6 99.1 105.7 107.1 110.1 117.0 127.8 139.8 146.1 156.8<br />
��� ���������������������������������������� ����� ������ ������ ������ ������ ������ ������ ������ ������ ������ ������ ������<br />
���� ���������������������������������������� ����� ������ ������ ������ ������ ������ ������ ������ ������ ������ ������ ������<br />
��� ��������������������������������� 83.9 100.0 106.7 110.7 107.7 112.9 125.1 119.9 122.2 124.7 124.9 129.3<br />
���� ��������������������������������� 83.9 100.0 106.7 110.7 107.7 112.9 125.1 119.9 122.2 124.7 124.9 129.3<br />
��� ���������������������������������������������� 66.3 100.0 106.3 114.0 123.5 126.4 131.3 138.9 139.1 147.6 162.4 176.6<br />
���� �������������������������������� 67.1 100.0 108.7 114.2 125.0 130.3 136.0 141.8 140.9 153.0 169.4 186.9<br />
���� ����������������������������� 65.3 100.0 94.2 104.9 110.0 111.5 125.2 132.5 124.8 132.0 145.1 141.6<br />
���� ���������������������������������������������� ����� ������ ������ ������ ������ ������ ������ ������ ������ ������ ������ ������<br />
��� ������������������������������������������������ 74.9 100.0 107.9 114.0 121.1 127.1 127.6 131.5 151.1 163.5 170.5 167.8<br />
���� ����������������������������������������������� 73.2 100.0 111.5 119.8 129.4 134.5 136.0 141.1 166.0 179.3 191.4 189.2<br />
���� ������������������������������������������ ����� ������ ������ ������ ������ ������ ������ ������ ������ ������ ������ ������<br />
��� ������������������������������������� 73.5 100.0 105.3 113.4 120.2 124.8 129.1 136.9 140.7 145.0 149.8 152.5<br />
���� �������������������������������� ����� ������ ������ ������ ������ ������ ������ ������ ������ ������ ������ ������<br />
���� ���������������������������������������� ����� ������ ������ ������ ������ ������ ������ ������ ������ ������ ������ ������<br />
��� ���������������������������������������� 65.1 100.0 108.9 111.3 114.1 112.6 119.1 126.1 130.8 139.2 155.0 160.8<br />
���� ���������������������������� ����� ������ ������ ������ ������ ������ ������ ������ ������ ������ ������ ������<br />
���� ������������������������������������������������� 61.4 100.0 111.5 119.2 127.3 132.3 141.5 153.9 172.8 182.4 204.8 224.5<br />
���� ����������������������������������� 64.5 100.0 119.1 113.4 116.5 121.9 142.0 149.7 152.6 156.6 167.6 182.0<br />
���� ������������������������������������������� 68.3 100.0 105.3 103.0 104.4 96.9 94.4 99.9 96.9 101.6 114.0 115.4<br />
��� ���������������������������������� 50.7 100.0 114.3 128.9 152.2 163.6 182.1 195.5 215.5 220.6 261.9 290.8<br />
���� ���������������������������������������������� 39.4 100.0 120.2 142.6 160.2 179.6 212.7 243.6 273.0 290.1 355.9 397.2<br />
���� ������������������������������������ ����� ������ ������ ������ ������ ����� ����� ������ ������ ������ ������ ������<br />
���� ����������������������������������������<br />
Transportation and warehousing<br />
70.8 100.0 101.9 104.3 122.5 127.9 135.1 127.0 130.3 119.6 127.5 138.4<br />
��� ���������������������������������� 81.1 100.0 97.6 98.2 98.1 91.9 102.1 112.8 126.9 135.5 142.5 -<br />
������ ���������������������������������� ����� ������ ������ ������ ������ ������ ������ ������ ������ ������ ������ �<br />
����� ���������������������������������������������� 85.7 100.0 99.4 99.1 101.9 103.2 107.0 110.7 110.7 113.2 112.3 -<br />
����� ������������������������������������������� 106.7 100.0 91.0 96.1 94.8 84.0 81.6 86.2 88.6 88.3 87.0 -<br />
��� ���������������������������������� 90.9 100.0 101.6 102.8 105.5 106.3 106.4 107.8 110.0 111.2 111.3 -<br />
���� ���������������������������������� 90.9 100.0 101.6 102.8 105.5 106.3 106.4 107.8 110.0 111.2 111.3 -<br />
��� ����������������������������������� 148.3 100.0 112.6 117.6 122.0 123.4 131.1 134.0 126.8 125.1 128.6 -<br />
��� ����������������������������������� - 100.0 106.4 107.7 109.3 115.3 122.1 124.8 122.5 124.9 122.3 -<br />
���� ����������������������������������� - 100.0 106.4 107.7 109.3 115.3 122.1 124.8 122.5 124.9 122.3 -<br />
����� ��������������������������������������� � ������ ������ ������ ������ ������ ������ ������ ������ ������ ������ �<br />
����� �������������������������������������������<br />
Information<br />
- 100.0 97.9 103.4 95.4 85.4 87.2 92.3 99.3 97.5 88.5 -<br />
511 Publishing industries, except internet 64.1 100.0 116.1 116.3 117.1 116.6 117.2 126.4 130.7 136.5 142.7 -<br />
Monthly Labor Review • November 2008 131
Current Labor Statistics: Productivity Data<br />
50. Continued - Annual indexes <strong>of</strong> output per hour for selected NAICS industries<br />
[1997=100]<br />
NAICS Industry 1987 1997 1998 1999 2000 2001 2002 2003 2004 2005 2006 2007<br />
���� ���������������������������������������������� 105.0 100.0 103.9 104.1 107.7 105.8 104.7 109.5 106.6 107.6 110.8 -<br />
���� ���������������������������������� 10.2 100.0 134.8 129.2 119.2 117.4 122.1 138.1 160.6 173.7 177.0 -<br />
����� ������������������������������������������� 90.7 100.0 99.8 101.8 106.5 101.6 99.8 100.4 103.6 102.4 105.7 -<br />
��� ���������������������������������������� 99.5 100.0 100.8 102.9 103.6 99.2 104.0 107.9 112.5 117.7 125.5 -<br />
���� ������������������������������������������ 98.1 100.0 91.5 92.6 92.1 89.6 95.1 94.6 96.6 100.9 109.5 -<br />
���� ��������������������������������������������� 105.6 100.0 136.2 139.1 141.2 128.1 129.8 146.0 158.7 164.6 169.9 -<br />
���� ����������������������������������������� 56.9 100.0 107.7 116.7 122.7 116.7 124.1 130.5 131.7 138.2 146.2 -<br />
���� ������������������������������������������� 75.6 100.0 110.5 145.2 152.8 191.9 217.9 242.6 292.2 381.9 435.9 -<br />
���� ������������������������������������������� ������ ������ ����� ����� ����� ����� ����� ������ ������ ������ ������ �<br />
Finance and insurance<br />
����� �������������������������������� ����� ������ ����� ����� ������ ����� ������ ������ ������ ������ ������ �<br />
������<br />
Real estate and rental and le<strong>as</strong>ing<br />
���������������������������������� ����� ������ ������ ������ ������ ������ ������ ������ ������ ������ ������ �<br />
����� ����������������������������������������������� 60.3 100.0 115.4 120.9 121.7 113.5 114.0 115.8 136.6 145.1 162.2 -<br />
����� ��������������������������������������<br />
Pr<strong>of</strong>essional and technical services<br />
77.0 100.0 113.2 129.4 134.9 133.3 130.3 148.5 154.5 144.2 176.4 -<br />
������ ������������������������������������� 82.9 100.0 107.6 105.8 100.9 94.4 111.4 110.0 99.9 103.6 99.7 -<br />
����� ������������������������������������ 90.0 100.0 111.4 106.8 107.6 111.0 107.6 112.6 118.3 120.8 119.1 -<br />
����� ���������������������������������� 90.2 100.0 98.2 98.0 102.0 100.1 100.5 100.5 107.8 115.4 116.2 -<br />
����� ���������������������������������� ����� ������ ����� ����� ������ ������ ������ ������ ������ ������ ������ �<br />
������ ����������������������������������������<br />
Administrative and w<strong>as</strong>te services<br />
98.1 100.0 124.8 109.8 108.9 102.2 97.6 104.1 93.0 93.5 95.3 -<br />
����� �������������������������������������� - 100.0 86.8 93.2 89.8 99.6 116.8 115.4 119.8 115.9 122.9 -<br />
����� ������������������������������� ����� ������ ������ ������ ������ ������ ������ ������ ������ ������ ������ �<br />
����� �����������������������������������<br />
Health care and social <strong>as</strong>sistance<br />
75.1 100.0 95.3 98.6 101.0 102.1 105.6 118.8 116.6 121.5 115.6 -<br />
���� ������������������������������������������� - 100.0 118.8 124.7 131.9 135.3 137.6 140.8 140.8 137.9 140.1 -<br />
������ ����������������������������������� - 100.0 117.2 121.4 127.4 127.7 123.1 128.6 130.7 126.0 128.2 -<br />
������ ��������������������������������������<br />
Arts, entertainment, and recreation<br />
- 100.0 121.4 129.7 139.9 148.3 163.3 160.0 153.5 154.0 156.3 -<br />
����� ����������������������������������� ������ ������ ������ ������ ������ ����� ������ ������ ������ ������ ����� �<br />
����� ������������������������������� ������ ������ ����� ����� ����� ����� ����� ������ ������ ������ ������ �<br />
Accommodation and food services<br />
���� ����������������������������������� 85.1 100.0 100.1 105.6 111.8 107.6 112.1 114.4 120.4 115.0 111.8 -<br />
��� ����������������������������������������� ����� ������ ������ ������ ������ ������ ������ ������ ������ ������ ������ ������<br />
���� ������������������������������������� 92.1 100.0 100.9 100.8 103.0 103.6 104.4 104.2 104.8 105.2 106.0 105.1<br />
���� ���������������������������������������� 96.5 100.0 101.2 100.4 102.0 102.5 102.7 105.4 106.8 107.5 109.8 108.6<br />
���� ����������������������������������� 89.9 100.0 100.6 105.2 115.0 115.3 114.9 117.6 118.0 119.2 118.7 120.2<br />
���� ������������������������������������������� ������ ������ ����� ����� ������ ����� ������ ������ ������ ������ ������ ������<br />
Other services<br />
���� ����������������������������������������� 85.9 100.0 103.6 106.1 109.4 108.9 103.7 104.1 112.0 111.9 112.8 -<br />
����� ������������������������������������������� 83.5 100.0 108.6 108.6 108.2 114.6 110.4 119.7 125.0 129.9 122.3 -<br />
����� ������������������������������������������ 103.7 100.0 106.8 103.3 94.8 91.8 94.6 95.7 92.9 93.2 99.7 -<br />
���� ����������������������������������������� 97.1 100.0 100.1 105.0 107.6 110.9 112.5 103.8 110.6 120.5 119.6 -<br />
����� ������������������������������� 95.8 100.0 69.3 76.3 73.8 81.2 100.5 100.5 102.0 112.4 114.4 -<br />
NOTE: D<strong>as</strong>h indicates data are not available.<br />
132 Monthly Labor Review • November 2008
���������������������������������������������������������������������������������������<br />
[Percent]<br />
2006 2007 2008<br />
������� 2006 2007 I II III IV I II III IV I<br />
United States……… 4.6 4.6 4.7 4.7 4.7 4.4 4.5 4.5 4.7 4.8 4.9<br />
Canada……………… 5.5 5.3 5.7 5.4 5.6 5.4 5.4 5.3 5.2 5.2 5.2<br />
Australia…………… 4.8 4.4 5.0 4.9 4.7 4.5 4.5 4.3 4.3 4.3 4.1<br />
Japan………………… 4.2 3.9 4.2 4.2 4.2 4.1 4.0 3.8 3.8 3.9 3.9<br />
France……………… 9.5 8.6 9.8 9.7 9.5 9.2 9.0 8.8 8.5 8.2 8.1<br />
Germany…………… 10.4 8.7 11.1 10.6 10.1 9.6 9.3 8.9 8.5 8.2 7.7<br />
Italy………………… 6.9 6.1 7.3 6.9 6.7 6.4 6.3 6.1 6.0 6.0 -<br />
Netherlands………… 3.9 3.2 4.3 3.9 3.8 3.8 3.6 3.2 3.0 3.0 -<br />
Sweden……………… 7.0 6.1 7.3 7.3 6.7 6.5 6.4 6.1 5.8 5.9 5.8<br />
United Kingdom…… 5.5 5.4 5.3 5.5 5.6 5.5 5.5 5.4 5.4 5.2 -<br />
NOTE: D<strong>as</strong>h indicates data not available.<br />
Quarterly figures for France, Germany, Italy, and the Netherlands are<br />
calculated by applying annual adjustment factors to current published data<br />
and therefore should be viewed <strong>as</strong> less precise indicators <strong>of</strong> unemployment<br />
under U.S. concepts than the annual figures. Quarterly figures for Sweden<br />
are BLS se<strong>as</strong>onally adjusted estimates derived from Swedish not<br />
se<strong>as</strong>onally adjusted data.<br />
For further qualifications and historical annual data, see the BLS report<br />
Comparative Civilian Labor Force Statistics, 10 Countries (on the<br />
Internet at http://www.bls.gov/fls/flscomparelf.htm ). For monthly<br />
unemployment rates, <strong>as</strong> well <strong>as</strong> the quarterly and annual rates published in<br />
this table, see the BLS report Unemployment rates in 10 countries, civilian<br />
labor force b<strong>as</strong>is, approximating U.S. concepts, se<strong>as</strong>onally adjusted (on the<br />
Internet at http://www.bls.gov/fls/flsjec.pdf ). Unemployment rates may<br />
differ between the two reports mentioned, because the former is updated<br />
semi-annually, where<strong>as</strong> the latter is updated monthly and reflects the most<br />
recent revisions in source data.<br />
Monthly Labor Review • November 2008 133
Current Labor Statistics: International Comparisons<br />
52. Annual data: employment status <strong>of</strong> the working-age population, approximating U.S. concepts, 10 countries<br />
[Numbers in thousands]<br />
Employment status and country<br />
Civilian labor force<br />
1997 1998 1999 2000 2001 2002 2003 2004 2005 2006 2007<br />
������������������������������� 136,297 137,673 139,368 142,583 143,734 144,863 146,510 147,<strong>401</strong> 149,320 151,428 153,124<br />
�������������������������� 14,884 15,135 15,403 15,637 15,891 16,366 16,733 16,955 17,108 17,351 17,696<br />
A���������������������������� 9,204 9,339 9,414 9,590 9,744 9,893 10,079 10,221 10,506 10,699 10,948<br />
�������������������������� 67,200 67,240 67,090 66,990 66,860 66,240 66,010 65,770 65,850 65,960 66,080<br />
�������������������������� ������ ������ ������ ������ ������ ������ ������ ������ ������ ������ ������<br />
�������������������������� ������ ������ ������ ������ ������ ������ ������ ������ ������ ������ �<br />
��������������������������� 22,753 23,004 23,176 23,361 23,524 23,728 24,020 24,084 24,179 24,395 24,459<br />
����������������������������� 7,612 7,744 7,881 8,052 8,199 8,345 8,379 8,439 8,459 8,541 8,686<br />
�������������������������� 4,414 4,<strong>401</strong> 4,423 4,482 4,522 4,537 4,557 4,571 4,694 4,748 4,823<br />
������������������������������ ������ ������ ������ ������ ������ ������ ������ ������ ������ ������ ������<br />
Participation rate 1<br />
������������������������������� 67.1 67.1 67.1 67.1 66.8 66.6 66.2 66.0 66.0 66.2 66.0<br />
�������������������������� 65.1 65.4 65.9 66.0 66.1 67.1 67.7 67.7 67.4 67.4 67.7<br />
A���������������������������� 64.3 64.3 64.0 64.4 64.4 64.3 64.6 64.6 65.3 65.6 66.0<br />
�������������������������� 63.2 62.8 62.4 62.0 61.6 60.8 60.3 60.0 60.0 60.0 60.0<br />
�������������������������� ���� ���� ���� ���� ���� ���� ���� ���� ���� ���� ����<br />
�������������������������� ���� ���� ���� ���� ���� ���� ���� ���� ���� ���� �<br />
��������������������������� 47.3 47.7 47.9 48.1 48.3 48.5 49.1 49.1 48.7 48.9 48.6<br />
����������������������������� 61.1 61.8 62.5 63.4 64.0 64.7 64.6 64.8 64.7 65.1 65.9<br />
�������������������������� 63.2 62.8 62.7 63.7 63.6 63.9 63.8 63.6 64.8 65.0 65.3<br />
������������������������������ ���� ���� ���� ���� ���� ���� ���� ���� ���� ���� ����<br />
Employed<br />
������������������������������� 129,558 131,463 133,488 136,891 136,933 136,485 137,736 139,252 141,730 144,427 146,047<br />
�������������������������� 13,637 13,973 14,331 14,681 14,866 15,223 15,586 15,861 16,080 16,393 16,767<br />
A���������������������������� 8,444 8,618 8,762 8,989 9,086 9,264 9,480 9,668 9,975 10,186 10,470<br />
�������������������������� 64,900 64,450 63,920 63,790 63,460 62,650 62,510 62,640 62,910 63,210 63,510<br />
�������������������������� ������ ������ ������ ������ ������ ������ ������ ������ ������ ������ ������<br />
�������������������������� ������ ������ ������ ������ ������ ������ ������ ������ ������ ������ �<br />
��������������������������� 20,169 20,370 20,617 20,973 21,359 21,666 21,972 22,124 22,290 22,721 22,953<br />
����������������������������� 7,189 7,408 7,605 7,813 8,014 8,114 8,069 8,052 8,056 8,205 8,408<br />
�������������������������� 3,969 4,033 4,110 4,222 4,295 4,303 4,293 4,271 4,334 4,416 4,530<br />
������������������������������ ������ ������ ������ ������ ������ ������ ������ ������ ������ ������ ������<br />
Employment-population ratio 2<br />
������������������������������� 63.8 64.1 64.3 64.4 63.7 62.7 62.3 62.3 62.7 63.1 63.0<br />
�������������������������� 59.6 60.4 61.3 62.0 61.9 62.4 63.1 63.3 63.4 63.6 64.2<br />
A���������������������������� 59.0 59.3 59.6 60.3 60.0 60.2 60.7 61.1 62.0 62.5 63.1<br />
�������������������������� 61.0 60.2 59.4 59.0 58.4 57.5 57.1 57.1 57.3 57.5 57.6<br />
�������������������������� ���� ���� ���� ���� ���� ���� ���� ���� ���� ���� ����<br />
�������������������������� ���� ���� ���� ���� ���� ���� ���� ���� ���� ���� �<br />
��������������������������� 41.9 42.2 42.6 43.2 43.8 44.3 44.9 45.1 44.9 45.5 45.6<br />
����������������������������� 57.7 59.1 60.3 61.5 62.6 62.9 62.2 61.8 61.6 62.5 63.8<br />
�������������������������� 56.8 57.6 58.3 60.0 60.4 60.6 60.1 59.4 59.9 60.4 61.3<br />
������������������������������ ���� ���� ���� ���� ���� ���� ���� ���� ���� ���� ����<br />
Unemployed<br />
������������������������������� 6,739 6,210 5,880 5,692 6,801 8,378 8,774 8,149 7,591 7,001 7,078<br />
�������������������������� 1,248 1,162 1,072 956 1,026 1,143 1,147 1,093 1,028 958 929<br />
A���������������������������� 759 721 652 602 658 629 599 553 531 512 478<br />
�������������������������� 2,300 2,790 3,170 3,200 3,400 3,590 3,500 3,130 2,940 2,750 2,570<br />
�������������������������� ����� ����� ����� ����� ����� ����� ����� ����� ����� ����� �����<br />
�������������������������� ����� ����� ����� ����� ����� ����� ����� ����� ����� ����� �<br />
��������������������������� 2,584 2,634 2,559 2,388 2,164 2,062 2,048 1,960 1,889 1,673 1,506<br />
����������������������������� 423 337 277 239 186 231 310 387 402 336 278<br />
�������������������������� 445 368 313 260 227 234 264 300 361 332 293<br />
������������������������������ ����� ����� ����� ����� ����� ����� ����� ����� ����� ����� �����<br />
Unemployment rate<br />
������������������������������� 4.9 4.5 4.2 4.0 4.7 5.8 6.0 5.5 5.1 4.6 4.6<br />
�������������������������� 8.4 7.7 7.0 6.1 6.5 7.0 6.9 6.4 6.0 5.5 5.3<br />
A���������������������������� 8.3 7.7 6.9 6.3 6.8 6.4 5.9 5.4 5.1 4.8 4.4<br />
�������������������������� 3.4 4.1 4.7 4.8 5.1 5.4 5.3 4.8 4.5 4.2 3.9<br />
�������������������������� ���� ���� ���� ��� ��� ��� ��� ��� ��� ��� ���<br />
�������������������������� ��� ��� ��� ��� ��� ��� ��� ���� ���� ���� ���<br />
��������������������������� 11.4 11.5 11.0 10.2 9.2 8.7 8.5 8.1 7.8 6.9 6.2<br />
����������������������������� 5.6 4.4 3.5 3.0 2.3 2.8 3.7 4.6 4.8 3.9 3.2<br />
�������������������������� 10.1 8.4 7.1 5.8 5.0 5.2 5.8 6.6 7.7 7.0 6.1<br />
������������������������������ ��� ��� ��� ��� ��� ��� ��� ��� ��� ��� ���<br />
1<br />
��������������������������������������������������������<br />
2<br />
�������������������������������������������������������<br />
NOTE: D<strong>as</strong>h indicates data not available.<br />
<strong>The</strong>re are breaks in series for the United States (1998, 1999, 2000, 2003, 2004), Australia<br />
(2001), Germany (1999, 2005), the Netherlands (2000), and Sweden (2005). For further<br />
qualifications and historical annual data, see the BLS report �����������<br />
134 Monthly Labor Review • November 2008<br />
�������� ����� ����� ����������� �� ��������� (on the Internet at<br />
http://www.bls.gov/fls/flscomparelf.htm). Unemployment rates may differ from those<br />
in the BLS report ������������ ����� �� �� ���������� �������� ����� ����� ������<br />
������������� ���� ��������� ���������� �������� (on the Internet at<br />
http://www.bls.gov/fls/flsjec.pdf�� ������� ��� ������ �� ������� ��������������<br />
where<strong>as</strong> the latter is updated monthly and reflects the most recent revisions in source<br />
data.
53. Annual indexes <strong>of</strong> manufacturing productivity and related me<strong>as</strong>ures, 16 economies<br />
[1996 = 100]<br />
Me<strong>as</strong>ure and economy 1980 1990 1993 1994 1995 1997 1998 1999 2000 2001 2002 2003 2004 2005 2006 2007<br />
Output per hour<br />
���������������������� ���� ���� ���� ���� ���� ����� ����� ����� ����� ����� ����� ����� ����� ����� ����� �����<br />
������������������� ���� ���� ���� ���� ����� ����� ����� ����� ����� ����� ����� ����� ����� ����� ����� �����<br />
A�������������������� ���� ���� ���� ���� ���� ����� ����� ����� ����� ����� ����� ����� ����� ����� ����� �����<br />
������������������ ���� ���� ���� ���� ���� ����� ����� ����� ����� ����� ����� ����� ����� ����� ����� �����<br />
����������������������� � ���� ���� ���� ���� ����� ����� ����� ����� ����� ����� ����� ����� ����� ����� �����<br />
������������������ ���� ���� ���� ���� ���� ����� ����� ����� ����� ����� ����� ����� ����� ����� ����� �����<br />
��������������������� ���� ���� ���� ���� ���� ����� ����� ����� ����� ����� ����� ����� ����� ����� ����� �����<br />
������������������ ���� ���� ���� ����� ����� ����� ����� ����� ����� ����� ����� ����� ����� ����� ����� �����<br />
������������������ ���� ���� ���� ���� ���� ����� ����� ����� ����� ����� ����� ����� ����� ����� ����� �����<br />
��������������������� ���� ���� ���� ���� ���� ����� ����� ����� ����� ����� ����� ����� ����� ����� ����� �����<br />
��������������������� ���� ���� ���� ���� ���� ����� ����� ����� ����� ����� ����� ����� ����� ����� ����� �����<br />
����������������������� ���� ���� ���� ���� ���� ����� ����� ����� ����� ����� ����� ����� ����� ����� ����� �����<br />
������������������ ���� ���� ���� ���� ���� ����� ���� ����� ����� ����� ����� ����� ����� ����� ����� �����<br />
������������������� ���� ���� ���� ���� ����� ����� ����� ����� ����� ����� ����� ����� ����� ����� ����� �����<br />
������������������� ���� ���� ���� ���� ���� ����� ����� ����� ����� ����� ����� ����� ����� ����� ����� �����<br />
����������������������� ���� ���� ����� ����� ����� ����� ����� ����� ����� ����� ����� ����� ����� ����� ����� �����<br />
Output<br />
������������������������ ���� ���� ���� ���� ���� ����� ����� ����� ����� ����� ����� ����� ����� ����� ����� �����<br />
������������������ ���� ���� ���� ���� ���� ����� ����� ����� ����� ����� ����� ����� ����� ����� ����� �����<br />
A�������������������� ���� ���� ���� ���� ���� ����� ����� ����� ����� ����� ����� ����� ����� ����� ����� �����<br />
������������������ ���� ���� ���� ���� ���� ����� ���� ���� ����� ���� ���� ���� ����� ����� ����� �����<br />
����������������������� ���� ���� ���� ���� ���� ����� ���� ����� ����� ����� ����� ����� ����� ����� ����� �����<br />
������������������ ���� ���� ���� ���� ���� ����� ����� ����� ����� ����� ����� ����� ����� ����� ����� �����<br />
������������������� ���� ���� ���� ���� ���� ����� ����� ����� ����� ����� ����� ����� ����� ����� ����� �����<br />
������������������ ���� ���� ���� ����� ����� ����� ����� ����� ����� ����� ����� ����� ����� ����� ����� �����<br />
������������������ ���� ���� ���� ���� ����� ����� ����� ����� ����� ����� ����� ����� ����� ����� ����� �����<br />
������������������ ���� ����� ���� ����� ����� ����� ����� ����� ����� ����� ����� ����� ����� ����� ����� �����<br />
������������������� ���� ���� ���� ���� ����� ����� ����� ����� ����� ����� ����� ����� ����� ����� ����� �����<br />
��������������������� ���� ���� ���� ���� ���� ����� ����� ����� ����� ����� ����� ����� ����� ����� ����� �����<br />
������������������ ���� ���� ���� ���� ���� ����� ����� ����� ����� ����� ����� ����� ����� ����� ����� �����<br />
������������������� ���� ���� ���� ���� ���� ����� ����� ����� ����� ����� ����� ����� ����� ����� ����� �����<br />
������������������ ���� ���� ���� ���� ���� ����� ����� ����� ����� ����� ����� ����� ����� ����� ����� �����<br />
���������������������� ���� ���� ���� ���� ���� ����� ����� ����� ����� ����� ����� ����� ����� ����� ����� �����<br />
Total hours<br />
���������������������� ����� ����� ���� ���� ����� ����� ����� ����� ���� ���� ���� ���� ���� ���� ���� ����<br />
������������������ ����� ����� ���� ���� ���� ����� ����� ����� ����� ����� ����� ����� ����� ����� ����� �����<br />
A�������������������� ����� ����� ���� ���� ���� ����� ���� ���� ���� ���� ���� ���� ���� ���� ���� ����<br />
������������������ ����� ����� ����� ����� ����� ���� ���� ���� ���� ���� ���� ���� ���� ���� ���� ����<br />
����������������������� � ����� ���� ����� ����� ���� ���� ���� ���� ���� ���� ���� ���� ���� ���� ����<br />
������������������ ���� ����� ����� ����� ����� ����� ���� ����� ����� ���� ���� ���� ���� ���� ���� ����<br />
������������������� ����� ����� ����� ����� ����� ���� ���� ����� ����� ���� ���� ���� ���� ���� ���� ����<br />
������������������ ����� ����� ���� ���� ����� ����� ����� ����� ����� ����� ���� ���� ���� ���� ���� ����<br />
������������������ ����� ����� ����� ����� ����� ���� ���� ���� ���� ���� ���� ���� ���� ���� ���� ����<br />
������������������ ����� ����� ����� ����� ����� ���� ���� ���� ���� ���� ���� ���� ���� ���� ���� ����<br />
������������������� ����� ����� ����� ����� ����� ���� ����� ����� ���� ���� ���� ���� ���� ���� ���� ����<br />
��������������������� ����� ����� ����� ����� ����� ����� ����� ����� ����� ����� ���� ���� ���� ���� ���� ����<br />
������������������ ����� ���� ���� ���� ���� ����� ����� ����� ���� ���� ���� ���� ���� ���� ���� ����<br />
������������������� ����� ����� ���� ���� ���� ����� ����� ����� ����� ����� ����� ����� ����� ����� ����� �����<br />
������������������ ����� ����� ���� ���� ����� ���� ����� ����� ����� ����� ���� ���� ���� ���� ���� ����<br />
���������������������� ����� ����� ���� ���� ���� ���� ���� ���� ���� ���� ���� ���� ���� ���� ���� ����<br />
Hourly compensation<br />
(national currency b<strong>as</strong>is)<br />
���������������������� ���� ���� ���� ���� ���� ����� ����� ����� ����� ����� ����� ����� ����� ����� ����� �����<br />
������������������ ���� ���� ���� ���� ���� ����� ����� ����� ����� ����� ����� ����� ����� ����� ����� �����<br />
A�������������������� � ���� ���� ���� ���� ����� ����� ����� ����� ����� ����� ����� ����� ����� ����� �����<br />
������������������ ���� ���� ���� ���� ���� ����� ����� ����� ����� ����� ����� ����� ����� ����� ����� �����<br />
����������������������� � ���� ���� ���� ���� ����� ����� ����� ����� ����� ����� ����� ����� ����� ����� �����<br />
������������������ ���� ���� ���� ���� ���� ����� ����� ����� ����� ����� ����� ����� ����� ����� ����� �����<br />
������������������� ���� ���� ���� ���� ���� ����� ����� ����� ����� ����� ����� ����� ����� ����� ����� �����<br />
������������������ ���� ���� ���� ���� ���� ����� ����� ����� ����� ����� ����� ����� ����� ����� ����� �����<br />
������������������ ���� ���� ���� ���� ���� ����� ����� ����� ����� ����� ����� ����� ����� ����� ����� �����<br />
������������������ ���� ���� ���� ���� ���� ����� ����� ����� ����� ����� ����� ����� ����� ����� ����� �����<br />
������������������� ���� ���� ���� ���� ���� ����� ����� ����� ����� ����� ����� ����� ����� ����� ����� �����<br />
��������������������� ���� ���� ���� ���� ���� ����� ����� ����� ����� ����� ����� ����� ����� ����� ����� �����<br />
������������������ ���� ���� ���� ���� ���� ����� ����� ����� ����� ����� ����� ����� ����� ����� ����� �����<br />
������������������� ���� ���� ���� ���� ���� ����� ����� ����� ����� ����� ����� ����� ����� ����� ����� �����<br />
������������������ ���� ���� ���� ���� ���� ����� ����� ����� ����� ����� ����� ����� ����� ����� ����� �����<br />
���������������������� ���� ���� ���� ���� ����� ����� ����� ����� ����� ����� ����� ����� ����� ����� ����� �����<br />
�������������������������������<br />
Monthly Labor Review • November 2008 135
Current Labor Statistics: International Comparisons<br />
����������������������������������������������������������������������������������������������<br />
������������������� ���� ���� ���� ���� ���� ���� ���� ���� ���� ���� ���� ���� ���� ���� ���� ����<br />
����������������<br />
(national currency b<strong>as</strong>is)<br />
���������������������� ���� ����� ����� ����� ����� ���� ���� ���� ���� ���� ���� ���� ���� ���� ���� ����<br />
������������������ ���� ���� ���� ���� ���� ���� ���� ���� ���� ���� ����� ����� ����� ����� ����� �����<br />
A�������������������� � ���� ���� ���� ���� ����� ����� ����� ����� ����� ����� ����� ����� ����� ����� �����<br />
������������������ ���� ����� ����� ����� ����� ���� ����� ���� ���� ���� ���� ���� ���� ���� ���� ����<br />
����������������������� ���� ���� ���� ���� ���� ���� ���� ���� ���� ���� ���� ���� ���� ���� ���� ����<br />
������������������ ���� ���� ���� ����� ����� ���� ���� ���� ���� ���� ���� ���� ���� ���� ���� ����<br />
������������������� ���� ���� ����� ����� ���� ���� ���� ���� ���� ���� ����� ����� ���� ���� ���� ����<br />
������������������ ���� ���� ���� ���� ���� ���� ���� ���� ���� ����� ����� ����� ����� ����� ����� �����<br />
������������������ ���� ���� ����� ���� ���� ���� ���� ���� ���� ���� ���� ���� ���� ���� ���� ����<br />
������������������ ���� ���� ���� ���� ���� ���� ���� ���� ���� ���� ���� ���� ���� ���� ���� ����<br />
������������������� ���� ���� ���� ���� ���� ����� ����� ����� ����� ����� ����� ����� ����� ����� ����� �����<br />
��������������������� ���� ���� ����� ����� ����� ����� ����� ����� ����� ����� ����� ����� ����� ����� ����� �����<br />
������������������ ���� ���� ���� ���� ���� ����� ����� ����� ����� ����� ����� ����� ����� ����� ����� �����<br />
������������������� ���� ���� ���� ���� ���� ����� ����� ���� ���� ����� ����� ����� ����� ����� ����� �����<br />
������������������ ���� ����� ����� ���� ���� ���� ���� ���� ���� ���� ���� ���� ���� ���� ���� ����<br />
���������������������� ���� ���� ���� ���� ���� ����� ����� ����� ����� ����� ����� ����� ����� ����� ����� �����<br />
����������������<br />
�������������������<br />
���������������������� ���� ����� ����� ����� ����� ���� ���� ���� ���� ���� ���� ���� ���� ���� ���� ����<br />
������������������ ���� ����� ����� ���� ���� ���� ���� ���� ���� ���� ���� ����� ����� ����� ����� �����<br />
A�������������������� � ���� ���� ���� ���� ���� ���� ���� ���� ���� ���� ���� ����� ����� ����� �����<br />
������������������ ���� ���� ����� ����� ����� ���� ���� ���� ���� ���� ���� ���� ���� ���� ���� ����<br />
����������������������� ���� ���� ���� ���� ���� ���� ���� ���� ���� ���� ���� ���� ���� ���� ���� ����<br />
������������������ ���� ���� ����� ����� ����� ���� ���� ���� ���� ���� ���� ���� ���� ���� ���� ����<br />
������������������� ���� ���� ���� ���� ����� ���� ���� ���� ���� ���� ���� ���� ���� ���� ���� �����<br />
������������������ ���� ���� ���� ���� ���� ���� ���� ���� ���� ���� ���� ���� ����� ����� ����� �����<br />
������������������ ���� ���� ���� ���� ����� ���� ���� ���� ���� ���� ���� ���� ���� ���� ���� ����<br />
������������������ ���� ���� ���� ���� ����� ���� ���� ���� ���� ���� ���� ���� ���� ���� ���� ����<br />
������������������� ���� ����� ���� ���� ���� ���� ���� ���� ���� ���� ���� ����� ����� ����� ����� �����<br />
��������������������� ���� ���� ���� ���� ����� ���� ���� ���� ���� ���� ���� ���� ����� ���� ���� �����<br />
������������������ ���� ���� ���� ���� ����� ���� ���� ���� ���� ���� ����� ����� ����� ����� ����� �����<br />
������������������� ���� ���� ���� ���� ���� ���� ���� ���� ���� ���� ���� ���� ����� ����� ����� �����<br />
������������������ ���� ����� ���� ���� ���� ���� ���� ���� ���� ���� ���� ���� ���� ���� ���� ����<br />
���������������������� ���� ����� ���� ���� ����� ����� ����� ����� ����� ����� ����� ����� ����� ����� ����� �����<br />
���������������������������������������������������������������������������������������������������������������������������������������������������������������<br />
136 Monthly Labor Review • November 2008
54. Occupational injury and illness rates by industry, 1 United States<br />
Industry and type <strong>of</strong> c<strong>as</strong>e 2<br />
PRIVATE SECTOR 5<br />
1989 1<br />
Incidence rates per 100 full-time workers 3<br />
1990 1991 1992 1993 4 1994 4 1995 4 1996 4 1997 4 1998 4 1999 4 2000 4 2001 4<br />
Total c<strong>as</strong>es ............................…………………………. 8.6 8.8 8.4 ��� 8.5 8.4 8.1 7.4 7.1 ��� ��� ��� ���<br />
Lost workday c<strong>as</strong>es..................................................... 4.0 4.1 3.9 ��� 3.8 3.8 3.6 3.4 3.3 ��� ��� ��� ���<br />
Lost workdays........………........................................... 78.7 84.0 ���� ���� – – – – – � � � �<br />
Agriculture, forestry, and fishing 5<br />
Total c<strong>as</strong>es ............................…………………………. 10.9 11.6 10.8 ���� 11.2 10.0 9.7 8.7 8.4 ��� ��� ��� ���<br />
Lost workday c<strong>as</strong>es..................................................... 5.7 5.9 5.4 ��� 5.0 4.7 4.3 3.9 4.1 ��� ��� ��� ���<br />
Lost workdays........………........................................... 100.9 112.2 ����� ����� – – – – – � � � �<br />
Mining<br />
Total c<strong>as</strong>es ............................…………………………. 8.5 8.3 7.4 ��� 6.8 6.3 6.2 5.4 5.9 ��� ��� ��� ���<br />
Lost workday c<strong>as</strong>es..................................................... 4.8 5.0 4.5 ��� 3.9 3.9 3.9 3.2 3.7 ��� ��� ��� ���<br />
Lost workdays........………........................................... 137.2 119.5 ����� ����� – – – – – � � � �<br />
Construction<br />
Total c<strong>as</strong>es ............................…………………………. 14.3 14.2 13.0 ���� 12.2 11.8 10.6 9.9 9.5 ��� ��� ��� ���<br />
Lost workday c<strong>as</strong>es..................................................... 6.8 6.7 6.1 ��� 5.5 5.5 4.9 4.5 4.4 ��� ��� ��� ���<br />
Lost workdays........………...........................................<br />
General building contractors:<br />
143.3 147.9 ����� ����� – – – – – � � � �<br />
Total c<strong>as</strong>es ............................…………………………. 13.9 13.4 12.0 ���� 11.5 10.9 9.8 9.0 8.5 ��� ��� ��� ���<br />
Lost workday c<strong>as</strong>es..................................................... 6.5 6.4 5.5 ��� 5.1 5.1 4.4 4.0 3.7 ��� ��� ��� ���<br />
Lost workdays........………........................................... 137.3 137.6 ����� ����� – – – – – � � � �<br />
Heavy construction, except building:<br />
Total c<strong>as</strong>es ............................…………………………. 13.8 13.8 ���� ���� 11.1 10.2 9.9 9.0 8.7 ��� ��� ��� ���<br />
Lost workday c<strong>as</strong>es..................................................... 6.5 6.3 6.0 ��� 5.1 5.0 4.8 4.3 4.3 ��� ��� ��� ���<br />
Lost workdays........………........................................... 147.1 144.6 ����� ����� – – – – – � � � �<br />
Special trades contractors:<br />
Total c<strong>as</strong>es ............................…………………………. 14.6 14.7 13.5 ���� 12.8 12.5 11.1 10.4 10.0 ��� ��� ��� ���<br />
Lost workday c<strong>as</strong>es..................................................... 6.9 6.9 6.3 ��� 5.8 5.8 5.0 4.8 4.7 ��� ��� ��� ���<br />
Lost workdays........………........................................... 144.9 153.1 ����� ����� – – – – – � � � �<br />
Manufacturing<br />
Total c<strong>as</strong>es ............................…………………………. 13.1 13.2 12.7 ���� 12.1 12.2 11.6 10.6 10.3 ��� ��� ��� ���<br />
Lost workday c<strong>as</strong>es..................................................... 5.8 5.8 5.6 ��� 5.3 5.5 5.3 4.9 4.8 ��� ��� ��� ���<br />
Lost workdays........………...........................................<br />
Durable goods:<br />
113.0 120.7 ����� ����� – – – – – � � � �<br />
Total c<strong>as</strong>es ............................…………………………. 14.1 14.2 13.6 ���� 13.1 13.5 12.8 11.6 11.3 ���� ���� � ���<br />
Lost workday c<strong>as</strong>es..................................................... 6.0 6.0 5.7 ��� 5.4 5.7 5.6 5.1 5.1 ��� ��� � ���<br />
Lost workdays........………...........................................<br />
Lumber and wood products:<br />
116.5 123.3 ����� ����� – – – – – � � � �<br />
Total c<strong>as</strong>es ............................………………………… 18.4 18.1 16.8 ���� 15.9 15.7 14.9 14.2 13.5 ���� ���� ���� ����<br />
Lost workday c<strong>as</strong>es.................................................. 9.4 8.8 8.3 ��� 7.6 7.7 7.0 6.8 6.5 ��� ��� ��� ���<br />
Lost workdays........………........................................ 177.5 172.5 ����� ����� – – – – – � � � �<br />
Furniture and fixtures:<br />
Total c<strong>as</strong>es ............................………………………… 16.1 16.9 15.9 ���� 14.6 15.0 13.9 12.2 12.0 ���� ���� ���� ����<br />
Lost workday c<strong>as</strong>es.................................................. 7.2 7.8 7.2 ��� 6.5 7.0 6.4 5.4 5.8 ��� ��� ��� ���<br />
Lost workdays........………........................................ – – � ����� – – – – – � � � �<br />
Stone, clay, and gl<strong>as</strong>s products:<br />
Total c<strong>as</strong>es ............................………………………… 15.5 15.4 14.8 ���� 13.8 13.2 12.3 12.4 11.8 ���� ���� ���� ����<br />
Lost workday c<strong>as</strong>es.................................................. 7.4 7.3 6.8 ��� 6.3 6.5 5.7 6.0 5.7 ��� ��� ��� ���<br />
Lost workdays........………........................................ 149.8 160.5 ����� ����� – – – – – � � � �<br />
Primary metal industries:<br />
Total c<strong>as</strong>es ............................………………………… 18.7 19.0 17.7 ���� 17.0 16.8 16.5 15.0 15.0 ���� ���� ���� ����<br />
Lost workday c<strong>as</strong>es.................................................. 8.1 8.1 7.4 ��� 7.3 7.2 7.2 6.8 7.2 ��� ��� ��� ���<br />
Lost workdays........………........................................ 168.3 180.2 ����� ����� – – – – – � � � ����<br />
Fabricated metal products:<br />
Total c<strong>as</strong>es ............................………………………… 18.5 18.7 17.4 ���� 16.2 16.4 15.8 14.4 14.2 ���� ���� ���� ����<br />
Lost workday c<strong>as</strong>es.................................................. 7.9 7.9 7.1 ��� 6.7 6.7 6.9 6.2 6.4 ��� ��� ��� ���<br />
Lost workdays........………........................................ 147.6 155.7 ����� ����� – – – – – � � � �<br />
Industrial machinery and equipment:<br />
Total c<strong>as</strong>es ............................………………………… 12.1 12.0 11.2 ���� 11.1 11.6 11.2 9.9 10.0 ��� ��� ��� ����<br />
Lost workday c<strong>as</strong>es.................................................. 4.8 4.7 4.4 ��� 4.2 4.4 4.4 4.0 4.1 ��� ��� ��� ���<br />
Lost workdays........………........................................ 86.8 88.9 ���� ���� – – – – – � � � �<br />
Electronic and other electrical equipment:<br />
Total c<strong>as</strong>es ............................………………………… 9.1 9.1 8.6 ��� 8.3 8.3 7.6 6.8 6.6 ��� ��� ��� ���<br />
Lost workday c<strong>as</strong>es.................................................. 3.9 3.8 3.7 ��� 3.5 3.6 3.3 3.1 3.1 ��� ��� ��� ���<br />
Lost workdays........………........................................ 77.5 79.4 ���� ���� – – – – – � � � �<br />
Transportation equipment:<br />
Total c<strong>as</strong>es ............................………………………… 17.7 17.8 18.3 ���� 18.5 19.6 18.6 16.3 15.4 ���� ���� ���� ����<br />
Lost workday c<strong>as</strong>es.................................................. 6.8 6.9 7.0 ��� 7.1 7.8 7.9 7.0 6.6 ��� ��� ��� ���<br />
Lost workdays........………........................................ 138.6 153.7 ����� ����� – – – – – � � � �<br />
Instruments and related products:<br />
Total c<strong>as</strong>es ............................………………………… 5.6 5.9 6.0 ��� 5.6 5.9 5.3 5.1 4.8 ��� ��� ��� ���<br />
Lost workday c<strong>as</strong>es.................................................. 2.5 2.7 2.7 ��� 2.5 2.7 2.4 2.3 2.3 ��� ��� ��� ���<br />
Lost workdays........………........................................<br />
Miscellaneous manufacturing industries:<br />
55.4 57.8 ���� ���� – – – – – � � � �<br />
Total c<strong>as</strong>es ............................………………………… 11.1 11.3 11.3 ���� 10.0 9.9 9.1 9.5 8.9 ��� ��� ��� ���<br />
Lost workday c<strong>as</strong>es.................................................. 5.1 5.1 5.1 ��� 4.6 4.5 4.3 4.4 4.2 ��� ��� ��� ���<br />
Lost workdays........………........................................ 97.6 113.1 ����� ����� – – – – – – – – –<br />
See footnotes at end <strong>of</strong> table.<br />
Monthly Labor Review • November 2008 137
Current Labor Statistics: Injury and Illness Data<br />
������������������������������������������������������������������ � ��������������<br />
Industry and type <strong>of</strong> c<strong>as</strong>e 2<br />
138 Monthly Labor Review • November 2008<br />
1989 1<br />
������������������������������� �<br />
1990 1991 1992 1993 4 1994 4 1995 4 1996 4 1997 4 1998 4 1999 4 2000 4 2001 4<br />
Nondurable goods:<br />
Total c<strong>as</strong>es ............................…………………………..… 11.6 11.7 11.5 ���� 10.7 10.5 9.9 9.2 ��� ��� ��� ��� ���<br />
Lost workday c<strong>as</strong>es.........................................................<br />
Lost workdays........………...............................................<br />
Food and kindred products:<br />
5.5<br />
107.8<br />
5.6<br />
116.9<br />
5.5<br />
�����<br />
���<br />
�����<br />
5.0<br />
–<br />
5.1<br />
–<br />
4.9<br />
–<br />
4.6<br />
–<br />
���<br />
–<br />
���<br />
�<br />
���<br />
�<br />
���<br />
�<br />
���<br />
�<br />
Total c<strong>as</strong>es ............................………………………….. 18.5 20.0 19.5 ���� 17.6 17.1 16.3 15.0 ���� ���� ���� ���� ����<br />
Lost workday c<strong>as</strong>es......................................................<br />
Lost workdays........………............................................<br />
9.3<br />
174.7<br />
9.9<br />
202.6<br />
9.9<br />
�����<br />
���<br />
�����<br />
8.9<br />
–<br />
9.2<br />
–<br />
8.7<br />
–<br />
8.0<br />
–<br />
���<br />
–<br />
���<br />
�<br />
���<br />
�<br />
���<br />
�<br />
���<br />
�<br />
Tobacco products:<br />
Total c<strong>as</strong>es ............................………………………….. 8.7 7.7 6.4 ��� 5.8 5.3 5.6 6.7 ��� ��� ��� ��� ���<br />
Lost workday c<strong>as</strong>es......................................................<br />
Lost workdays........………............................................<br />
3.4<br />
64.2<br />
3.2<br />
62.3<br />
2.8<br />
����<br />
���<br />
����<br />
2.3<br />
–<br />
2.4<br />
–<br />
2.6<br />
–<br />
2.8<br />
–<br />
���<br />
–<br />
���<br />
�<br />
���<br />
�<br />
���<br />
�<br />
���<br />
�<br />
Textile mill products:<br />
Total c<strong>as</strong>es ............................………………………….. 10.3 9.6 10.1 ��� 9.7 8.7 8.2 7.8 ��� ��� ��� ��� ���<br />
Lost workday c<strong>as</strong>es...................................................... 4.2 4.0 4.4 ��� 4.1 4.0 4.1 3.6 ��� ��� ��� ��� ���<br />
Lost workdays........………............................................ 81.4 85.1 ���� ���� – – – – – � � � �<br />
Apparel and other textile products:<br />
Total c<strong>as</strong>es ............................………………………….. 8.6 8.8 9.2 ��� 9.0 8.9 8.2 7.4 ��� ��� ��� ��� ���<br />
Lost workday c<strong>as</strong>es...................................................... 3.8 3.9 4.2 ��� 3.8 3.9 3.6 3.3 ��� ��� ��� ��� ���<br />
Lost workdays........………............................................ 80.5 92.1 ���� ����� – – – – – � � � �<br />
Paper and allied products:<br />
Total c<strong>as</strong>es ............................………………………….. 12.7 12.1 11.2 ���� 9.9 9.6 8.5 7.9 ��� ��� ��� ��� ���<br />
Lost workday c<strong>as</strong>es...................................................... 5.8 5.5 5.0 ��� 4.6 4.5 4.2 3.8 ��� ��� ��� ��� ���<br />
Lost workdays........………............................................ 132.9 124.8 ����� ����� – – – – – � � � �<br />
Printing and publishing:<br />
Total c<strong>as</strong>es ............................………………………….. 6.9 6.9 6.7 ��� 6.9 6.7 6.4 6.0 ��� ��� ��� ��� ���<br />
Lost workday c<strong>as</strong>es...................................................... 3.3 3.3 3.2 ��� 3.1 3.0 3.0 2.8 ��� ��� ��� ��� ���<br />
Lost workdays........………............................................ 63.8 69.8 ���� ���� – – – – – � � � �<br />
Chemicals and allied products:<br />
Total c<strong>as</strong>es ............................………………………….. 7.0 6.5 6.4 ��� 5.9 5.7 5.5 4.8 ��� ��� ��� ��� ���<br />
Lost workday c<strong>as</strong>es...................................................... 3.2 3.1 3.1 ��� 2.7 2.8 2.7 2.4 ��� ��� ��� ��� ���<br />
Lost workdays........………............................................ 63.4 61.6 ���� ���� – – – – – � � � �<br />
Petroleum and coal products:<br />
Total c<strong>as</strong>es ............................………………………….. 6.6 6.6 6.2 ��� 5.2 4.7 4.8 4.6 ��� ��� ��� ��� ���<br />
Lost workday c<strong>as</strong>es...................................................... 3.3 3.1 2.9 ��� 2.5 2.3 2.4 2.5 ��� ��� ��� ��� ���<br />
Lost workdays........………............................................ 68.1 77.3 ���� ���� – – – – – � � � �<br />
Rubber and miscellaneous pl<strong>as</strong>tics products:<br />
Total c<strong>as</strong>es ............................………………………….. 16.2 16.2 15.1 ���� 13.9 14.0 12.9 12.3 ���� ���� ���� ���� ���<br />
Lost workday c<strong>as</strong>es...................................................... 8.0 7.8 7.2 ��� 6.5 6.7 6.5 6.3 ��� ��� ��� ��� ���<br />
Lost workdays........………............................................<br />
Leather and leather products:<br />
147.2 151.3 ����� ����� – – – – – � � � �<br />
Total c<strong>as</strong>es ............................………………………….. 13.6 12.1 12.5 ���� 12.1 12.0 11.4 10.7 ���� ��� ���� ��� ���<br />
Lost workday c<strong>as</strong>es...................................................... 6.5 5.9 5.9 ��� 5.5 5.3 4.8 4.5 ��� ��� ��� ��� ���<br />
Lost workdays........………............................................<br />
�����������������������������������<br />
130.4 152.3 ����� ����� – – – – – � � � �<br />
Total c<strong>as</strong>es ............................…………………………..… 9.2 9.6 9.3 ��� 9.5 9.3 9.1 8.7 ��� ��� ��� ��� ���<br />
Lost workday c<strong>as</strong>es......................................................... 5.3 5.5 5.4 ��� 5.4 5.5 5.2 5.1 ��� ��� ��� ��� ���<br />
Lost workdays........………............................................... 121.5 134.1 ����� ����� – – – – – � � � �<br />
��������������������������<br />
Total c<strong>as</strong>es ............................…………………………..… 8.0 7.9 7.6 ��� 8.1 7.9 7.5 6.8 ��� ��� ��� ��� ���<br />
Lost workday c<strong>as</strong>es......................................................... 3.6 3.5 3.4 ��� 3.4 3.4 3.2 2.9 ��� ��� ��� ��� ���<br />
Lost workdays........………............................................... 63.5 65.6 ���� ���� – – – – – � � � �<br />
Wholesale trade:<br />
Total c<strong>as</strong>es ............................…………………………..… 7.7 7.4 7.2 ��� 7.8 7.7 7.5 6.6 ��� ��� ��� ��� ���<br />
Lost workday c<strong>as</strong>es......................................................... 4.0 3.7 3.7 ��� 3.7 3.8 3.6 3.4 ��� ��� ��� ��� ���<br />
Lost workdays........………............................................... 71.9 71.5 ���� ���� – – – – – � � � �<br />
Retail trade:<br />
Total c<strong>as</strong>es ............................…………………………..… 8.1 8.1 7.7 ��� 8.2 7.9 7.5 6.9 ��� ��� ��� ��� ���<br />
Lost workday c<strong>as</strong>es......................................................... 3.4 3.4 3.3 ��� 3.3 3.3 3.0 2.8 ��� ��� ��� ��� ���<br />
Lost workdays........………............................................... 60.0 63.2 ���� ���� – – – – – � � � �<br />
�����������������������������������<br />
Total c<strong>as</strong>es ............................…………………………..… 2.0 2.4 2.4 ��� 2.9 2.7 2.6 2.4 ��� �� ��� ��� ���<br />
Lost workday c<strong>as</strong>es......................................................... .9 1.1 1.1 ��� 1.2 1.1 1.0 .9 �� �� �� �� ��<br />
Lost workdays........………............................................... 17.6 27.3 ���� ���� – – – – – � � � �<br />
��������<br />
Total c<strong>as</strong>es ............................…………………………..… 5.5 6.0 6.2 ��� 6.7 6.5 6.4 6.0 ��� ��� ��� ��� ���<br />
Lost workday c<strong>as</strong>es......................................................... 2.7 2.8 2.8 ��� 2.8 2.8 2.8 2.6 ��� ��� ��� ��� ���<br />
Lost workdays........………............................................... 51.2 56.4 ���� ���� – – – – – – – – –<br />
1 Data for 1989 and subsequent years are b<strong>as</strong>ed on the Standard Industrial Cl<strong>as</strong>sification<br />
Manual, 1987 Edition. For this re<strong>as</strong>on, they are not strictly comparable with data<br />
for the years 1985–88, which were b<strong>as</strong>ed on the Standard Industrial Cl<strong>as</strong>sification<br />
Manual, 1972 Edition, 1977 Supplement.<br />
2 Beginning with the 1992 survey, the annual survey me<strong>as</strong>ures only nonfatal injuries and<br />
illnesses, while p<strong>as</strong>t surveys covered both fatal and nonfatal incidents. To better address<br />
fatalities, a b<strong>as</strong>ic element <strong>of</strong> workplace safety, BLS implemented the Census <strong>of</strong> Fatal<br />
Occupational Injuries.<br />
3 <strong>The</strong> incidence rates represent the number <strong>of</strong> injuries and illnesses or lost workdays per<br />
100 full-time workers and were calculated <strong>as</strong> (N/EH) X 200,000, where:<br />
N = number <strong>of</strong> injuries and illnesses or lost workdays;<br />
EH = total hours worked by all employees during the calendar year; and<br />
200,000 = b<strong>as</strong>e for 100 full-time equivalent workers (working 40 hours per week, 50 weeks<br />
per year).<br />
4 Beginning with the 1993 survey, lost workday estimates will not be generated. As <strong>of</strong> 1992,<br />
BLS began generating percent distributions and the median number <strong>of</strong> days away from work<br />
by industry and for groups <strong>of</strong> workers sustaining similar work disabilities.<br />
5 Excludes farms with fewer than 11 employees since 1976.<br />
NOTE: D<strong>as</strong>h indicates data not available.
55. Fatal occupational injuries by event or exposure, 1996-2005<br />
Event or exposure 1<br />
1996-2000<br />
(average)<br />
2001-2005<br />
(average) 2<br />
2005 3<br />
Number Percent<br />
All events ............................................................... 6,094 5,704 5,734 100<br />
Transportation incidents ................................................ 2,608 2,451 2,493 43<br />
Highway ........................................................................ 1,408 1,394 1,437 25<br />
Collision between <strong>vehicle</strong>s, mobile equipment ......... 685 686 718 13<br />
Moving in same direction ...................................... 117 151 175 3<br />
Moving in opposite directions, oncoming .............. 247 254 265 5<br />
Moving in intersection ........................................... 151 137 134 2<br />
Vehicle struck stationary object or equipment on<br />
side <strong>of</strong> road ............................................................. 264 310 345 6<br />
Noncollision ............................................................... 372 335 318 6<br />
Jack-knifed or overturned--no collision ................. 298 274 273 5<br />
Nonhighway (farm, industrial premises) ........................ 378 335 340 6<br />
Noncollision accident ................................................ 321 277 281 5<br />
Overturned ............................................................ 212 175 182 3<br />
Worker struck by <strong>vehicle</strong>, mobile equipment ................ 376 369 391 7<br />
Worker struck by <strong>vehicle</strong>, mobile equipment in<br />
roadway .................................................................. 129 136 140 2<br />
Worker struck by <strong>vehicle</strong>, mobile equipment in<br />
parking lot or non-road area .................................... 171 166 176 3<br />
Water <strong>vehicle</strong> ................................................................ 105 82 88 2<br />
Aircraft ........................................................................... 263 206 149 3<br />
Assaults and violent acts ............................................... 1,015 850 792 14<br />
Homicides ..................................................................... 766 602 567 10<br />
Shooting .................................................................... 617 465 441 8<br />
Suicide, self-inflicted injury ............................................ 216 207 180 3<br />
Contact with objects and equipment ............................ 1,005 952 1,005 18<br />
Struck by object ............................................................ 567 560 607 11<br />
Struck by falling object .............................................. 364 345 385 7<br />
Struck by rolling, sliding objects on floor or ground<br />
level ......................................................................... 77 89 94 2<br />
Caught in or compressed by equipment or objects ....... 293 256 278 5<br />
Caught in running equipment or machinery .............. 157 128 121 2<br />
Caught in or crushed in collapsing materials ................ 128 118 109 2<br />
Falls .................................................................................. 714 763 770 13<br />
Fall to lower level .......................................................... 636 669 664 12<br />
Fall from ladder ......................................................... 106 125 129 2<br />
Fall from ro<strong>of</strong> ............................................................. 153 154 160 3<br />
Fall to lower level, n.e.c. ........................................... 117 123 117 2<br />
Exposure to harmful substances or environments ..... 535 498 501 9<br />
Contact with electric current .......................................... 290 265 251 4<br />
Contact with overhead power lines ........................... 132 118 112 2<br />
Exposure to caustic, noxious, or allergenic substances 112 114 136 2<br />
Oxygen deficiency ......................................................... 92 74 59 1<br />
Fires and explosions ...................................................... 196 174 159 3<br />
Fires--unintended or uncontrolled ................................. 103 95 93 2<br />
Explosion ...................................................................... 92 78 65 1<br />
1 B<strong>as</strong>ed on the 1992 BLS Occupational Injury and Illness Cl<strong>as</strong>sification Manual.<br />
2 Excludes fatalities from the Sept. 11, 2001, terrorist attacks.<br />
3 <strong>The</strong> BLS news rele<strong>as</strong>e <strong>of</strong> August 10, 2006, reported a total <strong>of</strong> 5,702 fatal work injuries for calendar year<br />
2005. Since then, an additional 32 job-related fatalities were identified, bringing the total job-related fatality<br />
count for 2005 to 5,734.<br />
NOTE: Totals for all years are revised and final. Totals for major categories may include subcategories not<br />
shown separately. D<strong>as</strong>hes indicate no data reported or data that do not meet publication criteria. N.e.c. means<br />
"not elsewhere cl<strong>as</strong>sified."<br />
SOURCE: U.S. Department <strong>of</strong> Labor, Bureau <strong>of</strong> Labor Statistics, in cooperation with State, New York City,<br />
District <strong>of</strong> Columbia, and Federal agencies, Census <strong>of</strong> Fatal Occupational Injuries.<br />
Monthly Labor Review • November 2008 139