The decline of employer stock as a 401(k) investment vehicle
The decline of employer stock as a 401(k) investment vehicle
The decline of employer stock as a 401(k) investment vehicle

Create successful ePaper yourself
Turn your PDF publications into a flip-book with our unique Google optimized e-Paper software.
did not have an <strong>investment</strong> choice in 2005. Adding those<br />
with no choice to those whose choices included <strong>employer</strong><br />
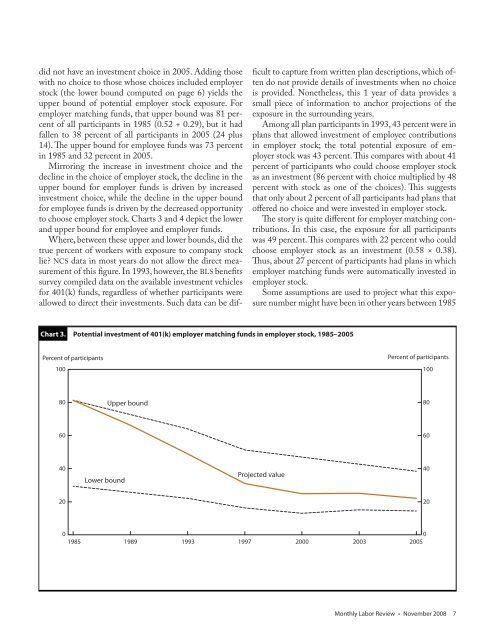
<strong>stock</strong> (the lower bound computed on page 6) yields the<br />
upper bound <strong>of</strong> potential <strong>employer</strong> <strong>stock</strong> exposure. For<br />
<strong>employer</strong> matching funds, that upper bound w<strong>as</strong> 81 percent<br />
<strong>of</strong> all participants in 1985 (0.52 + 0.29), but it had<br />
fallen to 38 percent <strong>of</strong> all participants in 2005 (24 plus<br />
14). <strong>The</strong> upper bound for employee funds w<strong>as</strong> 73 percent<br />
in 1985 and 32 percent in 2005.<br />
Mirroring the incre<strong>as</strong>e in <strong>investment</strong> choice and the<br />
<strong>decline</strong> in the choice <strong>of</strong> <strong>employer</strong> <strong>stock</strong>, the <strong>decline</strong> in the<br />
upper bound for <strong>employer</strong> funds is driven by incre<strong>as</strong>ed<br />
<strong>investment</strong> choice, while the <strong>decline</strong> in the upper bound<br />
for employee funds is driven by the decre<strong>as</strong>ed opportunity<br />
to choose <strong>employer</strong> <strong>stock</strong>. Charts 3 and 4 depict the lower<br />
and upper bound for employee and <strong>employer</strong> funds.<br />
Where, between these upper and lower bounds, did the<br />
true percent <strong>of</strong> workers with exposure to company <strong>stock</strong><br />
lie? NCS data in most years do not allow the direct me<strong>as</strong>urement<br />
<strong>of</strong> this figure. In 1993, however, the BLS benefits<br />
survey compiled data on the available <strong>investment</strong> <strong>vehicle</strong>s<br />
for <strong>401</strong>(k) funds, regardless <strong>of</strong> whether participants were<br />
allowed to direct their <strong>investment</strong>s. Such data can be dif-<br />
Chart 3. Potential <strong>investment</strong> <strong>of</strong> <strong>401</strong>(k) <strong>employer</strong> matching funds in <strong>employer</strong> <strong>stock</strong>, 1985–2005<br />
Percent <strong>of</strong> participants<br />
100<br />
80<br />
60<br />
40<br />
20<br />
Lower bound<br />
Upper bound<br />
ficult to capture from written plan descriptions, which <strong>of</strong>ten<br />
do not provide details <strong>of</strong> <strong>investment</strong>s when no choice<br />
is provided. Nonetheless, this 1 year <strong>of</strong> data provides a<br />
small piece <strong>of</strong> information to anchor projections <strong>of</strong> the<br />
exposure in the surrounding years.<br />
Among all plan participants in 1993, 43 percent were in<br />
plans that allowed <strong>investment</strong> <strong>of</strong> employee contributions<br />
in <strong>employer</strong> <strong>stock</strong>; the total potential exposure <strong>of</strong> <strong>employer</strong><br />
<strong>stock</strong> w<strong>as</strong> 43 percent. This compares with about 41<br />
percent <strong>of</strong> participants who could choose <strong>employer</strong> <strong>stock</strong><br />
<strong>as</strong> an <strong>investment</strong> (86 percent with choice multiplied by 48<br />
percent with <strong>stock</strong> <strong>as</strong> one <strong>of</strong> the choices). This suggests<br />
that only about 2 percent <strong>of</strong> all participants had plans that<br />
<strong>of</strong>fered no choice and were invested in <strong>employer</strong> <strong>stock</strong>.<br />
<strong>The</strong> story is quite different for <strong>employer</strong> matching contributions.<br />
In this c<strong>as</strong>e, the exposure for all participants<br />
w<strong>as</strong> 49 percent. This compares with 22 percent who could<br />
choose <strong>employer</strong> <strong>stock</strong> <strong>as</strong> an <strong>investment</strong> (0.58 × 0.38).<br />
Thus, about 27 percent <strong>of</strong> participants had plans in which<br />
<strong>employer</strong> matching funds were automatically invested in<br />
<strong>employer</strong> <strong>stock</strong>.<br />
Some <strong>as</strong>sumptions are used to project what this exposure<br />
number might have been in other years between 1985<br />
Projected value<br />
Percent <strong>of</strong> participants<br />
0<br />
0<br />
1985 1989 1993 1997 2000 2003 2005<br />
100<br />
80<br />
60<br />
40<br />
20<br />
Monthly Labor Review • November 2008 7