The decline of employer stock as a 401(k) investment vehicle
The decline of employer stock as a 401(k) investment vehicle
The decline of employer stock as a 401(k) investment vehicle

Create successful ePaper yourself
Turn your PDF publications into a flip-book with our unique Google optimized e-Paper software.
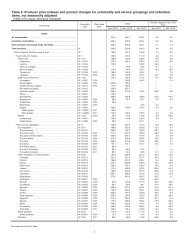
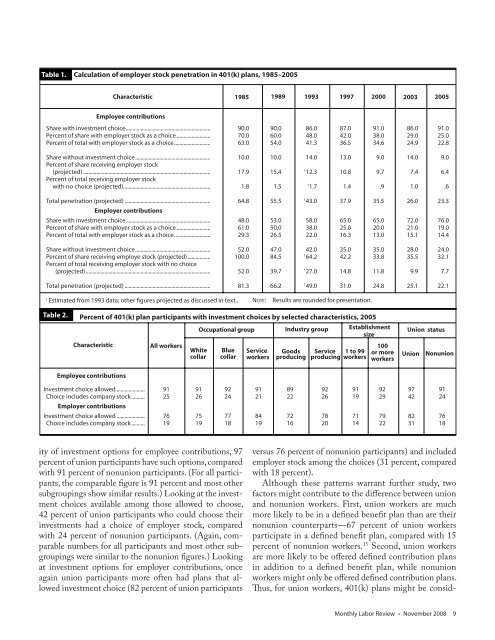
Table 1. Calculation <strong>of</strong> <strong>employer</strong> <strong>stock</strong> penetration in <strong>401</strong>(k) plans, 1985–2005<br />
Employee contributions<br />
Share with <strong>investment</strong> choice ............................................................... 90.0 90.0 86.0 87.0 91.0 86.0 91.0<br />
Percent <strong>of</strong> share with <strong>employer</strong> <strong>stock</strong> <strong>as</strong> a choice ......................... 70.0 60.0 48.0 42.0 38.0 29.0 25.0<br />
Percent <strong>of</strong> total with <strong>employer</strong> <strong>stock</strong> <strong>as</strong> a choice........................... 63.0 54.0 41.3 36.5 34.6 24.9 22.8<br />
Percent <strong>of</strong> <strong>401</strong>(k) plan participants with <strong>investment</strong> choices by selected characteristics, 2005<br />
Characteristic<br />
Employee contributions<br />
Characteristic 1985 1989 1993 1997 2000 2003<br />
Share without <strong>investment</strong> choice ........................................................ 10.0 10.0 14.0 13.0 9.0 14.0 9.0<br />
Percent <strong>of</strong> share receiving <strong>employer</strong> <strong>stock</strong><br />
(projected) ............................................................................................... 17.9 15.4 1 12.3 10.8 9.7 7.4 6.4<br />
Percent <strong>of</strong> total receiving <strong>employer</strong> <strong>stock</strong><br />
with no choice (projected)................................................................. 1.8 1.5 1 1.7 1.4 .9 1.0 .6<br />
Total penetration (projected) ................................................................<br />
Employer contributions<br />
64.8 55.5 143.0 37.9 35.5 26.0 23.3<br />
Share with <strong>investment</strong> choice ............................................................... 48.0 53.0 58.0 65.0 65.0 72.0 76.0<br />
Percent <strong>of</strong> share with <strong>employer</strong> <strong>stock</strong> <strong>as</strong> a choice ......................... 61.0 50.0 38.0 25.0 20.0 21.0 19.0<br />
Percent <strong>of</strong> total with <strong>employer</strong> <strong>stock</strong> <strong>as</strong> a choice........................... 29.3 26.5 22.0 16.3 13.0 15.1 14.4<br />
Share without <strong>investment</strong> choice ........................................................ 52.0 47.0 42.0 35.0 35.0 28.0 24.0<br />
Percent <strong>of</strong> share receiving employe <strong>stock</strong> (projected) ................. 100.0 84.5 1 64.2 42.2 33.8 35.5 32.1<br />
Percent <strong>of</strong> total receiving <strong>employer</strong> <strong>stock</strong> with no choice<br />
(projected) ............................................................................................. 52.0 39.7 1 27.0 14.8 11.8 9.9 7.7<br />
Total penetration (projected) ................................................................ 81.3 66.2 1 49.0 31.0 24.8 25.1 22.1<br />
1 Estimated from 1993 data; other figures projected <strong>as</strong> discussed in text..<br />
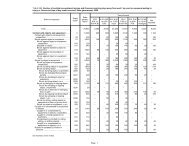
Table 2.<br />
All workers<br />
White<br />
collar<br />
Occupational group<br />
Blue<br />
collar<br />
Goods Service 1 to 99<br />
producing producing workers Union<br />
100<br />
or more<br />
workers<br />
Investment choice allowed ..................... 91 91 92 91 89 92 91 92 97 91<br />
Choice includes company <strong>stock</strong>..........<br />
Employer contributions<br />
25 26 24 21 22 26 19 29 42 24<br />
Investment choice allowed ..................... 76 75 77 84 72 78 71 79 82 76<br />
Choice includes company <strong>stock</strong> .......... 19 19 18 19 16 20 14 22 31 18<br />
ity <strong>of</strong> <strong>investment</strong> options for employee contributions, 97<br />
percent <strong>of</strong> union participants have such options, compared<br />
with 91 percent <strong>of</strong> nonunion participants. (For all participants,<br />
the comparable figure is 91 percent and most other<br />
subgroupings show similar results.) Looking at the <strong>investment</strong><br />
choices available among those allowed to choose,<br />
42 percent <strong>of</strong> union participants who could choose their<br />
<strong>investment</strong>s had a choice <strong>of</strong> <strong>employer</strong> <strong>stock</strong>, compared<br />
with 24 percent <strong>of</strong> nonunion participants. (Again, comparable<br />
numbers for all participants and most other subgroupings<br />
were similar to the nonunion figures.) Looking<br />
at <strong>investment</strong> options for <strong>employer</strong> contributions, once<br />
again union participants more <strong>of</strong>ten had plans that allowed<br />
<strong>investment</strong> choice (82 percent <strong>of</strong> union participants<br />
NOTE: Results are rounded for presentation.<br />
Service<br />
workers<br />
Industry group<br />
Establishment<br />
size<br />
2005<br />
Union status<br />
Nonunion<br />
versus 76 percent <strong>of</strong> nonunion participants) and included<br />
<strong>employer</strong> <strong>stock</strong> among the choices (31 percent, compared<br />
with 18 percent).<br />
Although these patterns warrant further study, two<br />
factors might contribute to the difference between union<br />
and nonunion workers. First, union workers are much<br />
more likely to be in a defined benefit plan than are their<br />
nonunion counterparts—67 percent <strong>of</strong> union workers<br />
participate in a defined benefit plan, compared with 15<br />
percent <strong>of</strong> nonunion workers. 15 Second, union workers<br />
are more likely to be <strong>of</strong>fered defined contribution plans<br />
in addition to a defined benefit plan, while nonunion<br />
workers might only be <strong>of</strong>fered defined contribution plans.<br />
Thus, for union workers, <strong>401</strong>(k) plans might be consid-<br />
Monthly Labor Review • November 2008 9