The decline of employer stock as a 401(k) investment vehicle
The decline of employer stock as a 401(k) investment vehicle
The decline of employer stock as a 401(k) investment vehicle

You also want an ePaper? Increase the reach of your titles
YUMPU automatically turns print PDFs into web optimized ePapers that Google loves.
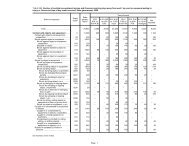
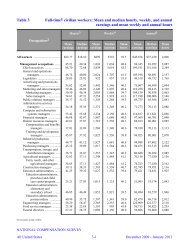
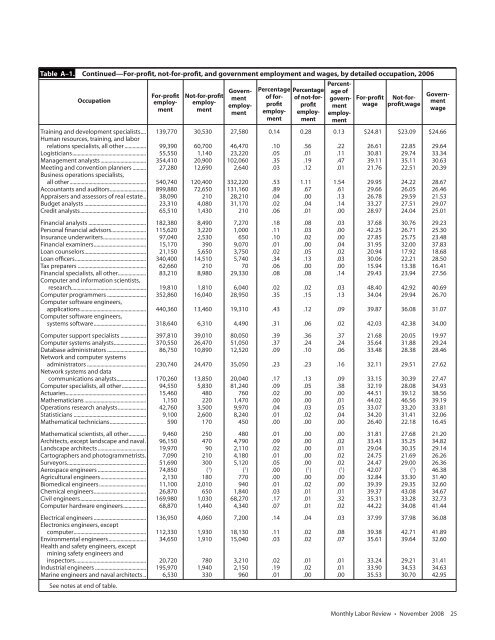
Table A–1. Continued—For-pr<strong>of</strong>it, not-for-pr<strong>of</strong>it, and government employment and wages, by detailed occupation, 2006<br />
Occupation<br />
Training and development specialists .... 139,770 30,530 27,580 0.14 0.28 0.13 $24.81 $23.09 $24.66<br />
Human resources, training, and labor<br />
relations specialists, all other ................ 99,390 60,700 46,470 .10 .56 .22 26.61 22.85 29.64<br />
Logisticians ....................................................... 55,550 1,140 23,220 .05 .01 .11 30.81 29.74 33.34<br />
Management analysts .................................. 354,410 20,900 102,060 .35 .19 .47 39.11 35.11 30.63<br />
Meeting and convention planners .......... 27,280 12,690 2,640 .03 .12 .01 21.76 22.51 20.39<br />
Business operations specialists,<br />
all other ......................................................... 540,740 120,400 332,220 .53 1.11 1.54 29.95 24.22 28.67<br />
Accountants and auditors ........................... 899,880 72,650 131,160 .89 .67 .61 29.66 26.05 26.46<br />
Appraisers and <strong>as</strong>sessors <strong>of</strong> real estate .. 38,090 210 28,210 .04 .00 .13 26.78 29.59 21.53<br />
Budget analysts .............................................. 23,310 4,080 31,170 .02 .04 .14 33.27 27.51 29.07<br />
Credit analysts ................................................. 65,510 1,430 210 .06 .01 .00 28.97 24.04 25.01<br />
Financial analysts ........................................... 182,380 8,490 7,270 .18 .08 .03 37.68 30.76 29.23<br />
Personal financial advisors .......................... 115,620 3,220 1,000 .11 .03 .00 42.25 26.71 25.30<br />
Insurance underwriters ................................ 97,040 2,530 650 .10 .02 .00 27.85 25.75 23.48<br />
Financial examiners ....................................... 15,170 390 9,070 .01 .00 .04 31.95 32.00 37.83<br />
Loan counselors .............................................. 21,150 5,650 3,750 .02 .05 .02 20.94 17.92 18.68<br />
Loan <strong>of</strong>ficers ..................................................... 340,400 14,510 5,740 .34 .13 .03 30.06 22.21 28.50<br />
Tax preparers ................................................... 62,660 210 70 .06 .00 .00 15.94 13.38 16.41<br />
Financial specialists, all other ..................... 83,210 8,980 29,330 .08 .08 .14 29.43 23.94 27.56<br />
Computer and information scientists,<br />
research........................................................ 19,810 1,810 6,040 .02 .02 .03 48.40 42.92 40.69<br />
Computer programmers ............................. 352,860 16,040 28,950 .35 .15 .13 34.04 29.94 26.70<br />
Computer s<strong>of</strong>tware engineers,<br />
applications ................................................. 440,360 13,460 19,310 .43 .12 .09 39.87 36.08 31.07<br />
Computer s<strong>of</strong>tware engineers,<br />
systems s<strong>of</strong>tware ....................................... 318,640 6,310 4,490 .31 .06 .02 42.03 42.38 34.00<br />
Computer support specialists ................... 397,810 39,010 80,050 .39 .36 .37 21.68 20.05 19.97<br />
Computer systems analysts ........................ 370,550 26,470 51,050 .37 .24 .24 35.64 31.88 29.24<br />
Datab<strong>as</strong>e administrators ............................. 86,750 10,890 12,520 .09 .10 .06 33.48 28.38 28.46<br />
Network and computer systems<br />
administrators ............................................ 230,740 24,470 35,050 .23 .23 .16 32.11 29.51 27.62<br />
Network systems and data<br />
communications analysts...................... 170,260 13,850 20,040 .17 .13 .09 33.15 30.39 27.47<br />
Computer specialists, all other .................. 94,550 5,830 81,240 .09 .05 .38 32.19 28.08 34.93<br />
Actuaries ............................................................ 15,460 480 760 .02 .00 .00 44.51 39.12 38.56<br />
Mathematicians .............................................. 1,150 220 1,470 .00 .00 .01 44.02 46.56 39.19<br />
Operations research analysts ..................... 42,760 3,500 9,970 .04 .03 .05 33.07 33.20 33.81<br />
Statisticians ...................................................... 9,100 2,600 8,240 .01 .02 .04 34.20 31.41 32.06<br />
Mathematical technicians ........................... 590 170 450 .00 .00 .00 26.40 22.18 16.45<br />
Mathematical scientists, all other ............. 9,460 250 480 .01 .00 .00 31.81 27.68 21.20<br />
Architects, except landscape and naval . 96,150 470 4,790 .09 .00 .02 33.43 35.25 34.82<br />
Landscape architects .................................... 19,970 90 2,110 .02 .00 .01 29.04 30.35 29.14<br />
Cartographers and photogrammetrists . 7,090 210 4,180 .01 .00 .02 24.75 21.69 26.26<br />
Surveyors........................................................... 51,690 300 5,120 .05 .00 .02 24.47 29.00 26.36<br />
Aerospace engineers .................................... 74,850 ( 1 ) ( 1 ) .00 ( 1 ) ( 1 ) 42.07 ( 1 ) 46.38<br />
Agricultural engineers .................................. 2,130 180 770 .00 .00 .00 32.84 33.30 31.40<br />
Biomedical engineers ................................... 11,100 2,010 940 .01 .02 .00 39.39 29.35 32.60<br />
Chemical engineers ....................................... 26,870 650 1,840 .03 .01 .01 39.37 43.08 34.67<br />
Civil engineers ................................................. 169,980 1,030 68,270 .17 .01 .32 35.31 33.28 32.73<br />
Computer hardware engineers ................. 68,870 1,440 4,340 .07 .01 .02 44.22 34.08 41.44<br />
Electrical engineers ....................................... 136,950 4,060 7,200 .14 .04 .03 37.99 37.98 36.08<br />
Electronics engineers, except<br />
computer ...................................................... 112,330 1,930 18,130 .11 .02 .08 39.38 42.71 41.89<br />
Environmental engineers ............................ 34,650 1,910 15,040 .03 .02 .07 35.61 39.64 32.60<br />
Health and safety engineers, except<br />
mining safety engineers and<br />
inspectors ..................................................... 20,720 780 3,210 .02 .01 .01 33.24 29.21 31.41<br />
Industrial engineers ...................................... 195,970 1,940 2,150 .19 .02 .01 33.90 34.53 34.63<br />
Marine engineers and naval architects .. 6,530 330 960 .01 .00 .00 35.53 30.70 42.95<br />
See notes at end <strong>of</strong> table.<br />
For-pr<strong>of</strong>it Not-for-pr<strong>of</strong>it Govern-<br />
employ- employ- ment<br />
ment ment employ-<br />
ment<br />
Percentage<br />
<strong>of</strong> forpr<strong>of</strong>itemployment<br />
Percentage<br />
<strong>of</strong> not-forpr<strong>of</strong>itemployment<br />
Percentage<br />
<strong>of</strong><br />
governmentemployment<br />
For-pr<strong>of</strong>it Not-for-<br />
Governwage<br />
pr<strong>of</strong>it wage<br />
ment<br />
- wage<br />
Monthly Labor Review • November 2008 25