The decline of employer stock as a 401(k) investment vehicle
The decline of employer stock as a 401(k) investment vehicle
The decline of employer stock as a 401(k) investment vehicle

You also want an ePaper? Increase the reach of your titles
YUMPU automatically turns print PDFs into web optimized ePapers that Google loves.
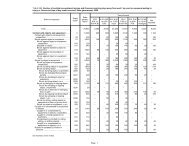
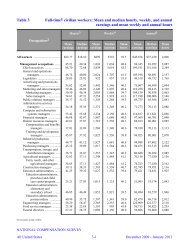
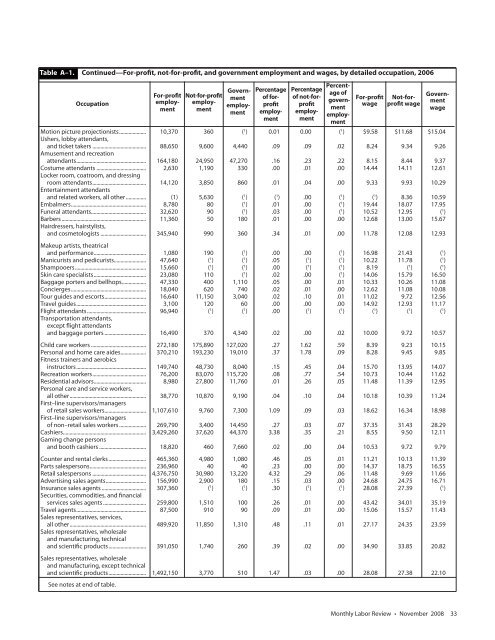
Table A–1. Continued—For-pr<strong>of</strong>it, not-for-pr<strong>of</strong>it, and government employment and wages, by detailed occupation, 2006<br />
Occupation<br />
Motion picture projectionists .................... 10,370 360 ( 1 ) 0.01 0.00 ( 1 ) $9.58 $11.68 $15.04<br />
Ushers, lobby attendants,<br />
and ticket takers ........................................ 88,650 9,600 4,440 .09 .09 .02 8.24 9.34 9.26<br />
Amusement and recreation<br />
attendants .................................................... 164,180 24,950 47,270 .16 .23 .22 8.15 8.44 9.37<br />
Costume attendants ..................................... 2,630 1,190 330 .00 .01 .00 14.44 14.11 12.61<br />
Locker room, coatroom, and dressing<br />
room attendants ........................................ 14,120 3,850 860 .01 .04 .00 9.33 9.93 10.29<br />
Entertainment attendants<br />
and related workers, all other ............... (1) 5,630 ( 1 ) ( 1 ) .00 ( 1 ) ( 1 ) 8.36 10.59<br />
Embalmers ........................................................ 8,780 80 ( 1 ) .01 .00 ( 1 ) 19.44 18.07 17.95<br />
Funeral attendants......................................... 32,620 90 ( 1 ) .03 .00 ( 1 ) 10.52 12.95 ( 1 )<br />
Barbers ............................................................... 11,360 50 180 .01 .00 .00 12.68 13.00 15.67<br />
Hairdressers, hairstylists,<br />
and cosmetologists .................................. 345,940 990 360 .34 .01 .00 11.78 12.08 12.93<br />
Makeup artists, theatrical<br />
and performance ....................................... 1,080 190 ( 1 ) .00 .00 ( 1 ) 16.98 21.43 ( 1 )<br />
Manicurists and pedicurists........................ 47,640 ( 1 ) ( 1 ) .05 ( 1 ) ( 1 ) 10.22 11.78 ( 1 )<br />
Shampooers ..................................................... 15,660 ( 1 ) ( 1 ) .00 ( 1 ) ( 1 ) 8.19 ( 1 ) ( 1 )<br />
Skin care specialists ....................................... 23,080 110 ( 1 ) .02 .00 ( 1 ) 14.06 15.79 16.50<br />
Baggage porters and bellhops .................. 47,330 400 1,110 .05 .00 .01 10.33 10.26 11.08<br />
Concierges ........................................................ 18,040 620 740 .02 .01 .00 12.62 11.08 10.08<br />
Tour guides and escorts ............................... 16,640 11,150 3,040 .02 .10 .01 11.02 9.72 12.56<br />
Travel guides .................................................... 3,100 120 60 .00 .00 .00 14.92 12.93 11.17<br />
Flight attendants ............................................ 96,940 ( 1 ) ( 1 ) .00 ( 1 ) ( 1 ) ( 1 ) ( 1 ) ( 1 )<br />
Transportation attendants,<br />
except flight attendants<br />
and baggage porters ............................... 16,490 370 4,340 .02 .00 .02 10.00 9.72 10.57<br />
Child care workers ......................................... 272,180 175,890 127,020 .27 1.62 .59 8.39 9.23 10.15<br />
Personal and home care aides ................... 370,210 193,230 19,010 .37 1.78 .09 8.28 9.45 9.85<br />
Fitness trainers and aerobics<br />
instructors .................................................... 149,740 48,730 8,040 .15 .45 .04 15.70 13.95 14.07<br />
Recreation workers ........................................ 76,200 83,070 115,720 .08 .77 .54 10.73 10.44 11.62<br />
Residential advisors ....................................... 8,980 27,800 11,760 .01 .26 .05 11.48 11.39 12.95<br />
Personal care and service workers,<br />
all other ......................................................... 38,770 10,870 9,190 .04 .10 .04 10.18 10.39 11.24<br />
First–line supervisors/managers<br />
<strong>of</strong> retail sales workers ............................... 1,107,610 9,760 7,300 1.09 .09 .03 18.62 16.34 18.98<br />
First–line supervisors/managers<br />
<strong>of</strong> non–retail sales workers .................... 269,790 3,400 14,450 .27 .03 .07 37.35 31.43 28.29<br />
C<strong>as</strong>hiers .............................................................. 3,429,260 37,620 44,370 3.38 .35 .21 8.55 9.50 12.11<br />
Gaming change persons<br />
and booth c<strong>as</strong>hiers ................................... 18,820 460 7,660 .02 .00 .04 10.53 9.72 9.79<br />
Counter and rental clerks ............................ 465,360 4,980 1,080 .46 .05 .01 11.21 10.13 11.39<br />
Parts salespersons .......................................... 236,960 40 40 .23 .00 .00 14.37 18.75 16.55<br />
Retail salespersons ........................................ 4,376,750 30,980 13,220 4.32 .29 .06 11.48 9.69 11.66<br />
Advertising sales agents .............................. 156,990 2,900 180 .15 .03 .00 24.68 24.75 16.71<br />
Insurance sales agents ................................. 307,360 ( 1 ) ( 1 ) .30 ( 1 ) ( 1 ) 28.08 27.39 ( 1 )<br />
Securities, commodities, and financial<br />
services sales agents ................................ 259,800 1,510 100 .26 .01 .00 43.42 34.01 35.19<br />
Travel agents .................................................... 87,500 910 90 .09 .01 .00 15.06 15.57 11.43<br />
Sales representatives, services,<br />
all other ......................................................... 489,920 11,850 1,310 .48 .11 .01 27.17 24.35 23.59<br />
Sales representatives, wholesale<br />
and manufacturing, technical<br />
and scientific products ............................ 391,050 1,740 260 .39 .02 .00 34.90 33.85 20.82<br />
Sales representatives, wholesale<br />
and manufacturing, except technical<br />
and scientific products ............................ 1,492,150 3,770 510 1.47 .03 .00 28.08 27.38 22.10<br />
See notes at end <strong>of</strong> table.<br />
For-pr<strong>of</strong>it Not-for-pr<strong>of</strong>it Govern-<br />
employ- employ- ment<br />
ment ment employ-<br />
ment<br />
Percentage<br />
<strong>of</strong> forpr<strong>of</strong>itemployment<br />
Percentage<br />
<strong>of</strong> not-forpr<strong>of</strong>itemployment<br />
Percentage<br />
<strong>of</strong><br />
governmentemployment<br />
For-pr<strong>of</strong>it Not-for-<br />
Governwage<br />
pr<strong>of</strong>it wage<br />
ment<br />
wage<br />
Monthly Labor Review • November 2008 33