The decline of employer stock as a 401(k) investment vehicle
The decline of employer stock as a 401(k) investment vehicle
The decline of employer stock as a 401(k) investment vehicle

Create successful ePaper yourself
Turn your PDF publications into a flip-book with our unique Google optimized e-Paper software.
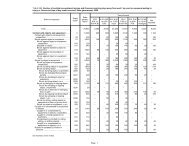
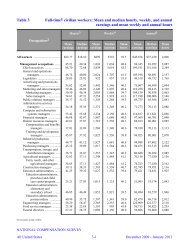
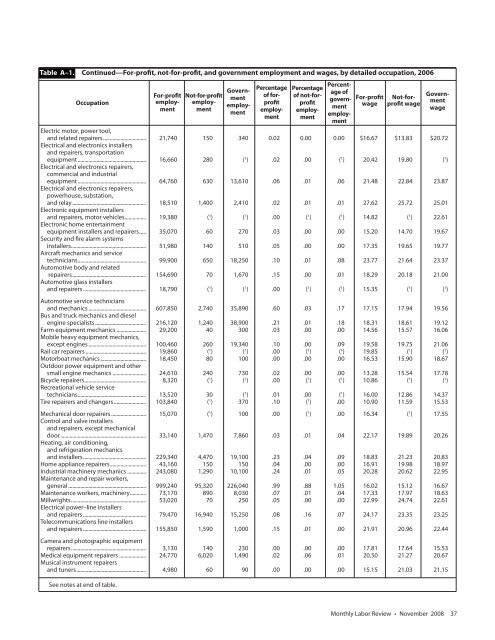
Table A–1. Continued—For-pr<strong>of</strong>it, not-for-pr<strong>of</strong>it, and government employment and wages, by detailed occupation, 2006<br />
Occupation<br />
Electric motor, power tool,<br />
and related repairers ................................ 21,740 150 340 0.02 0.00 0.00 $16.67 $13.83 $20.72<br />
Electrical and electronics installers<br />
and repairers, transportation<br />
equipment ................................................... 16,660 280 ( 1 ) .02 .00 ( 1 ) 20.42 19.80 ( 1 )<br />
Electrical and electronics repairers,<br />
commercial and industrial<br />
equipment ................................................... 64,760 630 13,610 .06 .01 .06 21.48 22.84 23.87<br />
Electrical and electronics repairers,<br />
powerhouse, substation,<br />
and relay ....................................................... 18,510 1,400 2,410 .02 .01 .01 27.62 25.72 25.01<br />
Electronic equipment installers<br />
and repairers, motor <strong>vehicle</strong>s................ 19,380 ( 1 ) ( 1 ) .00 ( 1 ) ( 1 ) 14.82 ( 1 ) 22.61<br />
Electronic home entertainment<br />
equipment installers and repairers ..... 35,070 60 270 .03 .00 .00 15.20 14.70 19.67<br />
Security and fire alarm systems<br />
installers ........................................................ 51,980 140 510 .05 .00 .00 17.35 19.65 19.77<br />
Aircraft mechanics and service<br />
technicians ................................................... 99,900 650 18,250 .10 .01 .08 23.77 21.64 23.37<br />
Automotive body and related<br />
repairers ....................................................... 154,690 70 1,670 .15 .00 .01 18.29 20.18 21.00<br />
Automotive gl<strong>as</strong>s installers<br />
and repairers ............................................... 18,790 ( 1 ) ( 1 ) .00 ( 1 ) ( 1 ) 15.35 ( 1 ) ( 1 )<br />
Automotive service technicians<br />
and mechanics ........................................... 607,850 2,740 35,890 .60 .03 .17 17.15 17.94 19.56<br />
Bus and truck mechanics and diesel<br />
engine specialists ...................................... 216,120 1,240 38,900 .21 .01 .18 18.31 18.61 19.12<br />
Farm equipment mechanics ...................... 29,200 40 300 .03 .00 .00 14.56 15.57 16.06<br />
Mobile heavy equipment mechanics,<br />
except engines ........................................... 100,460 260 19,340 .10 .00 .09 19.58 19.75 21.06<br />
Rail car repairers ............................................. 19,860 ( 1 ) ( 1 ) .00 ( 1 ) ( 1 ) 19.85 ( 1 ) ( 1 )<br />
Motorboat mechanics .................................. 18,450 80 100 .00 .00 .00 16.53 15.90 18.67<br />
Outdoor power equipment and other<br />
small engine mechanics ......................... 24,610 240 730 .02 .00 .00 13.28 15.54 17.78<br />
Bicycle repairers .............................................. 8,320 ( 1 ) ( 1 ) .00 ( 1 ) ( 1 ) 10.86 ( 1 ) ( 1 )<br />
Recreational <strong>vehicle</strong> service<br />
technicians ................................................... 13,520 30 ( 1 ) .01 .00 ( 1 ) 16.00 12.86 14.37<br />
Tire repairers and changers ........................ 103,840 ( 1 ) 370 .10 ( 1 ) .00 10.90 11.59 15.53<br />
Mechanical door repairers .......................... 15,070 ( 1 ) 100 .00 ( 1 ) .00 16.34 ( 1 ) 17.55<br />
Control and valve installers<br />
and repairers, except mechanical<br />
door ................................................................ 33,140 1,470 7,860 .03 .01 .04 22.17 19.89 20.26<br />
Heating, air conditioning,<br />
and refrigeration mechanics<br />
and installers ............................................... 229,340 4,470 19,100 .23 .04 .09 18.83 21.23 20.83<br />
Home appliance repairers ........................... 43,160 150 150 .04 .00 .00 16.91 19.98 18.97<br />
Industrial machinery mechanics .............. 243,080 1,290 10,100 .24 .01 .05 20.28 20.62 22.95<br />
Maintenance and repair workers,<br />
general .......................................................... 999,240 95,320 226,040 .99 .88 1.05 16.02 15.12 16.67<br />
Maintenance workers, machinery ............ 73,170 890 8,030 .07 .01 .04 17.33 17.97 18.63<br />
Millwrights ........................................................ 53,020 70 250 .05 .00 .00 22.99 24.74 22.61<br />
Electrical power–line installers<br />
and repairers ............................................... 79,470 16,940 15,250 .08 .16 .07 24.17 23.35 23.25<br />
Telecommunications line installers<br />
and repairers ............................................... 155,850 1,590 1,000 .15 .01 .00 21.91 20.96 22.44<br />
Camera and photographic equipment<br />
repairers ........................................................ 3,130 140 230 .00 .00 .00 17.81 17.64 15.53<br />
Medical equipment repairers .................... 24,770 6,020 1,490 .02 .06 .01 20.50 21.27 20.67<br />
Musical instrument repairers<br />
and tuners .................................................... 4,980 60 90 .00 .00 .00 15.15 21.03 21.15<br />
See notes at end <strong>of</strong> table.<br />
For-pr<strong>of</strong>it Not-for-pr<strong>of</strong>it Govern-<br />
employ- employ- ment<br />
ment ment employ-<br />
ment<br />
Percentage<br />
<strong>of</strong> forpr<strong>of</strong>itemployment<br />
Percentage<br />
<strong>of</strong> not-forpr<strong>of</strong>itemployment<br />
Percentage<br />
<strong>of</strong><br />
governmentemployment<br />
For-pr<strong>of</strong>it Not-for-<br />
Governwage<br />
pr<strong>of</strong>it wage<br />
ment<br />
wage<br />
Monthly Labor Review • November 2008 37