The decline of employer stock as a 401(k) investment vehicle
The decline of employer stock as a 401(k) investment vehicle
The decline of employer stock as a 401(k) investment vehicle

Create successful ePaper yourself
Turn your PDF publications into a flip-book with our unique Google optimized e-Paper software.
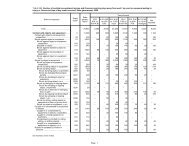
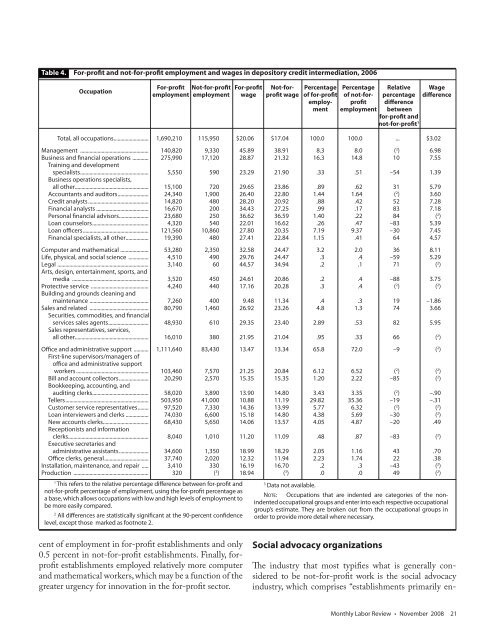
Table 4. For-pr<strong>of</strong>it and not-for-pr<strong>of</strong>it employment and wages in depository credit intermediation, 2006<br />
Occupation<br />
For-pr<strong>of</strong>it Not-for-pr<strong>of</strong>it For-pr<strong>of</strong>it Not-for- Percentage Percentage Relative Wage<br />
employment employment wage pr<strong>of</strong>it wage <strong>of</strong> for-pr<strong>of</strong>it <strong>of</strong> not-for- percentage difference<br />
employ- pr<strong>of</strong>it difference<br />
ment employment between<br />
for-pr<strong>of</strong>it and<br />
not-for-pr<strong>of</strong>it 1<br />
Total, all occupations .......................... 1,690,210 115,950 $20.06 $17.04 100.0 100.0 ... $3.02<br />
Management ................................................... 140,820 9,330 45.89 38.91 8.3 8.0 ( 2 ) 6.98<br />
Business and financial operations ............ 275,990 17,120 28.87 21.32 16.3 14.8 10 7.55<br />
Training and development<br />
specialists ................................................... 5,550 590 23.29 21.90 .33 .51 –54 1.39<br />
Business operations specialists,<br />
all other....................................................... 15,100 720 29.65 23.86 .89 .62 31 5.79<br />
Accountants and auditors ....................... 24,340 1,900 26.40 22.80 1.44 1.64 ( 2 ) 3.60<br />
Credit analysts ............................................. 14,820 480 28.20 20.92 .88 .42 52 7.28<br />
Financial analysts ....................................... 16,670 200 34.43 27.25 .99 .17 83 7.18<br />
Personal financial advisors ...................... 23,680 250 36.62 36.59 1.40 .22 84 ( 2 )<br />
Loan counselors .......................................... 4,320 540 22.01 16.62 .26 .47 –83 5.39<br />
Loan <strong>of</strong>ficers ................................................. 121,560 10,860 27.80 20.35 7.19 9.37 –30 7.45<br />
Financial specialists, all other ................. 19,390 480 27.41 22.84 1.15 .41 64 4.57<br />
Computer and mathematical ..................... 53,280 2,350 32.58 24.47 3.2 2.0 36 8.11<br />
Life, physical, and social science ............... 4,510 490 29.76 24.47 .3 .4 –59 5.29<br />
Legal .................................................................... 3,140 60 44.57 34.94 .2 .1 71 ( 2 )<br />
Arts, design, entertainment, sports, and<br />
media ......................................................... 3,520 450 24.61 20.86 .2 .4 –88 3.75<br />
Protective service ........................................... 4,240 440 17.16 20.28 .3 .4 ( 2 ) ( 2 )<br />
Building and grounds cleaning and<br />
maintenance ............................................ 7,260 400 9.48 11.34 .4 .3 19 –1.86<br />
Sales and related ............................................ 80,790 1,460 26.92 23.26 4.8 1.3 74 3.66<br />
Securities, commodities, and financial<br />
services sales agents .............................. 48,930 610 29.35 23.40 2.89 .53 82 5.95<br />
Sales representatives, services,<br />
all other....................................................... 16,010 380 21.95 21.04 .95 .33 66 ( 2 )<br />
Office and administrative support ........... 1,111,640 83,430 13.47 13.34 65.8 72.0 –9 ( 2 )<br />
First-line supervisors/managers <strong>of</strong><br />
<strong>of</strong>fice and administrative support<br />
workers ...................................................... 103,460 7,570 21.25 20.84 6.12 6.52 ( 2 ) ( 2 )<br />
Bill and account collectors ...................... 20,290 2,570 15.35 15.35 1.20 2.22 –85 ( 2 )<br />
Bookkeeping, accounting, and<br />
auditing clerks .......................................... 58,020 3,890 13.90 14.80 3.43 3.35 ( 2 ) –.90<br />
Tellers .............................................................. 503,950 41,000 10.88 11.19 29.82 35.36 –19 –.31<br />
Customer service representatives ........ 97,520 7,330 14.36 13.99 5.77 6.32 ( 2 ) ( 2 )<br />
Loan interviewers and clerks ................. 74,030 6,600 15.18 14.80 4.38 5.69 –30 ( 2 )<br />
New accounts clerks .................................. 68,430 5,650 14.06 13.57 4.05 4.87 –20 .49<br />
Receptionists and information<br />
clerks ............................................................ 8,040 1,010 11.20 11.09 .48 .87 –83 ( 2 )<br />
Executive secretaries and<br />
administrative <strong>as</strong>sistants ...................... 34,600 1,350 18.99 18.29 2.05 1.16 43 .70<br />
Office clerks, general ................................. 37,740 2,020 12.32 11.94 2.23 1.74 22 .38<br />
Installation, maintenance, and repair ..... 3,410 330 16.19 16.70 .2 .3 –43 ( 2 )<br />
Production ........................................................ 320 ( 3 ) 18.94 ( 3 ) .0 .0 49 ( 2 )<br />
1 This refers to the relative percentage difference between for-pr<strong>of</strong>it and<br />
not-for-pr<strong>of</strong>it percentage <strong>of</strong> employment, using the for-pr<strong>of</strong>it percentage <strong>as</strong><br />
a b<strong>as</strong>e, which allows occupations with low and high levels <strong>of</strong> employment to<br />
be more e<strong>as</strong>ily compared.<br />
2 All differences are statistically significant at the 90-percent confidence<br />
level, except those marked <strong>as</strong> footnote 2.<br />
cent <strong>of</strong> employment in for-pr<strong>of</strong>it establishments and only<br />
0.5 percent in not-for-pr<strong>of</strong>it establishments. Finally, forpr<strong>of</strong>it<br />
establishments employed relatively more computer<br />
and mathematical workers, which may be a function <strong>of</strong> the<br />
greater urgency for innovation in the for-pr<strong>of</strong>it sector.<br />
3 Data not available.<br />
NOTE: Occupations that are indented are categories <strong>of</strong> the nonindented<br />
occupational groups and enter into each respective occupational<br />
group’s estimate. <strong>The</strong>y are broken out from the occupational groups in<br />
order to provide more detail where necessary.<br />
Social advocacy organizations<br />
<strong>The</strong> industry that most typifies what is generally considered<br />
to be not-for-pr<strong>of</strong>it work is the social advocacy<br />
industry, which comprises “establishments primarily en-<br />
Monthly Labor Review • November 2008 21