Ipswich Housing Market Area Strategic Housing Market Assessment
Ipswich Housing Market Area Strategic Housing Market Assessment
Ipswich Housing Market Area Strategic Housing Market Assessment

Create successful ePaper yourself
Turn your PDF publications into a flip-book with our unique Google optimized e-Paper software.
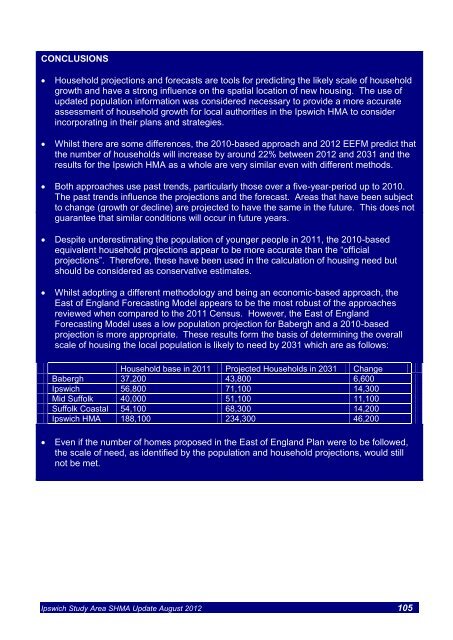
CONCLUSIONSHousehold projections and forecasts are tools for predicting the likely scale of householdgrowth and have a strong influence on the spatial location of new housing. The use ofupdated population information was considered necessary to provide a more accurateassessment of household growth for local authorities in the <strong>Ipswich</strong> HMA to considerincorporating in their plans and strategies.Whilst there are some differences, the 2010-based approach and 2012 EEFM predict thatthe number of households will increase by around 22% between 2012 and 2031 and theresults for the <strong>Ipswich</strong> HMA as a whole are very similar even with different methods. Both approaches use past trends, particularly those over a five-year-period up to 2010.The past trends influence the projections and the forecast. <strong>Area</strong>s that have been subjectto change (growth or decline) are projected to have the same in the future. This does notguarantee that similar conditions will occur in future years.Despite underestimating the population of younger people in 2011, the 2010-basedequivalent household projections appear to be more accurate than the “officialprojections”. Therefore, these have been used in the calculation of housing need butshould be considered as conservative estimates.Whilst adopting a different methodology and being an economic-based approach, theEast of England Forecasting Model appears to be the most robust of the approachesreviewed when compared to the 2011 Census. However, the East of EnglandForecasting Model uses a low population projection for Babergh and a 2010-basedprojection is more appropriate. These results form the basis of determining the overallscale of housing the local population is likely to need by 2031 which are as follows:Household base in 2011 Projected Households in 2031 ChangeBabergh 37,200 43,800 6,600<strong>Ipswich</strong> 56,800 71,100 14,300Mid Suffolk 40,000 51,100 11,100Suffolk Coastal 54,100 68,300 14,200<strong>Ipswich</strong> HMA 188,100 234,300 46,200Even if the number of homes proposed in the East of England Plan were to be followed,the scale of need, as identified by the population and household projections, would stillnot be met.<strong>Ipswich</strong> Study <strong>Area</strong> SHMA Update August 2012 105