ABRAF STATISTICAL YEARBOOK - Associação Brasileira de ...
ABRAF STATISTICAL YEARBOOK - Associação Brasileira de ...
ABRAF STATISTICAL YEARBOOK - Associação Brasileira de ...

Create successful ePaper yourself
Turn your PDF publications into a flip-book with our unique Google optimized e-Paper software.
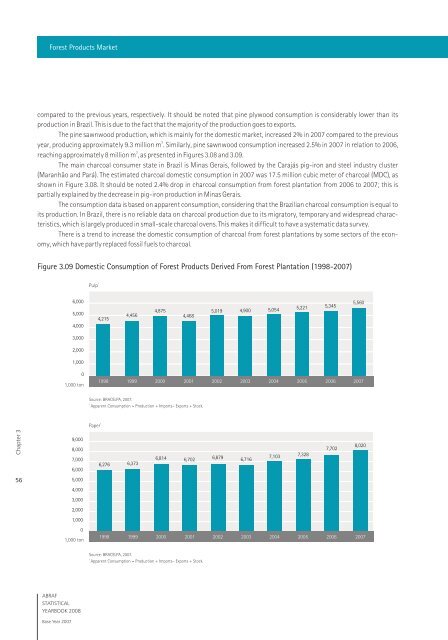
Forest Products Marketcompared to the previous years, respectively. It should be noted that pine plywood consumption is consi<strong>de</strong>rably lower than itsproduction in Brazil. This is due to the fact that the majority of the production goes to exports.The pine sawnwood production, which is mainly for the domestic market, increased 2% in 2007 compared to the previous3year, producing approximately 9.3 million m . Similarly, pine sawnwood consumption increased 2.5% in 2007 in relation to 2006,3reaching approximately 8 million m , as presented in Figures 3.08 and 3.09.The main charcoal consumer state in Brazil is Minas Gerais, followed by the Carajás pig-iron and steel industry cluster(Maranhão and Pará). The estimated charcoal domestic consumption in 2007 was 17.5 million cubic meter of charcoal (MDC), asshown in Figure 3.08. It should be noted 2.4% drop in charcoal consumption from forest plantation from 2006 to 2007; this ispartially explained by the <strong>de</strong>crease in pig-iron production in Minas Gerais.The consumption data is based on apparent consumption, consi<strong>de</strong>ring that the Brazilian charcoal consumption is equal toits production. In Brazil, there is no reliable data on charcoal production due to its migratory, temporary and wi<strong>de</strong>spread characteristics,which is largely produced in small-scale charcoal ovens. This makes it difficult to have a systematic data survey.There is a trend to increase the domestic consumption of charcoal from forest plantations by some sectors of the economy,which have partly replaced fossil fuels to charcoal.Figure 3.09 Domestic Consumption of Forest Products Derived From Forest Plantation (1998-2007)Pulp 16,000 5,5604,8755,019 4,900 5,054 5,221 5,3455,0004,4564,4684,2154,0003,0002,0001,00001,000 ton1998 1999 2000 2001 2002 2003 2004 2005 20062007Source: BRACELPA, 2007.1Apparent Consumption = Production + Imports– Exports + Stock.1PaperChapter 39,0008,0007,0006,0006,276 6,3736,814 6,702 6,879 6,7167,103 7,3287,7028,020565,0004,0003,0002,0001,00001,000 ton1998 1999 2000 2001 2002 2003 2004 2005 20062007Source: BRACELPA, 2007.1Apparent Consumption = Production + Imports– Exports + Stock.<strong>ABRAF</strong><strong>STATISTICAL</strong><strong>YEARBOOK</strong> 2008Base Year 2007