Ho, Tung-Yuan. Nickel limitation of nitrogen ... - Academia Sinica
Ho, Tung-Yuan. Nickel limitation of nitrogen ... - Academia Sinica
Ho, Tung-Yuan. Nickel limitation of nitrogen ... - Academia Sinica
- No tags were found...

You also want an ePaper? Increase the reach of your titles
YUMPU automatically turns print PDFs into web optimized ePapers that Google loves.
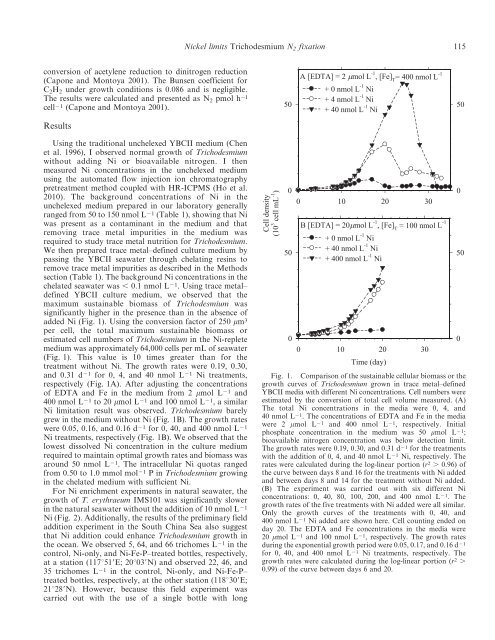
<strong>Nickel</strong> limits Trichodesmium N 2 fixation 115conversion <strong>of</strong> acetylene reduction to di<strong>nitrogen</strong> reduction(Capone and Montoya 2001). The Bunsen coefficient forC 2 H 2 under growth conditions is 0.086 and is negligible.The results were calculated and presented as N 2 pmol h 2lcell 21 (Capone and Montoya 2001).ResultsUsing the traditional unchelexed YBCII medium (Chenet al. 1996), I observed normal growth <strong>of</strong> Trichodesmiumwithout adding Ni or bioavailable <strong>nitrogen</strong>. I thenmeasured Ni concentrations in the unchelexed mediumusing the automated flow injection ion chromatographypretreatment method coupled with HR-ICPMS (<strong>Ho</strong> et al.2010). The background concentrations <strong>of</strong> Ni in theunchelexed medium prepared in our laboratory generallyranged from 50 to 150 nmol L 21 (Table 1), showing that Niwas present as a contaminant in the medium and thatremoving trace metal impurities in the medium wasrequired to study trace metal nutrition for Trichodesmium.We then prepared trace metal–defined culture medium bypassing the YBCII seawater through chelating resins toremove trace metal impurities as described in the Methodssection (Table 1). The background Ni concentrations in thechelated seawater was , 0.1 nmol L 21 . Using trace metal–defined YBCII culture medium, we observed that themaximum sustainable biomass <strong>of</strong> Trichodesmium wassignificantly higher in the presence than in the absence <strong>of</strong>added Ni (Fig. 1). Using the conversion factor <strong>of</strong> 250 mm 3per cell, the total maximum sustainable biomass orestimated cell numbers <strong>of</strong> Trichodesmium in the Ni-repletemedium was approximately 64,000 cells per mL <strong>of</strong> seawater(Fig. 1). This value is 10 times greater than for thetreatment without Ni. The growth rates were 0.19, 0.30,and 0.31 d 21 for 0, 4, and 40 nmol L 21 Ni treatments,respectively (Fig. 1A). After adjusting the concentrations<strong>of</strong> EDTA and Fe in the medium from 2 mmol L 21 and400 nmol L 21 to 20 mmol L 21 and 100 nmol L 21 , a similarNi <strong>limitation</strong> result was observed. Trichodesmium barelygrew in the medium without Ni (Fig. 1B). The growth rateswere 0.05, 0.16, and 0.16 d 21 for 0, 40, and 400 nmol L 21Ni treatments, respectively (Fig. 1B). We observed that thelowest dissolved Ni concentration in the culture mediumrequired to maintain optimal growth rates and biomass wasaround 50 nmol L 21 . The intracellular Ni quotas rangedfrom 0.50 to 1.0 mmol mol 21 PinTrichodesmium growingin the chelated medium with sufficient Ni.For Ni enrichment experiments in natural seawater, thegrowth <strong>of</strong> T. erythraeum IMS101 was significantly slowerin the natural seawater without the addition <strong>of</strong> 10 nmol L 21Ni (Fig. 2). Additionally, the results <strong>of</strong> the preliminary fieldaddition experiment in the South China Sea also suggestthat Ni addition could enhance Trichodesmium growth inthe ocean. We observed 5, 64, and 66 trichomes L 21 in thecontrol, Ni-only, and Ni-Fe-P–treated bottles, respectively,at a station (117u519E; 20u039N) and observed 22, 46, and35 trichomes L 21 in the control, Ni-only, and Ni-Fe-P–treated bottles, respectively, at the other station (118u309E;21u289N). <strong>Ho</strong>wever, because this field experiment wascarried out with the use <strong>of</strong> a single bottle with longFig. 1. Comparison <strong>of</strong> the sustainable cellular biomass or thegrowth curves <strong>of</strong> Trichodesmium grown in trace metal–definedYBCII media with different Ni concentrations. Cell numbers wereestimated by the conversion <strong>of</strong> total cell volume measured. (A)The total Ni concentrations in the media were 0, 4, and40 nmol L 21 . The concentrations <strong>of</strong> EDTA and Fe in the mediawere 2 mmol L 21 and 400 nmol L 21 , respectively. Initialphosphate concentration in the medium was 50 mmol L 21 ;bioavailable <strong>nitrogen</strong> concentration was below detection limit.The growth rates were 0.19, 0.30, and 0.31 d 21 for the treatmentswith the addition <strong>of</strong> 0, 4, and 40 nmol L 21 Ni, respectively. Therates were calculated during the log-linear portion (r 2 . 0.96) <strong>of</strong>the curve between days 8 and 16 for the treatments with Ni addedand between days 8 and 14 for the treatment without Ni added.(B) The experiment was carried out with six different Niconcentrations: 0, 40, 80, 100, 200, and 400 nmol L 21 . Thegrowth rates <strong>of</strong> the five treatments with Ni added were all similar.Only the growth curves <strong>of</strong> the treatments with 0, 40, and400 nmol L 21 Ni added are shown here. Cell counting ended onday 20. The EDTA and Fe concentrations in the media were20 mmol L 21 and 100 nmol L 21 , respectively. The growth ratesduring the exponential growth period were 0.05, 0.17, and 0.16 d 21for 0, 40, and 400 nmol L 21 Ni treatments, respectively. Thegrowth rates were calculated during the log-linear portion (r 2 .0.99) <strong>of</strong> the curve between days 6 and 20.