Regional Tropical Precipitation Change ... - Academia Sinica
Regional Tropical Precipitation Change ... - Academia Sinica
Regional Tropical Precipitation Change ... - Academia Sinica

You also want an ePaper? Increase the reach of your titles
YUMPU automatically turns print PDFs into web optimized ePapers that Google loves.
1SEPTEMBER 2006 C H O U E T A L . 4207<br />
<strong>Regional</strong> <strong>Tropical</strong> <strong>Precipitation</strong> <strong>Change</strong> Mechanisms in ECHAM4/OPYC3 under<br />
Global Warming*<br />
CHIA CHOU<br />
Research Center for Environmental <strong>Change</strong>s, <strong>Academia</strong> <strong>Sinica</strong>, Taipei, Taiwan<br />
J. DAVID NEELIN<br />
Department of Atmospheric Sciences, and Institute of Geophysics and Planetary Physics, University of California,<br />
Los Angeles, Los Angeles, California<br />
JIEN-YI TU<br />
Research Center for Environmental <strong>Change</strong>s, <strong>Academia</strong> <strong>Sinica</strong>, Taipei, Taiwan<br />
CHENG-TA CHEN<br />
Department of Earth Sciences, National Taiwan Normal University, Taipei, Taiwan<br />
(Manuscript received 25 July 2005, in final form 20 December 2005)<br />
ABSTRACT<br />
Mechanisms of global warming impacts on regional tropical precipitation are examined in a coupled<br />
atmosphere–ocean general circulation model (ECHAM4/OPYC3). The pattern of the regional tropical<br />
precipitation changes, once established, tends to persist, growing in magnitude as greenhouse gases increase.<br />
The sulfate aerosol induces regional tropical precipitation anomalies similar to the greenhouse gases but<br />
with opposite sign, thus reducing the early signal. Evidence for two main mechanisms, the upped-ante and<br />
the anomalous gross moist stability (M) mechanisms (previously proposed in an intermediate complexity<br />
model), is found in this more comprehensive coupled general circulation model. Preferential moisture<br />
increase occurs in convection zones. The upped-ante mechanism signature of dry advection from nonconvective<br />
regions is found in tropical drought regions on the margins of convection zones. Here advection in<br />
both the atmospheric boundary layer and lower free troposphere are found to be important, with an<br />
additional contribution from horizontal temperature transport in some locations. The signature of the M<br />
mechanism—moisture convergence due to increased moisture in regions of large mean vertical motion—<br />
enhances precipitation within strong convective regions. Ocean dynamical feedbacks can be assessed by net<br />
surface flux, the main example being the El Niño–like shift of the equatorial Pacific convection zone.<br />
Cloud–radiative feedbacks are found to oppose precipitation anomalies over ocean regions.<br />
1. Introduction<br />
Anthropogenic forcings, such as greenhouse gases<br />
and aerosols, are starting to change the global climate.<br />
The recent and projected future warming tendency has<br />
* Institute of Geophysics and Planetary Physics, University of<br />
California, Los Angeles, Contribution Number 6243.<br />
Corresponding author address: Chia Chou, Research Center for<br />
Environmental <strong>Change</strong>s, <strong>Academia</strong> <strong>Sinica</strong>, P.O. Box 1-48, Taipei<br />
11529, Taiwan.<br />
E-mail: chiachou@rcec.sinica.edu.tw<br />
been extensively studied with coupled atmosphere–<br />
ocean general circulation model (Manabe et al. 1991;<br />
Hansen et al. 1995; and recent studies, e.g., Watterson<br />
and Dix 1999; Boer et al. 2000; Dai et al. 2001b; Delworth<br />
and Knutson 2000; Held and Soden 2000; Meehl<br />
et al. 2000; Mitchell et al. 2000; Washington et al. 2000;<br />
Houghton et al. 2001; Yonetani and Gordon 2001; Lucarini<br />
and Russell 2002; Meehl et al. 2005). Projected<br />
tropical precipitation changes are large in many climate<br />
models (e.g., Roeckner et al. 1999; Boer et al. 2000;<br />
Meehl et al. 2000; Dai et al. 2001a; Williams et al. 2001;<br />
Allen and Ingram 2002; Douville et al. 2002; Meehl et<br />
al. 2003). However, little agreement on regional tropi-<br />
© 2006 American Meteorological Society
4208 JOURNAL OF CLIMATE VOLUME 19<br />
cal precipitation changes is found among models since<br />
these involve complicated processes in interaction of<br />
large-scale dynamics and tropical convection (e.g.,<br />
Houghton et al. 2001; Neelin et al. 2003, hereafter<br />
NCS03). Unlike the temperature change, which is<br />
warming almost everywhere, the precipitation change<br />
has a strong spatial variation with positive and negative<br />
anomalies on a regional scale.<br />
Chou and Neelin (2004, hereafter CN04) examined<br />
mechanisms of global warming impacts on regional<br />
tropical precipitation by using an atmospheric model of<br />
intermediate complexity [the quasi-equilibrium tropical<br />
circulation model (QTCM)] coupled with a mixed layer<br />
ocean (Neelin and Zeng 2000; Zeng et al. 2000). In their<br />
study, two dominant mechanisms are responsible for<br />
regional tropical precipitation anomalies: the uppedante<br />
mechanism and the anomalous gross moist stability<br />
(M) mechanism. Under convective quasi-equilibrium<br />
(QE), the low-level moisture over convective regions<br />
is enhanced in response to the warming induced<br />
by the greenhouse effect. The effect linking low-level<br />
moisture with tropospheric temperature is termed “QE<br />
mediation” (Neelin and Su 2005). This QE mediation<br />
does not influence low-level moisture over nonconvective<br />
regions, which is affected by different processes,<br />
such as a balance between horizontal moisture advection<br />
and evaporation, so the increase of low-level moisture<br />
is less over nonconvective regions than over convective<br />
regions. This creates a horizontal gradient of<br />
low-level moisture anomalies, which is fundamental for<br />
the upped-ante and M mechanisms. In the upped-ante<br />
mechanism, the precipitation over margins of convective<br />
regions is reduced by import of dry air where there<br />
is mean inflow from nonconvective regions to convective<br />
regions. This occurs via the term v · q.IntheM<br />
mechanism, low-level moisture is increased over convective<br />
regions due to QE mediation. This decreases<br />
the effective static stability M. As a result, convergence<br />
and convection are enhanced in regions that had strong<br />
convergence and precipitation in the climatology. This<br />
mechanism is thus also referred to as the “rich-getricher”<br />
mechanism.<br />
To what extent can the mechanisms discussed in<br />
CN04 be applied to a more comprehensive climate<br />
model, such as a coupled atmosphere–ocean general<br />
circulation model (AOGCM) To answer this question<br />
is our primary goal and the ECHAM4/OPYC3<br />
AOGCM simulations (Roeckner et al. 1999) are analyzed<br />
in this study. The model and experiment design<br />
are described in section 2. Since simulations with and<br />
without sulfate aerosol are available, we also briefly<br />
examine the role of sulfate aerosol on regional tropical<br />
precipitation in section 3. Comparisons of the AOGCM<br />
with a coupled atmospheric GCM and mixed layer<br />
ocean model discussed in section 4 isolate the role of<br />
ocean dynamical feedback. To examine those mechanisms<br />
of global warming impacts on regional tropical<br />
precipitation that are found in CN04, moisture and<br />
moist static energy (MSE) budgets are discussed and<br />
the budgets of the AOGCM simulations are diagnosed<br />
in section 5.<br />
2. Model and experiments<br />
The AOGCM used in this study is the ECHAM4/<br />
OPYC3 model (Roeckner et al. 1999). The atmospheric<br />
component is the fourth-generation Max Planck Institute<br />
for Meteorology model (ECHAM4; Roeckner et<br />
al. 1996). The ECHAM4 model uses a 19-level sigmapressure<br />
coordinate system up to 10 hPa and prognostic<br />
equations represented by spherical harmonics with triangular<br />
truncation at wavenumber 42 (T42). In the<br />
model, the tropospheric sulfate cycle is simulated and<br />
the associated sulfate aerosol is calculated to estimate<br />
aerosol effects. The oceanic component of the<br />
AOGCM is an extended version of the OPYC model,<br />
which contains the interior ocean, the surface mixed<br />
layer, and sea ice. A detailed description can be found<br />
in Oberhuber (1993). To examine ocean dynamical<br />
feedbacks, the ECHAM4 model with T30 resolution is<br />
also coupled to a 50-m slab mixed layer ocean model<br />
with prescribed seasonal ocean heat transport and the<br />
results are compared to the AOGCM simulations.<br />
Based on the Intergovernmental Panel on Climate<br />
<strong>Change</strong> (IPCC) scenario IS92a (CO 2 concentration increasing<br />
at 1% per year after 1990; Houghton et al.<br />
1992), several global warming experiments with the<br />
ECHAM4/OPYC3 model have been performed at the<br />
Max Planck Institute for Meteorology (MPI). All runs<br />
are transient experiments in which greenhouse gases<br />
(GHGs) and aerosol are time dependent and are as<br />
described in Roeckner et al. (1999). The first global<br />
warming experiment is only forced by GHGs that are<br />
updated with observed values before 1990 and projected<br />
values after 1990. The second experiment<br />
[GHG plus sulfate aerosol direct and indirect effect and<br />
tropospheric ozone (GSDIO)] includes the tropospheric<br />
sulfate cycle in addition to the same greenhouse<br />
gases in the GHG experiment. Aerosol direct and indirect<br />
effects are included, the latter with a parameterization<br />
of the sulfate aerosol effect on cloud albedo.<br />
The tropospheric ozone distribution also changes with<br />
prescribed anthropogenic precursor emissions. The<br />
GHG experiment ends in 2100, while GSDIO is only<br />
until 2050. Note that the GSDIO experiment only includes<br />
sulfate aerosols. Other aerosol components, such<br />
as mineral dust and black carbon, are not included.
1SEPTEMBER 2006 C H O U E T A L . 4209<br />
Averages from 1961 to 1990 are used to represent current<br />
climate. The CO 2 concentration is doubled around<br />
2070–99. Two experiments with the ECHAM4 model<br />
coupled to the mixed layer ocean model (ML) done by<br />
the MPI are also used. The first is a control experiment,<br />
which is a 1000-yr run; data between years 800 and 899<br />
are used. The other experiment is an equilibrium<br />
doubled CO 2 run for 50 yr. Data between years 30 and<br />
50 are used since data before year 30 are spinup. Output<br />
from these simulations is used to examine mechanisms<br />
for regional tropical precipitation change under<br />
global warming.<br />
FIG. 1. Differences for the 2021–50 averages minus the 1961–90<br />
climatology for the GHG experiment. <strong>Precipitation</strong> (mm day 1 )<br />
in (a) JJA and (b) DJF and tropospheric temperature (°C; 850–<br />
200 hPa) in (c) JJA and (d) DJF. The thick dashed line in (a) and<br />
(b) is the 6 mm day 1 contour of the precipitation climatology in<br />
1961–90. The two boxes are the target regions (see text).<br />
3. Long-term regional precipitation: GHG versus<br />
aerosol contribution<br />
Figure 1 shows impacts of GHGs on precipitation<br />
and tropospheric temperature in the GHG experiment.<br />
The precipitation and temperature perturbations are<br />
the differences between 2021–50 and 1961–90. The largest<br />
magnitude of precipitation changes induced by<br />
GHG is concentrated in the Tropics and has both positive<br />
and negative regions. The positive precipitation<br />
anomalies over the Indian Ocean in June–August (JJA)<br />
and December–February (DJF) and over South<br />
America in DJF are mostly in convective regions. However,<br />
the positive anomalies over the equatorial Pacific<br />
Ocean are shifted slightly eastward, particularly in the<br />
winter season. The positive JJA precipitation anomalies<br />
over Africa indicate a northward shift of the convective<br />
region. Other negative precipitation anomalies<br />
are found over the southern and northern sides of intertropical<br />
convergence zone (ITCZ), such as those<br />
over the Indian and Pacific Oceans. Some negative precipitation<br />
anomalies are found over the eastern side of<br />
convective regions, such as the South Pacific convergence<br />
zone (SPCZ) and the South American convective<br />
region. Most of these regions with negative precipitation<br />
anomalies are over the margins of deep convection<br />
regions where mean flow imports air from nonconvective<br />
regions. For instance, the precipitation anomalies<br />
in two target regions (the boxes in Fig. 1b) are roughly<br />
about 0.76 and 0.59 mm day 1 averaged over the<br />
margins of the Indian Ocean and South American convective<br />
regions, respectively. Here the region with climatological<br />
precipitation between 3 and 6 mm day 1<br />
has been used as a simple definition of the convective<br />
margin. The changes of precipitation described above<br />
are qualitatively consistent with the ensemble mean<br />
change of precipitation (e.g., Allen and Ingram 2002;<br />
Houghton et al. 2001) based on multiple AOGCM<br />
simulations.<br />
The tropospheric temperature anomalies are positive<br />
everywhere (Figs. 1c,d). In the boreal summer, the tropospheric<br />
temperature anomalies have a maximum<br />
warming at high latitudes of the Northern Hemisphere<br />
and a minimum warming at high latitudes of the Southern<br />
Hemisphere. In the boreal winter, the warm temperature<br />
anomalies at high latitudes of the Northern<br />
Hemisphere are weakened, so the maximum warm tropospheric<br />
temperature anomalies are found over the<br />
Tropics. This indicates that the tropospheric temperature<br />
anomalies at high latitudes of the Northern Hemi-
4210 JOURNAL OF CLIMATE VOLUME 19<br />
FIG. 2. Same as in Fig. 1 except for the GSDIO experiment.<br />
sphere have a strong annual cycle, while the annual<br />
cycle of tropospheric temperature anomalies over the<br />
rest of the world is much weaker. This pattern of the<br />
tropospheric temperature anomalies in the boreal winter<br />
is similar to the pattern of the tropospheric temperature<br />
anomalies in El Niño (Wallace et al. 1998; Su<br />
et al. 2003) in which the warmer sea surface temperature<br />
(SST) in the eastern Pacific warms the tropical<br />
troposphere via tropical convection and wave dynamics.<br />
Figure 2 shows the results in the GSDIO experiment<br />
in which the direct and indirect effects of sulfate aerosol<br />
are included. The overall patterns of the precipitation<br />
anomalies are similar to those in Fig. 1. However, the<br />
amplitude of the precipitation anomalies is weaker for<br />
most regions, except for the central Pacific in the boreal<br />
winter. Interdecadal variance (not shown) is higher in<br />
the Pacific, and so might affect this. The sulfate aerosol<br />
has strong spatial variations (Fig. 4 of Roeckner et al.<br />
1999), but the similar spatial distribution of the precipitation<br />
anomalies in Figs. 1 and 2 implies that the aerosol<br />
local effect is small compared to the greenhouse effect<br />
even over those areas where sulfate aerosol concentration<br />
is high. The warm tropospheric temperature<br />
anomalies in Fig. 2 are also weaker than those in the<br />
GHG experiment (Figs. 1c,d). The sulfate aerosol reflects<br />
solar radiation and cools the troposphere, and<br />
then the cold temperature anomalies are spread globally<br />
by wave dynamics. Thus, the warm tropospheric<br />
temperature anomalies induced by greenhouse gases<br />
are weakened with little change in its global spatial<br />
pattern. The weakened temperature anomalies induce<br />
aerosol remote effects, such as the anomalous gross<br />
moist stability (M) and upped-ante mechanisms (Chou<br />
et al. 2005), which have similar impacts on regional<br />
precipitation to the global warming case, but with the<br />
opposite sign. For a tropical average, the aerosol effects<br />
reduce the tropospheric temperature anomalies by<br />
about 22% in the GHG experiment while the reduction<br />
of the root-mean-square of the precipitation anomalies<br />
is around 12%. The difference (not shown) tends to<br />
look like the pattern in Fig. 1 with the opposite sign<br />
(i.e., a reduction in the GHG precipitation). The pointby-point<br />
correlation of the (GSDIO GHG) pattern<br />
to the GHG pattern for all 12 months is 0.61 within<br />
20°S–20°N for those differences greater than 0.5 mm<br />
day 1 . The regression coefficient is 0.57 (i.e., aerosol<br />
effects tend to cancel a substantial part of the GHG<br />
induced precipitation pattern). The part of the (GSDIO<br />
GHG) difference that does not correlate with the<br />
GHG pattern contributes little, so the root-meansquare<br />
reduction is not as large.<br />
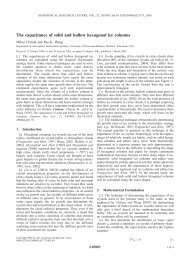
While in the long term the GHG effects tend to<br />
dominate, it is of interest to see what signal might exist<br />
in the period of present observations, including the contribution<br />
of aerosols. The results of the GSDIO experiments<br />
in the earlier period (1981–2000) is shown in Fig.<br />
3 when the greenhouse effect is relatively weak and the<br />
aerosol local effect may be relatively important. The<br />
20-yr averaging and the relatively weaker signal imply<br />
caveats with respect to decadal variability. A comparison<br />
of Figs. 3a,b to Figs. 2a,b in terms of pattern gives<br />
some sense to what signal might be detectable despite<br />
decadal variability. There is some resemblance between<br />
the patterns although there are also many regions
1SEPTEMBER 2006 C H O U E T A L . 4211<br />
FIG. 3. <strong>Precipitation</strong> differences (mm day 1 ) between the 1981–<br />
2000 and 1961–80 averages for the GSDIO experiment in (a) JJA<br />
and (b) DJF.<br />
where substantial differences occur due to decadal variability.<br />
This suggests that it may be challenging to infer<br />
the long-term GHG effect reliably from recent observed<br />
trends, except for particular regions such as eastern<br />
South America in DJF and the Caribbean in JJA.<br />
4. Atmospheric versus oceanic feedbacks<br />
To understand the oceanic feedbacks, we compare<br />
experiments with the ECHAM4 atmospheric model<br />
coupled with an ML ocean, with normal and doubled<br />
carbon dioxide concentrations, respectively. This pair<br />
of experiments with no ocean feedback (Fig. 5) is compared<br />
to the GHG experiment with differences between<br />
1961–90 and 2070–99 (Fig. 4) when carbon dioxide<br />
concentration is roughly doubled. Note that besides<br />
the difference in oceanic feedback, the ML experiments<br />
are an equilibrium simulation, but the GHG experiment<br />
is a transient simulation. For the longer GHG<br />
simulation shown in Fig. 4, the spatial distributions of<br />
the precipitation and tropospheric temperature anomalies<br />
are very similar to the anomalies in the earlier period<br />
shown in Fig. 1, but with stronger amplitude. This<br />
implies that the changes in temperature and precipitation<br />
induced by the greenhouse effect are already established<br />
in 2021–50 and the patterns tend to grow and<br />
persist over the century. Most tropical precipitation<br />
anomalies in the ML experiments (Fig. 5) are similar to<br />
those in the GHG experiment when ocean dynamical<br />
FIG. 4. Same as in Fig. 1 except for differences between 2070–99<br />
and 1961–90.<br />
feedback is included (Fig. 4), except for the Pacific. In<br />
the Pacific, oceanic feedback tends to shift the positive<br />
precipitation anomalies eastward. Without oceanic<br />
feedback, almost all positive precipitation anomalies in<br />
the Tropics occur over convective regions, while the<br />
negative precipitation anomalies occur over margins of<br />
convective regions [e.g., South America and the Indian<br />
Ocean in DJF (the boxes in Fig. 5b)]. This distribution<br />
of the regional tropical precipitation anomalies (Fig. 5)<br />
is very similar to those found in CN04. In their study,<br />
they also used an ML ocean without considering ocean
4212 JOURNAL OF CLIMATE VOLUME 19<br />
FIG. 5. Same as in Fig. 4 except for the ML experiment, which<br />
is an equilibrium doubled CO 2 simulation.<br />
FIG. 6. Surface temperature differences (°C) for the ML experiment<br />
in (a) JJA and DJF and the GHG experiment 2070–99 minus<br />
1961–90 averages in (c) JJA and (d) DJF.<br />
dynamical feedback. Those areas with similar precipitation<br />
anomaly patterns in Figs. 4 and 5, such as South<br />
America and the Indian Ocean, can be good target regions<br />
to examine the mechanisms of global warming<br />
impacts on regional precipitation that are discussed in<br />
CN04. The tropospheric temperature anomalies are<br />
surprisingly similar in Figs. 4 and 5. The only visible<br />
difference is that warmer temperature anomalies are<br />
found over the high latitudes of the Southern Hemisphere<br />
in JJA when there is no oceanic feedback (Fig.<br />
5c).<br />
To examine ocean dynamical feedback, we first compare<br />
surface temperature anomalies between the GHG<br />
and ML experiments (Fig. 6). For most areas, the results<br />
in the two experiments are quite similar. Surface<br />
temperature anomalies are warmer over land than over<br />
ocean. The high latitudes of the Northern Hemisphere<br />
in DJF have maximum surface temperature anomalies<br />
due to a reduction of snow and sea ice cover in the<br />
Northern Hemisphere (Houghton et al. 2001). This seasonal<br />
variation of the surface temperature anomalies<br />
over the Northern Hemisphere is different from the<br />
mid- and upper-tropospheric temperature anomalies
1SEPTEMBER 2006 C H O U E T A L . 4213<br />
FIG. 7. Same as in Fig. 6 except for surface heat flux (W m 2 ).<br />
(850–200 hPa) shown in Figs. 4c,d. The tropospheric<br />
temperature anomalies have a maximum at high latitudes<br />
of the Northern Hemisphere in JJA. In the Pacific,<br />
the SST anomalies between these two experiments<br />
are very different. With ocean dynamical feedback,<br />
a clear El Niño–like SST anomaly pattern is<br />
found (Figs. 6c,d), but this SST anomaly pattern is not<br />
found in the ML experiments (Figs. 6a,b). It indicates<br />
that the ocean dynamical feedback in the ECHAM4<br />
AOGCM global warming simulations exhibits similar<br />
impacts to those found in El Niño events, which has<br />
been discussed in various studies (e.g., Tett 1995; Meehl<br />
and Washington 1996; Knutson and Manabe 1998;<br />
Roeckner et al. 1999; Jin et al. 2001; Watterson 2003).<br />
That is why the positive precipitation anomalies over<br />
the Pacific shift eastward in Figs. 4a,b. An El Niño–like<br />
horseshoe pattern of negative precipitation anomalies<br />
is also found over the eastern Pacific. Note that this El<br />
Niño–like response in SST anomalies is not found in<br />
every climate model simulation. For instance, Noda et<br />
al. (1999) shows smaller warming anomalies over the<br />
eastern Pacific.<br />
To further study the ocean dynamical feedback under<br />
global warming, net surface heat flux anomalies F s<br />
are examined and the results are shown in Fig. 7. With<br />
ocean dynamical feedback, the variations of the net<br />
surface heat flux anomalies are much stronger. The net<br />
surface heat flux is balanced by ocean heat storage and<br />
transport. An overall negative net surface heat flux<br />
anomaly averaged over the globe indicates that the<br />
ocean acts as a heat sink. The ocean is warmed relatively<br />
slower than the atmosphere and land because of<br />
its heat capacity, so the ocean tends to delay the global<br />
warming induced by the greenhouse effect (e.g.,<br />
Manabe et al. 1991). This lag response induced by<br />
ocean heat capacity can affect tropical precipitation via<br />
tropospheric temperature changes (CN04). Another<br />
different feature between the GHG and ML experiments<br />
are positive heat flux anomalies in the equatorial<br />
central and eastern Pacific. This is consistent with the<br />
El Niño–like warm SST anomaly pattern found in Fig.<br />
6. The regional F s is associated with ocean heat transport<br />
and it can reach as large as 40 W m 2 (e.g., in the<br />
Pacific cold tongue). Besides the Pacific cold tongue,<br />
the western Indian Ocean in JJA also exhibits positive<br />
surface heat flux anomalies due to ocean dynamical<br />
feedback. Both the Pacific cold tongue and the western<br />
Indian Ocean have strong upwelling. Large regional F s<br />
does not necessarily induce stronger precipitation<br />
anomalies, such as at high latitudes. It is only the regions<br />
that have large F s and occur in or near-tropical<br />
convection zones that ocean dynamical feedback is important<br />
for precipitation changes. Otherwise, the atmospheric<br />
circulation is the dominant factor for inducing<br />
the precipitation anomalies.<br />
5. Diagnosis of regional precipitation mechanisms<br />
a. Moisture and moist static energy (MSE) budget<br />
The anomalous regional precipitation under global<br />
warming can be obtained from the vertically integrated<br />
moisture equation in a steady state, with the vertical<br />
integral over the troposphere defined as<br />
X 1 g<br />
p s<br />
p s p T<br />
Xdp,<br />
1
4214 JOURNAL OF CLIMATE VOLUME 19<br />
where g is gravity, p T is the depth of the troposphere,<br />
and p s is surface pressure. The moisture equation for<br />
departures from current climate is then<br />
P p q p q v · q v · q E,<br />
where P is precipitation, E is evaporation, v is horizontal<br />
velocity, and is pressure velocity. The specific humidity<br />
q is in energy units, absorbing the latent heat per<br />
unit mass, L. ()denotes climatology in the current climate<br />
(the period of 1961–90) and () is a departure<br />
from the current climate.<br />
The term p q is an atmospheric dynamical feedback<br />
associated with anomalous vertical motion ().<br />
To understand mechanisms that induce this anomalous<br />
vertical motion, the MSE budget is analyzed. The vertically<br />
integrated MSE equation in a steady state can be<br />
written as<br />
p h p s p q v · q T <br />
v · q T F s F t ,<br />
where h s q is moist static energy and s T <br />
is dry static energy, with being the geopotential.<br />
The atmospheric temperature T is in energy units,<br />
absorbing the heat capacity at constant pressure, C p .<br />
The net energy input into the atmospheric column F net<br />
is given by<br />
F net F t F s,<br />
where the net heat flux at the top of the atmosphere<br />
(TOA) can be obtained by<br />
F t S t ↓ S t ↑ R t ↑ ,<br />
and the net heat flux at the surface is<br />
F s S s ↑ S s ↓ R s ↓ R s ↑ E H.<br />
Subscripts s and t on the solar (S ↓ and S ↑ ) and longwave<br />
(R ↑ and R ↓ ) radiative terms denote surface and model<br />
top, and R ↓ t 0 has been used. Here H is the sensible<br />
heat flux. Positive values of F t and F s indicate heat<br />
fluxes into the atmospheric column.<br />
The nonlinear effects of transients and changes between<br />
current and warmer climate, p h, are neglected.<br />
Since only monthly means are used in this<br />
study, we cannot calculate the contribution of transients<br />
in the ECHAM4/OPYC3 simulations. Transients<br />
can be important in climatology; but for anomalies,<br />
their role is believed to be secondary in models where<br />
the precipitation occurs primarily through a smooth<br />
convective parameterization. This holds in QTCM<br />
simulations (CN04), although counterexamples are<br />
2<br />
3<br />
4<br />
5<br />
6<br />
known (e.g., Neelin 1987). The effect of transients<br />
should be examined in other model simulations in<br />
the future. The other term, the contribution from<br />
changes in vertical velocity and moist static energy h<br />
between 1961–90 and 2070–99, is important only when<br />
the mean state changes. For instance, the warm SST<br />
over the equatorial eastern Pacific can shift the mean<br />
state over this region from nonconvective regions to<br />
convective regions, so the nonlinear effect of p h<br />
becomes important. For most areas of interest, however,<br />
p h is secondary.<br />
b. Background for budget interpretation<br />
Before diagnosing the moisture and MSE budgets in<br />
(2) and (3), we first interpret the physical meaning of<br />
each term based on the derivation used in CN04. The<br />
approximations in this presentation are used only in the<br />
interpretation, not in the GCM diagnostics.<br />
Defining a typical vertical profile of vertical motion<br />
(p) that is associated with deep convection such that<br />
(p) · v 1 (where is assumed to vary slowly in<br />
space) yields<br />
p q M q · v 1 ,<br />
where · v 1 is the divergence induced by baroclinic<br />
winds and<br />
M q p q.<br />
Positive · v 1 indicates low-level convergence and upper-level<br />
divergence in baroclinic flow. Thus, the dynamical<br />
feedback to the anomalous precipitation in (2)<br />
is directly linked to low-level convergence with a factor<br />
M q , which is associated with vertical distribution of<br />
moisture in convective regions.<br />
Following the similar derivation to (7), p h<br />
M · v 1 and p sM s · v 1 with M p h and<br />
M s p s. Thus, · v 1 obtained from the MSE<br />
budget equation can be used in (2) to estimate the<br />
anomalous precipitation that under the above approximations<br />
is<br />
P M q<br />
M ps v · T v · T F s F t <br />
E M q<br />
M 1 p q v · q v · q.<br />
While we do not actually use (9) in the GCM diagnostics,<br />
it provides the conceptual background for interpreting<br />
terms like p q in the GCM. In (9), the<br />
anomalous precipitation is associated with the terms<br />
found in (2) and (3), but with a factor (M q /M). In con-<br />
7<br />
8<br />
9
1SEPTEMBER 2006 C H O U E T A L . 4215<br />
vective regions, the gross moist stability M measures<br />
static stability of large-scale motion and the convective<br />
available potential energy (CAPE) measures static stability<br />
of convective system. The value of M is determined<br />
by the low-level moisture effect and the cloudtop<br />
effect (Yu et al. 1998). The greater low-level moisture<br />
enhances convection, and thus increases M q and<br />
decreases M. On the other hand, the stronger convection<br />
with higher convection height enhances M. This<br />
indicates a strong cancellation of the low-level moisture<br />
effect and the cloud-top effect, so a relatively constant<br />
M is found in convective regions. More detailed discussion<br />
of M can be found in Yu et al. (1998).<br />
The sum of p s and p q is associated with the<br />
M mechanism (CN04) if T is associated with free<br />
tropical warming and q in the atmospheric boundary<br />
layer (ABL) is also enhanced by the warming. The enhancement<br />
of the ABL moisture modifies the static stability<br />
of convective regions and produces negative M.<br />
The atmosphere in convective regions becomes easier<br />
to convert, so the convection and the associated precipitation<br />
are enhanced. The stronger convection can<br />
increase convection height and then produce positive<br />
M. Thus, M depends on convection height, which is<br />
sensitive to cumulus parameterization. Because of the<br />
dependence of M on convection height, the uncertainty<br />
of determining M is a potential cause for creating different<br />
tropical precipitation anomalies among climate<br />
models. A constant M s , which is also uniform in space,<br />
is usually used in a simplified climate model to avoid<br />
the uncertainty in determining convection height, such<br />
as in QTCM (CN04). The convection height is higher in<br />
deep convection regions, so M s is larger. Thus, the constant<br />
M s tends to reduce M and slightly overemphasize<br />
the dynamic feedback via · v 1 in deep convection regions,<br />
vice versa for shallower convective regions.<br />
When a constant M s is used, that is, p s 0, the<br />
term of p q becomes the main source for inducing<br />
the M mechanism, such as in CN04.<br />
The term v · q is associated with the upped-ante<br />
mechanism if q is associated with upper-level temperature<br />
anomalies in convective regions. A warm troposphere<br />
enhances low-level moisture in convective<br />
regions because of QE mediation, but not in nonconvective<br />
regions. This induces horizontal gradient of<br />
low-level moisture anomalies. The anomalous moisture<br />
gradient induces horizontal transport of dry air via the<br />
mean flow and suppresses convection over the margins<br />
of convective regions wherever there is inflow from<br />
nonconvective regions. The term v · T is relatively<br />
small compared to v · q in the Tropics, so the effect<br />
of v · T is usually neglected, such as in CN04.<br />
However, QE mediation implies an increase in lowlevel<br />
moist static energy, and there can be a temperature<br />
contribution to this in addition to that of moisture.<br />
The other terms of horizontal advection, v · T<br />
and v · q, are dynamical feedbacks associated<br />
with v. This horizontal transport of moist static energy<br />
also induces regional precipitation anomalies and is<br />
similar to that occurring in El Niño in Pacific decent<br />
regions (Su and Neelin 2002). This effect has been defined<br />
as anomaly wind mechanisms by Neelin and Su<br />
(2005).<br />
The surface net heat flux anomalies F s are balanced<br />
by ocean heat storage and heat transport. Ocean heat<br />
storage and transport can be roughly estimated from<br />
the spatial pattern of F s without knowing the ocean<br />
circulation. Ocean heat storage tends to have wider<br />
spatial patterns, while ocean heat transport divergence<br />
can create more local features. The net heat flux<br />
anomalies at TOA F t are associated with OLR and net<br />
solar radiation at TOA. Both longwave and solar radiation<br />
are strongly related to clouds, particularly in a<br />
regional scale, so F t can be treated as a cloud–radiative<br />
feedback. A part of F t that is associated with deep convection<br />
acts like modification of gross moist stability<br />
(Su and Neelin 2002). For instance, the TOA solar radiation<br />
associated with deep convection dominates F t<br />
in the QTCM simulations (Su and Neelin 2002). Thus,<br />
F t a · v 1 0,<br />
10<br />
where a is a positive value. Replacing F t in (3) with (10)<br />
modifies the factor M with the addition of a. In other<br />
words, the shortwave cooling in regions of anomalous<br />
rising motion acts like a modification of p h in p h.<br />
In the Tropics, however, a near cancellation between<br />
the net TOA solar radiation and OLR is found over<br />
regions dominated by deep convection (Kiehl 1994;<br />
Cess et al. 2001; Hartmann et al. 2001).<br />
A large-scale average of F t has very different balances<br />
than the regional variations discussed above. The<br />
average of the term on the left of (3) and the first four<br />
terms on the right is either close to zero over the global<br />
region or exhibits a very small exchange with midlatitudes<br />
if averaged over the Tropics. Then, balances<br />
among large-scale aspects of<br />
F s F t 0,<br />
11<br />
where [] is spatial average, are crucial. These set the<br />
large-scale T pattern through variations of longwave<br />
radiation and one can trace mechanisms for T to regional<br />
tropical precipitation anomalies that are initiated<br />
by QE mediation.<br />
Finally, we note that there are substantial technical<br />
challenges to computation of MSE budgets from standard<br />
GCM diagnostics. For instance, it has been known
4216 JOURNAL OF CLIMATE VOLUME 19<br />
for some time that the sum of p s and p q terms<br />
has such a strong cancellation between large terms that<br />
estimation of the former from data interpolated to pressure<br />
levels can yield substantial error in the sum, and<br />
that contributions of transient terms can be nonnegligible<br />
(Neelin 1987). Overcoming these issues, as well as<br />
theoretical challenges in how to interpret cases where<br />
the conditions used in this section must be relaxed, is<br />
the subject of ongoing work. Here, working with standard<br />
diagnostics from an existing run, we side step these<br />
problems by focusing on key individual terms that are<br />
identified with particular mechanisms.<br />
c. Diagnosis<br />
FIG. 8. Same as in Fig. 4 except for moisture anomalies (g kg 1<br />
in the 1000–900-hPa layer in (a) JJA and (c) DJF and the 900–<br />
700-hPa layer in (b) JJA and (d) DJF. Climatological winds in<br />
1961–90 near margins of convective regions are also plotted for<br />
the same layer averages. The thick solid line is the 6 mm day 1<br />
contour of the precipitation climatology in 1961–90.<br />
In the study of CN04, QE mediation initiates a process<br />
that leads to anomalous precipitation under global<br />
warming. When the troposphere warms, low-level<br />
moisture tends to increase to maintain convective quasi<br />
equilibrium in convective regions. However, QE mediation<br />
does not occur in nonconvective regions where<br />
moisture is controlled by different processes, such as a<br />
balance between low-level divergence and evaporation<br />
that induce smaller increases in low-level moisture. The<br />
different processes controlling low-level moisture in<br />
convective and nonconvective regions create horizontal<br />
gradients of moisture anomalies. Thus, we first examine<br />
the distribution of low-level moisture in the GHG experiment.<br />
Then, (v · q) and (v · T) in the lower<br />
troposphere will be examined for the upped-ante<br />
mechanism. Finally, the term p q associated with<br />
the rich-get-richer mechanism and the p q feedbacks<br />
should also be examined in the ECHAM4/<br />
OPYC3 simulations.<br />
Figure 8 shows anomalous moisture in the ABL<br />
(1000–900 hPa) and a free atmospheric layer just above<br />
the ABL (900–700 hPa). The results indicate that moisture<br />
over the convective regions is enhanced not only in<br />
the ABL, but also in the free troposphere. The moisture<br />
increases are comparable in magnitude between<br />
the ABL and the 900–700-hPa layer with both having<br />
maximum values in deep convection regions. Moisture<br />
in the ABL increases due to surface warming even over<br />
nonconvective regions, but the ABL moisture increases<br />
are larger in convective regions (the thick solid line in<br />
Fig. 8.), enhanced by QE mediation. Convection can<br />
further transport moisture into the free atmosphere.<br />
Moisture anomalies the 900–700-hPa layer thus have<br />
very sharp maxima in convective regions. These moisture<br />
anomalies create horizontal gradients of anomalous<br />
moisture from convective regions to nonconvective<br />
regions. Besides the maximum moisture anomalies in<br />
convective regions, local maxima of the low-level moisture<br />
anomalies are also found over the central and eastern<br />
Pacific where the positive precipitation anomalies<br />
also have a maximum. Another set of local maxima of<br />
low-level moisture anomalies is found in the boreal<br />
summer over the northern margin of the convective<br />
region from Africa, across the Arabian Peninsula, to<br />
the northern Indian Peninsula. Note that the Asia summer<br />
regions also have a local maximum of low-level<br />
moisture anomalies. Thus, the maximum moisture
1SEPTEMBER 2006 C H O U E T A L . 4217<br />
anomalies are consistently found over the northern<br />
edge of the summer monsoon rainband starting from<br />
Africa to East Asia.<br />
Considering the horizontal gradient of the moisture<br />
anomalies, the next step is to examine horizontal advection<br />
of moisture in the anomaly field, which may be<br />
associated with the upped-ante mechanism discussed by<br />
CN04. In the Tropics, the term of v · q is generally<br />
smaller than the term of v · q. The only exception is<br />
the band of increased moisture in JJA in Africa and<br />
East Asia noted above, which is associated with<br />
v · q (not shown). Elsewhere, the distribution of<br />
v · q is similar to the distribution of (v · q)<br />
shown in Fig. 9. The mean winds in the lower troposphere<br />
are plotted over margins of convective regions<br />
for climatological moisture between 3 and 10 g kg 1 to<br />
indicate the regions with possible inflow of dry air (Fig.<br />
8). In JJA, strong inflow of dry air is found over the<br />
southern Indian Ocean, the eastern end of SPCZ, and<br />
the northern edge of South America. In DJF, strong<br />
inflow of dry air is also found on the north and south<br />
sides of the Indian Ocean convective region, the eastern<br />
end of SPCZ, the eastern part of South America<br />
and Africa. All these areas are consistent with negative<br />
moisture transport anomalies found in Fig. 9. Overall,<br />
the largest horizontal moisture transport anomalies<br />
(v · q) shown in Fig. 9 can be seen by examining the<br />
mean flow in Fig. 8, although the pattern of (v · q)<br />
also contains complex details. The magnitude of the<br />
horizontal moisture transport in the 700–900-hPa layer<br />
is as strong as in the ABL, so the transport in the lower<br />
free troposphere also plays an important role in the<br />
upped-ante mechanism. This was also true in CN04, but<br />
that study could not distinguish between the ABL and<br />
lower free-tropospheric transports.<br />
In nonconvective regions, (v · q) has no impact<br />
on precipitation. In convective regions, on the other<br />
hand, most negative anomalous moisture transport coincides<br />
with negative precipitation anomalies shown in<br />
Figs. 4a,b (also the thick dashed line in Fig. 9). This<br />
supports the hypothesis that the negative precipitation<br />
anomalies are induced by the upped-ante mechanism<br />
over these regions. Note that the effect of v · q can<br />
also directly contribute the anomalous precipitation in<br />
(2). More importantly, v · q can affect regional precipitation<br />
via the dynamical feedback that is associated<br />
with effects on via the MSE balance, which can be<br />
stronger than its direct effect. To further examine the<br />
upped-ante mechanism, the South American region in<br />
DJF is chosen as an example since this region has also<br />
been discussed as a target region dominated by the<br />
upped-ante mechanism in CN04. Dry advection of<br />
moisture anomalies is found over northeast Brazil, with<br />
FIG. 9. Same as in Fig. 8 except for (v · q) (W m 2 ). The<br />
thick dashed line is the 1 mmday 1 contour of the precipitation<br />
anomalies obtained from Fig. 4.<br />
the dry advection in the free atmosphere contributing<br />
more than the ABL dry advection. This indicates that<br />
the moisture transport in the lower free troposphere is<br />
more important than ABL moisture transport over<br />
South America. Other regions, such as the southern<br />
Pacific and southwestern Africa, are also dominated by<br />
lower free-troposphere dry advection. One exception is<br />
found over the northeastern tip of South America and<br />
the neighboring Atlantic Ocean, which show positive
4218 JOURNAL OF CLIMATE VOLUME 19<br />
FIG. 10. Same as in Fig. 8 except for (v · T ) (W m 2 ).<br />
anomalous moisture transport (Figs. 9b,d), but negative<br />
precipitation anomalies (Fig. 4b). Over this region,<br />
negative surface heat flux anomalies (Fig. 7d) offset the<br />
moist advection and induce the negative precipitation<br />
anomalies. Thus, an ocean dynamical feedback induces<br />
the negative precipitation anomalies over a small part<br />
of the Atlantic Ocean just north of Brazil, while the<br />
upped-ante mechanism contributes the rest of the negative<br />
precipitation anomalies over the South America–<br />
Atlantic region.<br />
The other term that also has a similar contribution to<br />
the upped-ante mechanism is v · T when transporting<br />
cold air from outside convective regions. The<br />
term v · T is relatively small compared to v · T,<br />
so v · T can be used to represent the effect of<br />
(v · T) shown in Fig. 10. Over tropical oceans,<br />
(v · T) is very small. Over tropical continents, some<br />
negative (v · T) is found over Brazil, the southwestern<br />
coast of Africa, and the western coast of Australia<br />
(Fig. 10). Over the southwestern coast of Africa and the<br />
western coast of Australia, negative (v · T) is consistent<br />
with negative (v · q), so the upped-ante<br />
mechanism has been enhanced. However, negative<br />
(v · T) contributes in a narrow band between the<br />
region of strong negative (v · q) over Brazil and<br />
the equatorial Atlantic just north of Brazil in DJF<br />
where negative F s contributes to negative precipitation<br />
anomalies. This again indicates somewhat more complicated<br />
processes inducing negative precipitation<br />
anomalies over the South America–Atlantic region in<br />
DJF than that indicated by CN04. To look at the<br />
changes over the South American region in DJF more<br />
closely, the precipitation increases about 0.29 mm<br />
day 1 over the convective region, while it decreases<br />
about 0.59 mm day 1 over the margins of convective<br />
region (3 mm day 1 P 6mmday 1 ; Fig. 11a). The<br />
negative precipitation anomalies coincide with negative<br />
[v · (T q)] in the 1000–700-hPa layer (Fig. 11b),<br />
evidence of the upped-ante mechanism. However, the<br />
upped-ante mechanism is not only from the contribution<br />
of (v · q) (Fig. 11c), but also (v · T), especially<br />
over Brazil (Fig. 11d).<br />
Computation of p h, involves challenges discussed<br />
at the end of section 5b, affecting the use of<br />
p s. We thus neglect the contribution of p s and<br />
focus on the effect of p q in this study. Neglecting<br />
the term p s will not close the MSE budget, but<br />
mechanisms associated with p q and other terms<br />
that induce anomalous vertical motion () can still be<br />
discussed. Figure 12 shows the distributions of<br />
p q and p q. The term p q can be used<br />
to roughly represent lower-tropospheric convergence<br />
since moisture is concentrated in the lower troposphere.<br />
The term p q in Figs. 12b,d is very similar<br />
to the precipitation anomalies shown in Figs. 4a,b. According<br />
to the moisture budget equation (2), p q<br />
contributes more than 80% of the anomalous precipitation<br />
in the Tropics. Other effects, such as p q,<br />
v · q and E, contribute a combined 20% of the<br />
anomalous precipitation. Thus, the dynamical feedback<br />
associated with is the most important effect for inducing<br />
the anomalous precipitation (consistent with<br />
NCS03 and CN04).<br />
The term p q can directly contribute to anoma-
1SEPTEMBER 2006 C H O U E T A L . 4219<br />
FIG. 11. Differences for the GHG experiment 2070–99 minus 1961–90 averages in DJF: (a) precipitation climatology, (b) v · (T<br />
q) (W m 2 ) in the 1000–700-hPa layer, (c) v · q in the 1000–700-hPa layer, and (d) v · T in the 1000–700-hPa layer. The<br />
thick solid and dashed lines are 1 mmday 1 contours of the precipitation anomalies obtained from Fig. 4.<br />
lous precipitation in the moisture budget (2), but it can<br />
also affect the anomalous precipitation via the dynamical<br />
feedback in (3). In CN04, this term is equivalent to<br />
the M mechanism because of the assumption of<br />
p s 0. Figures 12a,c show the pattern of<br />
p q which is similar to that of mean convection. In<br />
other words, the M mechanism associated with lowlevel<br />
moisture enhances convection over deep convection<br />
regions, consistent with CN04. In convective regions,<br />
the contribution of p q is a dominant effect<br />
inducing positive precipitation anomalies compared to<br />
the other effects shown on the rhs. of (9) and it contributes<br />
80% or more of the positive precipitation<br />
anomalies over convective regions.<br />
Another effect on regional precipitation is associated<br />
with the net energy into the atmospheric column F net ,<br />
which can be divided into F t and F s . The term F s , due to<br />
ocean heat storage and transport has been discussed in<br />
section 4. On the other hand, F t is associated mainly<br />
with the cloud–radiative feedback in the Tropics because<br />
longwave and solar radiation anomalies depend<br />
strongly on convective clouds. Figure 13 shows<br />
the distribution of F t in JJA and DJF. Over tropical<br />
oceans, negative F t coincides with positive precipitation<br />
anomalies, and vice versa for positive F t . This implies<br />
that solar radiative cooling effect is larger than the<br />
longwave radiative warming effect, so net negative<br />
cloud–radiative feedback is found over tropical oceans.<br />
Since the convective clouds are closely correlated with<br />
vertical motion, the F t cooling effect acts like a modification<br />
of p h in (3). Over some land regions, such as<br />
the central Amazon, F t exhibits a different and complicated<br />
relation with the regional precipitation. Positive<br />
precipitation anomalies are associated with positive F t ,<br />
implying a positive cloud–radiative feedback over this<br />
region. This might result from different cloud types. For
4220 JOURNAL OF CLIMATE VOLUME 19<br />
FIG. 13. Same as in Fig. 8 except for F t (W m 2 ) in (a) JJA<br />
and (b) DJF.<br />
not in equilibrium. Combined with the negative F s discussed<br />
before, the global average of F net is close to<br />
zero.<br />
FIG. 12. Same as in Fig. 8 except for p q in (a) JJA and (c)<br />
DJF and p q in (b) JJA and (d) DJF. The vertical average is<br />
from 1000 to 100 hPa Units: W m 2 .<br />
instance, more thin cirrus clouds can enhance longwave<br />
radiative warming without much solar radiative cooling,<br />
producing positive F t . Another possible reason for<br />
this positive cloud–radiative feedback is associated with<br />
larger surface albedo over land (Neelin and Su 2005).<br />
Larger surface albedo weakens the shortwave cloud–<br />
radiative feedback, but not the longwave feedback, so<br />
the net cloud–radiative feedback can become positive.<br />
The global average of F t is slightly positive. This indicates<br />
that the warming due to the greenhouse effect is<br />
6. Summary and discussion<br />
Impacts of global warming on regional tropical precipitation<br />
involve complex processes that are not well<br />
understood. Analyzing ECHAM4 AOGCM simulations<br />
with theory derived from an atmospheric model of<br />
intermediate complexity coupled with a mixed layer<br />
ocean (CN04), we examine mechanisms of global<br />
warming impacts on regional tropical precipitation.<br />
The anthropogenic forcings include the effects of<br />
greenhouse gases and sulfate aerosol. In these ECHAM4<br />
AOGCM simulations, the GHG contribution is the<br />
leading effect in regional tropical precipitation changes<br />
by 2021–50. Aerosol impacts tend to reduce the GHG<br />
signal in early periods. The pattern of the tropical precipitation<br />
anomalies induced by the greenhouse effect<br />
tends to persist and grow over the century. In other<br />
words, the pattern of the regional precipitation anomalies<br />
in the latter stage, such as 2070–99, has already<br />
been established in the earlier stage (2021–50 is shown<br />
here), and the main change is the amplitude of the<br />
precipitation anomalies. Comparing runs with and<br />
without sulfate aerosol, overall, the aerosol effect reduces<br />
the regional precipitation anomalies in magnitude<br />
and cools the whole troposphere. The effect on the<br />
tropical precipitation via the tropospheric temperature<br />
anomalies has been termed the aerosol remote effect in
1SEPTEMBER 2006 C H O U E T A L . 4221<br />
Chou et al. (2005). Aerosol local impacts on tropical<br />
precipitation change appear to be secondary in these<br />
experiments.<br />
The ocean affects the atmosphere via net surface flux<br />
anomalies F s , which are balanced by ocean heat storage<br />
and transport. Under global warming, ocean heat storage<br />
creates widespread negative F s . The atmosphere is<br />
losing energy into the ocean, so atmospheric warming is<br />
delayed by ocean heat storage (Manabe et al. 1991).<br />
Effects on tropical precipitation mediated by tropospheric<br />
temperature changes are correspondingly delayed,<br />
an effect that may be important in the early period<br />
of the global warming. A separate effect occurs<br />
through ocean dynamical feedback via ocean circulation<br />
changes and the associated ocean heat transport.<br />
Unlike the ocean heat storage, the ocean heat transport<br />
produces large F s locally, which affects regional tropical<br />
precipitation via effects on the energy budget and the<br />
associated vertical motion. In the ECHAM4 AOGCM<br />
global warming simulations, positive F s is found over<br />
the eastern Pacific, associated with an El Niño–like SST<br />
anomaly pattern. The positive F s enhances local upward<br />
motion and convection over the eastern Pacific<br />
through the MSE balance in (3). Thus, strong positive<br />
precipitation anomalies are found over the eastern Pacific.<br />
Besides the local impacts of the El Niño–like F s ,<br />
El Niño–like teleconnections can also affect regional<br />
precipitation. The negative precipitation anomalies in<br />
the eastern Pacific are similar to the well-known horseshoe<br />
pattern of subsidence during El Niño events.<br />
The net heat flux at TOA F t represents a cloud–radiative<br />
feedback in convective regions and plays a role<br />
in the magnitude of regional tropical precipitation<br />
anomalies. Over the tropical ocean, shortwave cloud–<br />
radiative cooling dominates and longwave cloud–radiative<br />
warming is relatively weak, so the net cloud–radiative<br />
feedback is negative, acting to reduce regional<br />
tropical precipitation anomalies. Over some tropical<br />
continental regions, however, the cloud–radiative feedback<br />
associated with F t is more complicated, possibly<br />
due to different cloud types and land surface albedo.<br />
Under global warming, two main mechanisms associated<br />
with atmospheric dynamical feedbacks via ,<br />
which have been discussed in CN04 are examined here:<br />
the upped-ante mechanism and the M mechanisms.<br />
The upped-ante mechanism is one possible source for<br />
tropical drought in global warming simulations and this<br />
mechanism has been proposed in NCS03 and CN04<br />
with an intermediate atmospheric model coupled with a<br />
mixed layer ocean. In this study, we find evidence for<br />
the upped-ante mechanism in the ECHAM4 simulations,<br />
although with slight modification. To initiate the<br />
upped-ante mechanism, horizontal gradients of lowlevel<br />
moisture anomalies induced by QE mediation<br />
should occur. In the ECHAM4 simulations, stronger<br />
positive moisture anomalies are found in convective regions,<br />
while weaker positive moisture anomalies are<br />
found in nonconvective regions. For those regions<br />
where the mean flow is from nonconvective regions to<br />
convective regions, evidence of the import of dry air is<br />
found. The regions with the dry air import coincide with<br />
negative tropical precipitation anomalies. This suggests<br />
that the dry air import associated with the upped-ante<br />
mechanism is responsible for the regional precipitation<br />
reductions. While NCS03 and CN04 emphasized the<br />
ABL, here we find the dry air import occurs not only in<br />
the ABL, but also in the lower free-tropospheric layer.<br />
In some places, eastern South America for instance, the<br />
drying advective tendency in the lower free troposphere<br />
is even stronger than that in the ABL. The importance<br />
of the moisture transport in the lower free<br />
troposphere (700–900 hPa) implies that the vertical<br />
moisture transport by convection is important to the<br />
horizontal moisture gradient in the upped-ante mechanism.<br />
Besides the dry air import, the energy transport<br />
associated with the ABL temperature gradient can also<br />
have a similar contribution to the upped-ante mechanism<br />
since the colder ABL has lower moist static energy,<br />
which disfavors convection. Overall, the uppedante<br />
mechanism associated with horizontal moisture<br />
transport is one major effect, although not the only one,<br />
inducing negative precipitation anomalies in the Tropics.<br />
Other effects, such as (v · T) and F s can also<br />
play a role in inducing negative precipitation anomalies.<br />
Another important mechanism for inducing positive<br />
regional tropical precipitation anomalies is the M<br />
mechanism. The gross moist stability M depends on<br />
low-level moisture and depth of convection. The lowlevel<br />
moisture effect is associated with the term<br />
p q, which is equivalent to M q · v 1 in CN04,<br />
while the effect of the depth of convection is associated<br />
with p s (or M s · v 1 ). The M mechanism discussed<br />
in CN04 is associated with the low-level moisture<br />
change. The increased low-level moisture reduces<br />
the stability of the atmosphere in convective regions<br />
and this enhances convection in strong convection regions.<br />
In the ECHAM4 results here, the tropical precipitation<br />
anomalies do increase over most strong convective<br />
regions, except over the western Pacific warm<br />
pool, which might be controlled by the El Niño–like<br />
teleconnection. Our budget analysis here is subject to<br />
the caveat that we have not been able to assess possible<br />
compensating effects by the depth of convection. However,<br />
we find that positive p q over convective<br />
regions has a clear association with positive precipita-
4222 JOURNAL OF CLIMATE VOLUME 19<br />
tion anomalies, thus providing evidence for the impact<br />
of the M or the rich-get-richer mechanism in ECHAM4.<br />
When assessing other GCM results for signatures of<br />
the upped-ante and M mechanisms, the following is a<br />
list of things that can be examined:<br />
1) increased moisture in the ABL and lower free troposphere<br />
in convection zones;<br />
2) association of advecting drying tendency v · q<br />
with negative precipitation anomalies in margins of<br />
convective regions;<br />
3) association of positive p q with positive precipitation<br />
anomalies within convection zones; and<br />
4) p q feedbacks enhancing the signals of items 2<br />
and 3 above.<br />
Acknowledgments. We thank the Global Climate<br />
Modeling group at the Max Planck Institute for Meteorology,<br />
Hamburg, Germany, especially Dr. E. Roeckner<br />
and Ms. Monika Esch, for providing access to data<br />
from their simulations. The corresponding author particularly<br />
thanks Dr. Jia-Yuh Yu for useful comments.<br />
This work was supported under National Science Council<br />
Grant 93-2111-M-001-001, the National Science<br />
Foundation Grant ATM-0082529, and the National<br />
Oceanic and Atmospheric Administration Grant<br />
NA05OAR431134.<br />
REFERENCES<br />
Allen, M. R., and W. J. Ingram, 2002: Constraints on future<br />
changes in climate and the hydrologic cycle. Nature, 419, 224–<br />
232.<br />
Boer, G. J., G. Flato, and D. Ramsden, 2000: A transient climate<br />
change simulation with green-house gas and aerosol forcing:<br />
Projected climate to the twenty-first century. Climate Dyn.,<br />
16, 427–450.<br />
Cess, R. D., M. Zhang, B. A. Wielicki, D. F. Young, X. L. Zhou,<br />
and Y. Nikitenko, 2001: The influence of the 1998 El Niño<br />
upon cloud-radiative forcing over the Pacific warm pool. J.<br />
Climate, 14, 2129–2137.<br />
Chou, C., and J. D. Neelin, 2004: Mechanisms of global warming<br />
impacts on regional tropical precipitation. J. Climate, 17,<br />
2688–2701.<br />
——, ——, U. Lohmann, and J. Feichter, 2005: Local and remote<br />
impacts of aerosol climate forcing on tropical precipitation. J.<br />
Climate, 18, 4621–4636.<br />
Dai, A., G. A. Meehl, W. M. Washington, T. M. L. Wigley, and<br />
J. M. Arblaster, 2001a: Ensemble simulation of twenty-first<br />
century climate changes: Business-as-usual versus CO 2 stabilization.<br />
Bull. Amer. Meteor. Soc., 82, 2377–2388.<br />
——, T. M. L. Wigley, B. A. Boville, J. T. Kiehl, and L. E. Buja,<br />
2001b: Climates of the twentieth and twenty-first centuries<br />
simulated by the NCAR climate system model. J. Climate, 14,<br />
485–519.<br />
Delworth, T. L., and T. R. Knutson, 2000: Simulation of early 20th<br />
century global warming. Science, 287, 2246–2250.<br />
Douville, H., F. Chauvin, S. Planton, J.-F. Royer, D. Salas-Mélia,<br />
and S. Tyteca, 2002: Sensitivity of the hydrological cycle to<br />
increasing amounts of greenhouse gases and aerosol. Climate<br />
Dyn., 20, 45–68.<br />
Hansen, J., M. Sato, and B. Ruedy, 1995: Long-term changes of<br />
the diurnal temperature cycle—Implications about mechanisms<br />
of global climate-change. Atmos. Res., 37, 175–209.<br />
Hartmann, D. L., L. A. Moy, and Q. Fu, 2001: <strong>Tropical</strong> convection<br />
and the energy balance at the top of the atmosphere. J. Climate,<br />
14, 4495–4511.<br />
Held, I. M., and B. J. Soden, 2000: Water vapor feedback and<br />
global warming. Annu. Rev. Energy Environ., 25, 441–475.<br />
Houghton, J. T., B. A. Callander, and S. K. Varney, Eds., 1992:<br />
The Supplementary Report to the IPCC Scientific Assessment.<br />
Cambridge University Press, 198 pp.<br />
——, Y. Ding, D. J. Griggs, M. Noguer, P. J. van der Linden, X.<br />
Dai, K. Maskell, and C. A. Johnson, Eds., 2001: Climate<br />
<strong>Change</strong> 2001: The Scientific Basis. Cambridge University<br />
Press, 881 pp.<br />
Jin, F.-F., Z.-Z. Hu, M. Latif, L. Bengtsson, and E. Roeckner,<br />
2001: Dynamical and cloud-radiation feedbacks in El Niño<br />
and greenhouse warming. Geophys. Res. Lett., 28, 1539–1542.<br />
Kiehl, J. T., 1994: On the observed near cancellation between<br />
longwave and shortwave cloud forcing in tropical regions. J.<br />
Climate, 7, 559–565.<br />
Knutson, T. R., and S. Manabe, 1998: Model assessment of decadal<br />
variability and trends in the tropical Pacific Ocean. J.<br />
Climate, 11, 2273–2296.<br />
Lucarini, V., and G. L. Russell, 2002: Comparison of mean climate<br />
trends in the Northern Hemisphere between National Centers<br />
for Environmental Prediction and two atmosphere-ocean<br />
model forced runs. J. Geophys. Res., 107, 4269, doi:10.1029/<br />
2001JD001247.<br />
Manabe, S., R. J. Stouffer, M. J. Spelman, and K. Bryan, 1991:<br />
Transient responses of a coupled ocean-atmosphere model to<br />
gradual changes of atmospheric CO 2 . Part I: Annual mean<br />
response. J. Climate, 4, 785–818.<br />
Meehl, G. A., and W. M. Washington, 1996: El Niño-like climate<br />
change in a model with increased atmospheric CO 2 concentrations.<br />
Nature, 382, 56–60.<br />
——, W. D. Collins, B. A. Boville, J. T. Kiehl, T. M. L. Wigley,<br />
and J. M. Arblaster, 2000: Response of the NCAR climate<br />
system model to increased CO 2 and the role of physical processes.<br />
J. Climate, 13, 1879–1898.<br />
——, W. M. Washington, T. M. L. Wigley, J. M. Arblaster, and A.<br />
Dai, 2003: Solar and greenhouse gas forcing and climate response<br />
in the twentieth century. J. Climate, 16, 426–444.<br />
——, ——, W. D. Collins, J. M. Arblaster, A. Hu, L. E. Buja,<br />
W. G. Strand, and H. Teng, 2005: How much more global<br />
warming and sea level rise Science, 307, 1769–1772.<br />
Mitchell, J. F. B., W. J. Ingram, and J. A. Lowe, 2000: The effect<br />
of stabilizing atmospheric carbon dioxide concentration on<br />
global and regional climate change. Geophys. Res. Lett., 27,<br />
2977–2980.<br />
Neelin, J. D., 1987: Simple models of steady and low-frequency<br />
circulations in the tropical atmosphere, with application to<br />
tropical air-sea interactions. Ph.D. dissertation, Princeton<br />
University, 240 pp.<br />
——, and N. Zeng, 2000: A quasi-equilibrium tropical circulation<br />
model—Formulation. J. Atmos. Sci., 57, 1741–1766.<br />
——, and H. Su, 2005: Moist teleconnection mechanisms for the<br />
tropical South American and Atlantic sector. J. Climate, 18,<br />
3928–3950.<br />
——, C. Chou, and H. Su, 2003: <strong>Tropical</strong> drought regions in global
1SEPTEMBER 2006 C H O U E T A L . 4223<br />
warming and El Niño teleconnections. Geophys. Res. Lett.,<br />
30, 2275, doi:10.1029/2003GL018625.<br />
Noda, A., K. Yamaguchi, S. Yamaki, and S. Yukimoto, 1999:<br />
Relationship between natural variability and CO 2 -induced<br />
warming pattern: MRI AOGCM experiment. Preprints, 10th<br />
Symp. on Global <strong>Change</strong> Studies, Dallas, TX, Amer. Meteor.<br />
Soc., 359–362.<br />
Oberhuber, J. M., 1993: The OPYC ocean general circulation<br />
model. DKRZ Rep. 7, Deutsches Klimarechenzentrum,<br />
Hamburg, Germany, 130 pp.<br />
Roeckner, E., and Coauthors, 1996: The atmospheric general circulation<br />
model ECHAM-4: Model description and simulation<br />
of present-day climate. Max-Planck-Institut für Meteorologie,<br />
Rep. 218, 90 pp.<br />
——, L. Bengtsson, J. Feichter, J. Lelieveld, and H. Rodhe, 1999:<br />
Transient climate change simulation with a coupled atmosphere-ocean<br />
GCM including the tropospheric sulfur cycle. J.<br />
Climate, 12, 3004–3032.<br />
Su, H., and J. D. Neelin, 2002: Teleconnection mechanisms for<br />
tropical Pacific descent anomalies during El Niño. J. Atmos.<br />
Sci., 59, 2694–2712.<br />
——, ——, and J. E. Meyerson, 2003: Sensitivity of tropical tropospheric<br />
temperature to sea surface temperature forcing. J.<br />
Climate, 16, 1283–1301.<br />
Tett, S. F. B., 1995: Simulation of El Niño–Southern Oscillationlike<br />
variability in a global coupled AOGCM adn its response<br />
to CO 2 increase. J. Climate, 8, 1473–1502.<br />
Wallace, J. M., T. P. Mitchell, E. M. Rasmusson, V. E. Kousky,<br />
E. S. Sarachik, and H. von Storch, 1998: On the structure and<br />
evolution of ENSO-related climate variability in the tropical<br />
Pacific: Lessons. J. Geophys. Res., 103, 14 241–14 259.<br />
Washington, W. M., and Coauthors, 2000: Parallel climate model<br />
(PCM) control and transient simulations. Climate Dyn., 16,<br />
755–774.<br />
Watterson, I. G., 2003: Effects of a dynamic ocean on simulated<br />
climate sensitivity to greenhouse gases. Climate Dyn., 21,<br />
197–209.<br />
——, and M. R. Dix, 1999: A comparison of present and doubled<br />
CO 2 climates and feedbacks simulated by three general circulation<br />
models. J. Geophys. Res., 104, 1943–1956.<br />
——, S. P. O’Farrell, and M. R. Dix, 1997: Energy and water<br />
transport in climates simulated by a general circulation model<br />
that includes dynamic sea ice. J. Geophys. Res., 102, 1943–<br />
1956.<br />
Williams, K. D., C. A. Senior, and J. F. B. Mitchell, 2001: Transient<br />
climate change in the Hadley Centre models: The role<br />
of physical processes. J. Climate, 14, 2659–2674.<br />
Yonetani, T., and H. B. Gordon, 2001: Simulated changes in the<br />
frequency of extremes and regional features of seasonal/<br />
annual temperature and precipitation when atmospheric CO 2<br />
is doubled. J. Climate, 14, 1765–1779.<br />
Yu, J.-Y., C. Chou, and J. D. Neelin, 1998: Estimating the gross<br />
moist stability of the tropical atmosphere. J. Atmos. Sci., 55,<br />
1354–1372.<br />
Zeng, N., J. D. Neelin, and C. Chou, 2000: A quasi-equilibrium<br />
tropical circulation model-implementation and simulation. J.<br />
Atmos. Sci., 57, 1767–1796.