MAGNETOM Flash, CMR Issue, No. 44 12.5MB - Siemens Healthcare
MAGNETOM Flash, CMR Issue, No. 44 12.5MB - Siemens Healthcare
MAGNETOM Flash, CMR Issue, No. 44 12.5MB - Siemens Healthcare

Create successful ePaper yourself
Turn your PDF publications into a flip-book with our unique Google optimized e-Paper software.
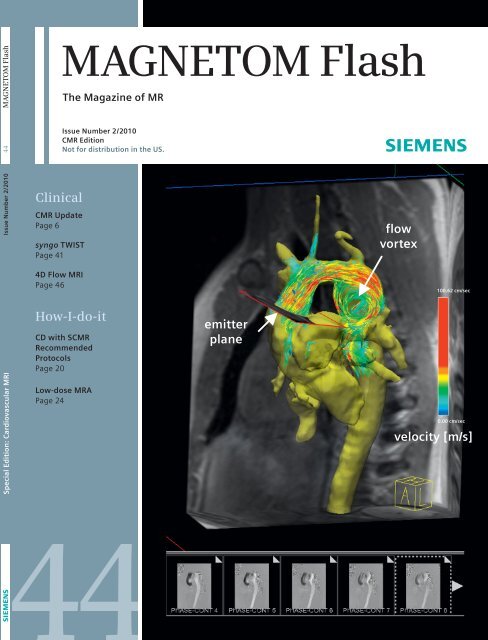
<strong>MAGNETOM</strong> <strong>Flash</strong><strong>MAGNETOM</strong> <strong>Flash</strong>The Magazine of MR<strong>Issue</strong> Number 2/2010 <strong>44</strong>Clinical<strong>CMR</strong> UpdatePage 6syngo TWISTPage 41<strong>Issue</strong> Number 2/2010<strong>CMR</strong> Edition<strong>No</strong>t for distribution in the US.flowvortex4D Flow MRIPage 46100.62 cm/secSpecial Edition: Cardiovascular MRIHow-I-do-itCD with S<strong>CMR</strong>RecommendedProtocolsPage 20Low-dose MRAPage 24emitterplane0.00 cm/secvelocity [m/s]<strong>44</strong>
EditorialMatthias Lichy, M.D.Dear <strong>MAGNETOM</strong> user,Even before the introduction of MRimaging, the visualization of vessels wasan integral part of the daily routine of aradiology department. Since MRI, however– compared to conventional DSA orCTA – we can now acquire detailed informationabout the vessels without theneed to expose the patient to radiation.And by dispensing with previously undertakeninterventions we can therebyavoid their associated risks.It’s true that radiation-free (and alsocontrast-media free) assessment of thevessels can easily be performed withultrasound. However, its high dependencyon the experience of the performingphysician, compromised diagnosticaccuracy for certain regions of the body(and clinical condition e.g. after surgicalintervention), and its limitations in evaluatinglarge areas of interest within ashort timeframe do compromise its clinicalusability. With the introduction of theTim technology, MRI is now able to scanthe vessels over large areas of interestor even as a whole-body scan, reflectingthe systemic aspect of most cardiovasculardiseases and – more importantly –with the highest diagnostic accuracy.Furthermore, all this information can beassessed within the shortest examinationtime and one single exam.For most of our older patients, however,radiation exposure is only a relativethreat. On the other hand, the impairmentof renal function in this patientcohort and other practical issues haveled to MRI using new imaging techniquesto provide highest contrast andbest timing of the vessel filling with thelowest dosages of contrast media. Thesetechniques, such as echo-sharing MRAsequences (syngo TWIST) not only allowa reduction in the amount of appliedcontrast media but can also be used toprovide detailed temporal information.The combination of high temporal andspatial resolution without the need fora risky intervention and radiation exposureis perhaps the most appealingaspect of such an imaging techniqueand is one of the reasons why temporalresolved MRA is nowadays playing anincreasingly important role in, forexample, therapy planning in cases ofperipheral vessel disease, assessment ofvessel malformations, detailed understandingof tumor perfusion and vesselsupply. This issue of <strong>MAGNETOM</strong> <strong>Flash</strong>offers you an insight into ongoingdevelopments in imaging aspects ofvessel diseases e.g. the evaluation ofhaemodynamics.We have yet to mention the biggestadvantage of MRI: its ability to provideinformation about the tissue itself andits functional state e.g. for evaluation ofbrain damage in case of stroke or heartmuscle viability in case of coronaryartery disease. This is beyond what anyother clinically available imaging methodcan achieve.One important focus of this issue is thepractical implementation of cardiac MRI.Back in 2007 we reported about thecurrent clinical status of cardiac MRI anddistributed the recommended protocolsof the Society of Cardiovascular MagneticResonance for your MR scanner. Thislatest issue contains an update of theseprotocols for the syngo MR B17 and alsoa selection of new clinical informationwhich will surely influence our daily routinein cardiac imaging.Matthias Lichy, M.D.2 <strong>MAGNETOM</strong> <strong>Flash</strong> · 2/2010 · www.siemens.com/magnetom-world
EditorialThe Editorial TeamWe appreciate your comments.Please contact us at magnetomworld.med@siemens.comAntje HellwichAssociate EditorOkan Ekinci, M.D.Center of Clinical Competence –Cardiology, Erlangen, GermanyPeter Kreisler, Ph.D.Collaborations & Applications,Erlangen, GermanyHeike Weh,Clinical Data Manager,Erlangen, GermanyBernhard Baden,Clinical Data Manager,Erlangen, GermanyIgnacio Vallines, Ph.D.,Applications Manager,Erlangen, GermanyWellesley WereMR Business DevelopmentManagerAustralia and New ZealandMilind Dhamankar, M.D.Sr. Director, MR ProductMarketing, Malvern, USAMichelle Kessler, USInstalled Base Manager,Malvern, PA, USAGary R. McNeal, MS (BME)Advanced Application Specialist,Cardiovascular MR ImagingHoffman Estates, USADr. Sunil Kumar S.L.Senior Manager Applications,Canada<strong>MAGNETOM</strong> <strong>Flash</strong> · 2/2010 · www.siemens.com/magnetom-world 3
ContentContentContent6<strong>CMR</strong> Update 20102424Xxxxxxxxxxx xxxxxxxxx Low-dose ceMRA41Peripheral vascular anomalies53Haemodynamics and vessel architecture in AVMFurther clinical informationVisit the <strong>MAGNETOM</strong> World Internet pagesat www.siemens.com/magnetom-worldfor further clinical information and talks byinternational experts.Here you will find application tips such aspositioning videos, short videos on softwareapplications, case reports, protocols andmuch more.From basic MRI information up to researchthere is relevant clinical information right atyour fingertips.ClinicalCardiovascular MRI6 Cardiovascular MagneticResonance – Update 2010.A selection of interesting new dataFlorian von Knobelsdorff-Brenkenhoff, et al.36 Case Report: Cardiac Imagingwith <strong>MAGNETOM</strong> ESSENZA.Cardiac MRI of Anteroapical Infarctionin Patient with Left VentricalAneurysm with Apical Thrombus /Tako-Tsubo like SyndromeG. Hadjidekov, G. Tonev41 Assessment and Classification ofPeripheral Vascular Anomalies byTime-Resolved MRA using TWISTUlrich Kramer, et al.45 Cardiovascular Acronyms46 4D Flow MR ImagingAlex Barker, et al.53 Case Report: Combined Assessmentof Haemodynamics andVessel Architecture in a case ofBrain AVMJens Fiehler56 Perfusion Imaging and StrokePavlina Polaskova, et al.ClinicalAbdomen/Pelvis60 Functional Prostate MR IncludingDynamic Contrast-EnhancedT1-Weighted Imaging at 1.5 TeslaWithout Endorectal Coil.First Clinical Experiences with aStudy Protocol at Multi-Imagem,BrazilLeonardo Kayat Bittencourt, et al.Clinicalk How I do it20 S<strong>CMR</strong> recommended <strong>CMR</strong> protocolsand <strong>CMR</strong> Users Guide24 Low-Dose Contrast-EnhancedMR AngiographyRoya Saleh, et al.The information presented in <strong>MAGNETOM</strong> <strong>Flash</strong> is for illustration only and is not intended to be relied upon by the reader for instruction as to the practice of medicine.Any health care practitioner reading this information is reminded that they must use their own learning, training and expertise in dealing with their individual patients. Thismaterial does not substitute for that duty and is not intended by <strong>Siemens</strong> Medical Solutions to be used for any purpose in that regard. The treating physician bears the soleresponsibility for the diagnosis and treatment of patients, including drugs and doses prescribed in connection with such use. The Operating Instructions must always be strictlyfollowed when operating the MR System. The source for the technical data is the corresponding data sheets. <strong>No</strong>t for distribution in the US.4 <strong>MAGNETOM</strong> <strong>Flash</strong> · 2/2010 · www.siemens.com/magnetom-world<strong>MAGNETOM</strong> <strong>Flash</strong> ·2/2010 · www.siemens.com/magnetom-world 5
Clinical Cardiovascular MRICardiovascular MRI ClinicalCardiovascular MagneticResonance – Update 2010A Selection of Interesting new Data1RightventricleFlorian von Knobelsdorff-Brenkenhoff, M.D.; Jeanette Schulz-Menger, M.D.Experimental and Clinical Research Center, Medical University Berlin, Charité Campus Buch and HELIOS Klinikum Berlin Buch,Dept. of Cardiology and Nephrology, Berlin, GermanyRightatriumLeftventricleIntroductionIn 2007, <strong>MAGNETOM</strong> <strong>Flash</strong> devoted acomplete issue (#36) to CardiovascularMagnetic Resonance Imaging (<strong>CMR</strong>).Since then, the acceptance of <strong>CMR</strong> asa unique and valuable imaging tool inclinical cardiology and research has furtherincreased. Very recently, large internationalsocieties launched an updateof the expert consensus document on<strong>CMR</strong> that provides a perspective on thecurrent state of this evolving technique[1]. Furthermore, attempts to standardise<strong>CMR</strong> training, protocols, examinationsand reports have been publishedwithin the last years to achieve a homogeneoushigh-level of diagnostic testingworld-wide [2, 3, 4]. Moreover, a largeGerman registry including about 11,000<strong>CMR</strong> studies underlined that the informationgained by <strong>CMR</strong> has strong impacton patient management [5]. Finally, moreand more data regarding the prognosticimpact of <strong>CMR</strong> are published [6].Many innovations have entered clinicalroutine, and many more ideas are loomingon the (pre-)clinical horizon. It wouldThe <strong>CMR</strong> issue of <strong>MAGNETOM</strong> <strong>Flash</strong> (no. 36, 2007) isavailable online at www.siemens.com/magnetom-world(International version, select <strong>MAGNETOM</strong> <strong>Flash</strong> underPublications in the upper left-hand corner)be beyond the scope of the present articleto deal with all the news in all the various<strong>CMR</strong> fields since 2007 (we recommendan excellent recently-published reviewarticle [7]). Rather, we intend to give ashort overview of some important highlightsand studies, and to touch on somefascinating future trends that may furtheremphasize the significance of <strong>CMR</strong>over the next few years.News on cardiac chamberquantificationWhereas the assessment and quantificationof ventricular function has notsignificantly changed since <strong>MAGNETOM</strong><strong>Flash</strong> #36, new and more detailed normal-valueshave been published duringrecent years. Particularly, normal valuesfor children were missing, even thoughthe interest and the need for <strong>CMR</strong> inchildren were growing. In 2009, Buechelet al. published left and right ventricularparameters in 50 children [8]. Sarikouchet al. showed gender differences whennormalized for height or body surfacearea in a group of 114 healthy childrenand adolescents [9]. In our own experience,the number of referred adolescentsfrom thoracic surgery (e.g. in case ofpectus excavatum) or for the assessmentof the right ventricle (e.g. mucoviscidosis)is growing due to frequently impairedultrasound conditions. Investigations ofyoung patients are underlining the needfor fast and robust <strong>CMR</strong> protocols andreliable post-processing and interpretation.Finally, it should be stressed thatwhenever normal values are applied,the user must consider that they shouldhave been obtained with the same<strong>CMR</strong> protocol that is applied in the user’sinstitution.News on ischemicheart disease<strong>CMR</strong> stress testing<strong>CMR</strong> stress tests, both using the analysisof first-pass perfusion during adenosineinfusion, and of wall motion abnormalitiesduring dobutamine infusion, haveentered clinical routine and are nowadaysaccepted as very accurate methods (alsosee a state-of-the-art paper regardingperfusion imaging [10]). The imagingtechniques and protocols are widelyunchanged from those described in thearticles by Markus Jochims et al. and byAndrea Arai in <strong>MAGNETOM</strong> <strong>Flash</strong> #36.However, important data regarding thediagnostic performance and the prognosticimplication have been published since1 A 21-year-old man was referred to <strong>CMR</strong> before elective surgical correction of severe pectus excavatum. <strong>CMR</strong> illustrated the pectus excavatum(white arrows). Furthermore, it newly detected right heart enlargement and severe tricuspid regurgitation due to tricuspid prolapse. Thepatient underwent concomitant tricuspid valve repair and sternal correction.then. Nandalur et al. published a largemeta-analysis in 2007 including 1516patients with perfusion imaging and 754patients with wall motion abnormalityimaging. They found a sensitivity/specificityof 91% / 81% and 83% / 86%,respectively, to detect relevant coronaryartery stenosis on a patient level [11].Moreover, in 2008 Schwitter et al. publishedthe first multi-centre multi-vendorstudy comparing <strong>CMR</strong> stress perfusionimaging with SPECT (single-photon emissioncomputed tomography) stress perfusionimaging (called “MR-IMPACT”). Thisimportant study demonstrated that <strong>CMR</strong>is either equivalent or superior to SPECTregarding the diagnostic accuracy to detectcoronary artery stenosis ≥50% assessedby invasive coronary angiography [12].Regarding <strong>CMR</strong> stress perfusion imaging,most studies had excluded patients withcoronary artery bypass grafts due topotentially altered myocardial contrastkinetics owing to more complex myocardialperfusion and different distancesof the contrast bolus through differentbypasses and native coronary vessels.Recently, two larger studies demonstratedthat even for patients after surgicalrevascularization, stress perfusion<strong>CMR</strong> yields good diagnostic accuracy forthe detection and localization of significantstenoses, even though sensitivity isreduced compared with published data inpatients without coronary bypass [13, 14].Regarding the prognostic impact of <strong>CMR</strong>stress testing, Jahnke et al. reported thatthe 3-year event-free survival was 99.2%for patients with normal stress <strong>CMR</strong>(both adenosine and dobutamine) and83.5% for those with abnormal tests.Univariate analysis showed ischemiaidentified by <strong>CMR</strong> to be predictive ofcardiac events (hazard ratio 12.5) [15].The addition of late gadolinium enhancement(LGE) imaging to stress perfusionfurther improves the risk stratificationfor patients with symptoms of ischemia.Steel et al. showed that the presenceof a perfusion deficit or myocardial scarboth maintained a >3-fold associationwith cardiac death or acute myocardialinfarction, whereas in patients withouta history of myocardial infarction, whohad negative stress <strong>CMR</strong>, LGE presencewas associated with a >11-fold hazardsincrease in death and myocardial infarction[16].<strong>CMR</strong> stress testing can be regarded asa very safe method. In 3474 stress tests(both adenosine and dobutamine)included in the German <strong>CMR</strong> registry,only five severe (defined as death,resuscitation, or any other conditionrelated to the <strong>CMR</strong> procedure thatrequired monitoring as an inpatient forat least 1 night after the <strong>CMR</strong> scan)adverse events occurred (0.14%). Thesedata are in the range of other stressimaging modalities, like dobutaminestress echocardiography (potentiallylife-threatening complications in 0.2% ina recent review [17]).The differentiation of true perfusiondefects and dark-rim artefacts during<strong>CMR</strong> stress testing is still sometimes challenging.Apart from using interpretationalgorithms – such as proposed by theteam from the Duke University [18] – onefuture solution to facilitate the correctdiagnosis may be the use of novel acceleratedhigh spatial-resolution imagingtechniques, and the step towards higherB 0 field strength, like 3T [19, 20]. Thus,future innovations are expected to furtherincrease the diagnostic accuracy of<strong>CMR</strong> stress testing and promote its widespreaduse in clinical routine.<strong>CMR</strong> in acute myocardial infarction<strong>CMR</strong> has also obtained an important rolein patients with acute myocardial infarction.Recent review articles summarized6 <strong>MAGNETOM</strong> <strong>Flash</strong> · 2/2010 · www.siemens.com/magnetom-world<strong>MAGNETOM</strong> <strong>Flash</strong> · 2/2010 · www.siemens.com/magnetom-world 7
Clinical Cardiovascular MRICardiovascular MRI Clinical2A2C2A–D A 59-year-old man complained about dyspnoea and chest pain after mild physicalexertion. <strong>CMR</strong> with adenosine stress perfusion showed a perfusion deficit predominantly inthe septum (2A–C). Coronary angiography revealed a significant stenosis of the left anteriordescending coronary artery (2D), which was treated by stent implantation.the capabilities of <strong>CMR</strong> in acute coronarysyndrome [21], and in myocardial infarctionin general [22]. Apart from demonstratingmotion abnormalities of theinfarcted wall with high blood-tissue contrastfor all 17 left ventricular segmentsin standardized planes, <strong>CMR</strong> providesnovel information about the tissue alterationsduring acute myocardial infarctionby use of T2 and T1-weighted imaging.T1-weighted imaging: late enhancementimaging after intravenous administrationof gadolinium contrast depicts irreversiblyinjured tissue. The principlesand the imaging technique (segmentedinversion recovery Turbo<strong>Flash</strong>) are stillwidely unchanged from the report by2B2DIgor Klem in <strong>MAGNETOM</strong> <strong>Flash</strong> #36.The technique is commonly regarded asrobust, very accurate and observerindependentfor the detection of infarctionin both the acute and chronic setting;this has recently been confirmed ina large multi-centre study [23].T2-weighted imaging: Abdel-Aty et al.recently gave the evidence in an animalmodel that T2-weighted imaging ofedema detects acute ischemic myocyteinjury before the onset of irreversibleinjury [24]. The bright area in T2-weightedimaging represents the area-at-risk duringmyocardial infarction. By combiningT2-weighted imaging with LGE, <strong>CMR</strong>offers the unique possibility to depict bothreversible and irreversible injury withvery high sensitivity and specificity. Thisallows for quantifying the extent ofthe salvaged area after revascularizationas an important parameter for clinicaldecision making and research [25].By using these techniques, Francone etal. demonstrated that in patients withST-elevation myocardial infarction (STEMI)treated with primary percutaneouscoronary intervention, the time to reperfusiondetermines the extent of reversibleand irreversible myocardial injury.In particular, salvaged myocardium wasmarkedly reduced when reperfusionoccurred >90 min of coronary occlusion[26]. Eitel et al. showed that the so-calledmyocardial salvage index, which is calculatedas area at risk minus infarct sizedivided by the area at risk, predicts theoutcome in acute reperfused STEMI [27].Even in patients with N(non)-STEMI,T2-weighted imaging seems to addprognostic information. In a study byRaman et al., patients with edemashowed a higher hazard of a cardiovascularevent or death within 6 monthscompared with those without edema [28].T2-weighted imaging has also beenintroduced as a method to assess thepresence of myocardial haemorrhage,visible as hypointense core within thehyperintense edema. In a study byGaname et al., myocardial haemorrhagewas an independent predictor of adverseleft ventricular remodelling at fourmonths, independent of the initialinfarct size [29]. The presence of microvascularobstruction, visible as hypointensecore within the bright zones ofLGE, or by early gadolinium enhancementimaging at 1 to 2 minutes after injection,has also turned out to be a marker forunfavourable cardiac remodelling andprognosis. Nijveldt et al. showed that inpatients after revascularized acutemyocardial infarction, the presence orabsence of microvascular obstructionproved a more powerful predictor of globaland regional functional recovery thanother characteristics like TIMI flow grade,myocardial blush grade, ST-segment resolutionand even infarct size and transmuralextent as assessed by <strong>CMR</strong> [30].In addition, studies investigated the value3A3C3Eof <strong>CMR</strong> in emergency patients. Here,T2-weighted imaging seems to be helpfulin patients presenting with acutechest pain to the emergency room todecide whether coronary angiographyshould be performed or not [31]. Finally,<strong>CMR</strong> has been proven to be a valuabletool to identify the underlying disease3B3D3A–E A 67-year-old man with known coronary artery diseasepresented with acute chest pain. Three years ago, stents wereinserted into the left anterior descending, a marginal branch, andthe right coronary artery. Coronary angiography revealed latestent thrombosis with occluded left anterior descending artery(3A), which was treated by emergent percutaneous coronaryintervention. After two days, <strong>CMR</strong> was performed, showing correspondingwall motion abnormalities on SSFP cine images, regionaledema and wall thickening on T2-weighted images (3B–C), andLGE with microvascular obstruction on T1-weighted images aftercontrast media administration (3D–E).in patients presenting with acute coronarysyndrome, but exhibit normalcoronary arteries during heart catheterization– this is a non-trivial proportionof up to 10% of patients initially diagnosedwith STEMI, and 32% with acutecoronary syndrome [22]. <strong>CMR</strong> helpsto find the correct diagnosis: somesuffer from Takotsubo cardiomyopathywith its typical reversible wall motionabnormalities and the absence of LGE;some have myocarditis with its typicalsubepicardial and intramural LGE lesions,and some exhibit LGE lesions fitting tomyocardial infarction, possibly indicatingspontaneous lysis [32, 33].8 <strong>MAGNETOM</strong> <strong>Flash</strong> · 2/2010 · www.siemens.com/magnetom-world<strong>MAGNETOM</strong> <strong>Flash</strong> · 2/2010 · www.siemens.com/magnetom-world 9
Clinical Cardiovascular MRICardiovascular MRI Clinical4A 4B 4C7A7B4A–C A 27-year-old man presented 5 years after severe embolic myocardial infarction during aortic endocarditis. Two-chamber view with LGEtechnique depicted transmural scarring of the anterior wall and the apex and an apical thrombus. Two months following oral anticoagulation,the thrombus had disappeared.56A6B7A–B A 65-year-old woman complained of chest pain, which started quite strongly two years before, and since then appeared repeatedlyduring exertion. <strong>CMR</strong> showed a large aneurysm of the inferolateral wall (7A). LGE imaging (7B) depicted thrombotic material in the aneurysm,which is identified less clear by SSFP (7A).8A8B5 A 69-year-old man withchronic myocardial infarctionand moderate mitral regurgitation.LGE imaging showed transmuralinfarction of the lateralwall with total scarring of theinferoseptal papillary muscle.6A–B A 70-year-old man with ischemic cardiomyopathy after anterior and posterior infarctionunderwent <strong>CMR</strong>. LGE imaging showed extensive myocardial scarring, including the free wall of theright ventricle (arrow). Furthermore, a thrombus in the left ventricle is visible (asterisk).8C8D<strong>CMR</strong> in chronic myocardial infarctionIn chronic myocardial infarction theimportance of <strong>CMR</strong> is mainly based onthe LGE imaging sequence. The predictionof functional recovery in ischemicdisease by <strong>CMR</strong> via assessing the transmuralityof LGE has widely replaced dobutamineechocardiography and nuclearmedicine and become accepted as theclinical gold standard [34]. Given thatquantification of infarct size by LGE ishighly reproducible, this techniqueprovides a useful surrogate end pointfor clinical trials comparing variousinfarction therapies [22, 35].The association of myocardial scardetected by LGE and increased mortalityhas already been reported in 2006 byKwong et al. The mere presence of scarresulting from myocardial infarction conferrednearly a 6-fold increased risk formajor cardiac events – even if only about1% of the left ventricle is affected [36,37]. The more scar, the higher the risk formajor cardiac adverse events: Kwon et al.found that in patients with ischemiccardiomyopathy and severely reducedejection fraction, a greater extent ofmyocardial scar, delineated by LGE <strong>CMR</strong>,was associated with increased mortality[38]. Furthermore, the composition ofLGE seems to influence the incidence ofventricular arrhythmia and prognosis ingeneral following myocardial infarction.Roes et al. performed a contrast-enhanced<strong>CMR</strong> study in patients with ischemiccardiomyopathy before ICD implantationand determined the infarct core, totalinfarct size and the infarct gray zone,which is an admixture of viable andnonviable myocytes, calculated as totalinfarct size minus infarct core, and isregarded as a measure of infarct tissueheterogeneity. The latter was the strongestpredictor of spontaneous ventriculararrhythmia with subsequent ICDtherapy (as surrogate of sudden cardiacdeath) among other clinical and <strong>CMR</strong>variables [39]. Similar results werereported by Schmidt et al. regardingenhanced susceptibility to programmedelectrical stimulation [40]. In addition,papillary muscles that lie within aninfarct zone might give rise to ventricular8 A 23-year-old subject presented with severe chest pain and ST-elevation in all leads, but no risk-factors for coronary artery disease.The immediately performed <strong>CMR</strong> showed a typical pattern for acute myocarditis. 8A Short axis SSFP in enddiastole. 8B Short axis T2-weightedimage. 8C Short axis with late enhancement. 8D Four-chamber view with late enhancement.10 <strong>MAGNETOM</strong> <strong>Flash</strong> · 2/2010 · www.siemens.com/magnetom-world<strong>MAGNETOM</strong> <strong>Flash</strong> · 2/2010 · www.siemens.com/magnetom-world 11
Clinical Cardiovascular MRICardiovascular MRI Clinical9A 9B 9Carrhythmias. Bogun et al. reported thatheterogeneous uptake of gadoliniummight be predictive of arrhythmogenicpapillary muscles [41]. Thus, LGE imagingcan improve risk stratification followingmyocardial infarction and help toidentify those subjects who benefit mostfrom prophylactic ICD implantation.Finally, infarction of the papillary musclesdetected by LGE is closely related to moresevere left ventricular remodeling andfunctional mitral regurgitation [42],which may have impact on surgical valvularconsiderations.109 A 51-year-old man complained about dyspnea at mild exertion. <strong>CMR</strong> revealed a markedly dilated left ventricle with severely depressed systolicfunction on SSFP images (9A). Late enhancement images (9B, 9C) depicted intramural fibrosis in the interventricular septum, indicating dilatedcardiomyopathy.News on non-ischemicheart diseaseAlthough cardiomyopathies (CMP) accountfor a considerable proportion of heartfailure cases, both, diagnosis and treatmentas well as the management of thesepatients still remain challenging. <strong>CMR</strong>offers a comprehensive assessment ofheart failure patients and is now the goldstandard imaging technique to assessmyocardial anatomy, regional and globalfunction, and viability [43]. The methodhas the unique potential to differentiatemyocardial injury and is expected to be10 A 45-year-oldman was referred to<strong>CMR</strong> with suspicionfor ARVC due toenlargement ofthe right ventricleas assessed byechocardiography.Using <strong>CMR</strong>, rightheart enlargementwas confirmed.Interestingly, thediagnostic criteriafor ARVC were notfulfilled in the3D-assessment. Theexplanation for theright heart enlargementwas a significanttricuspid insufficiencydue totricuspid valve prolapse.(4-chamberview, enddiastole,SSFP).of prognostic value. Therefore, a substantialnumber of papers (nearly 600 duringthe last 2 years) were published regarding<strong>CMR</strong> and non-ischemic CMP. The followingparagraph can only highlight a minority.LGE imaging is established in ischemicheart disease, and is playing an increasingrole in the assessment of CMP. Dueto the intrinsic properties of the method,LGE shows only focal fibrosis, whereasit is well-known from (patho-)physiology,that diffuse fibrosis plays an importantrole for disease progression. Flett et al.recently introduced an interesting newequilibrium approach, based on a contrast-infusion,to quantify diffuse fibrosis[<strong>44</strong>]. T2-weighted images provide usefulincremental diagnostic and prognosticinformation in a variety of clinical settingsassociated with suspected acute myocardial injury. A detailed review wasgiven recently by Matthias Friedrich [45].Especially the capability to differentiatereversible and irreversible injury by usingT2-weighted images in combinationwith contrast-enhanced <strong>CMR</strong> underlinesthe unique possibility of <strong>CMR</strong>.The impact of such a comprehensiveapproach could be shown for myocarditis[46]. Based on this comprehensiveapproach, consensus criteria to assessmyocarditis by <strong>CMR</strong> (Lake-Louise-Criteria) were published in 2009 [47].Myocardial injury could also be detectedby using <strong>CMR</strong> in various inflammatorydiseases and circumstances, like Churg-Strauss syndrome, Lupus erythematosusor following heart transplantation[48-50]. Moreover, there are first resultsthat the combined use of <strong>CMR</strong> andendomyocardial biopsy yields a diagnosticsynergy in troponine-positive patientswith normal coronary arteries [51].Dilated cardiomyopathy is one commoncause for heart failure. Comprehensivenoninvasive imaging combining <strong>CMR</strong>and PET (positron emission tomography)may give new insights into pathophysiology[52]. Furthermore, Hombach et al.reported that the cardiac index and rightventricular enddiastolic volume indexderived from <strong>CMR</strong> provided prognosticimpact for cardiac death in addition toQRS prolongation from conventional surfaceECG and diabetes mellitus in patientswith dilated cardiomyopathy. That findingunderlines the impact of cine-basedright ventricular quantification [53].The three-dimensional quantification of11A11Cthe right ventricle is also a new, clearlydefined criteria in the diagnostic guidelinesfor arrhythmogenic right ventricularcardiomyopathy (ARVC) publishedin 2010, whereas the <strong>CMR</strong>-driven tissuecharacterization failed to be included[54]. Nevertheless, there are differentpublications investigating the relationbetween scar-related right ventriculartachycardia and long-term outcome [55],underlining the need for a robust techniqueof LGE-sequences with fat-suppression,as recently described by PeterKellman [56]. The systematic review ofthe phenotype will improve the understandingof the disease and will openthe door to an earlier diagnosis also incase of relatives [57].A large amount of papers discuss thedifferentiation of left-ventricular hypertrophyusing <strong>CMR</strong> with the focus onhypertrophic cardiomyopathy (HCM).11D11BIt is well-known that LGE already occursin asymptomatic HCM-patients. However,such focal findings are also presentin patients with other types of left ventricularhypertrophy and normal coronaryarteries, like arterial hypertension, aorticstenosis or Fabry’s disease [58]. A differentpattern of LGE is described in patientswith increased left ventricular mass causedby amyloidosis. Thereby, the gadoliniumkinetics seems to reflect the severity ofthe cardiac amyloid burden [59].Regarding HCM, Rubinstein et al. demonstratedthat LGE was more prevalentin gene-positive HCM-patients. Furthermore,they found a strong associationbetween LGE and surrogates of arrhythmia[60]. Several other studies demonstrateda correlation between the presenceof LGE and mortality [61]. O’Hanlonet al. recently reported that HCM-patientswith LGE have a higher mortality due11 A 45-year-oldasymptomaticpatient showedT-inversion in leadsI, II, aVL, V3-V6in a routine ECG.Echocardiographyrevealed septalhypertrophy. <strong>CMR</strong>identified maximumwall thicknessof 30 mm and positiveLGE. Hypertrophicobstructive cardiomyopathywasdiagnosed. Twentyfour-hoursECGdemonstrated nonsustainedventriculartachycardia.Finally, the patientreceived an ICD.11A 4-chamberview in SSFP.11B Short axisview in SSFP.11C 4-chamberview in LGE imaging.11D Shortaxis view with LGEanterosptal.12 <strong>MAGNETOM</strong> <strong>Flash</strong> · 2/2010 · www.siemens.com/magnetom-world<strong>MAGNETOM</strong> <strong>Flash</strong> · 2/2010 · www.siemens.com/magnetom-world 13
Clinical Cardiovascular MRICardiovascular MRI Clinical12A 12B 12CShort axis view in diastole).12A Bicuspid aortic valve(SSFP cine in systole).12D12D Quadricuspid aortic valve with centralregurgitation (SSFP cine in diastole).to development of heart failure [62].Nevertheless, at present the data regardingLGE and sudden cardiac death arestill conflicting. In the near future, theresults of ongoing and planned multicentretrials, like one project integratedin the Euro<strong>CMR</strong> registry [63], will clarifythis important question. Regarding riskstratification in HCM in general and withrespect to LGE, an actual excellent reviewby Barry J. Maron is worth reading [64].Finally, already cine-<strong>CMR</strong> alone is helpfulin HCM, especially in case of familyscreening,because <strong>CMR</strong> identifies regionsof left ventricular hypertrophy in whichthe extent of wall thickness is underestimatedwith traditional two-dimensionalechocardiography [65].12B Tricuspid aortic valve with prominent<strong>No</strong>duli arantii (SSFP cine in systole).12E Aortic bioprosthesis(SSFP cine in diastole).12G 12H 12I12G Moderate mitral valve stenosis(SSFP cine in diastole).12E12H Moderate mitral valve stenosis(Short axis view in diastole).News on valvular heart diseaseThe assessment of valvular heart diseaseusing <strong>CMR</strong> is still mainly based on valvularvisualization using cine imaging, andflow measurements using phase-contrast,as already described by Brett Cowan et al.in <strong>MAGNETOM</strong> <strong>Flash</strong> #36. Recently,Cawley et al. published a review articleregarding this topic [43]. In addition,there are some important new aspects:Rudolph et al. found focal LGE in theleft ventricular myocardium in 62% ofpatients with left ventricular hypertrophycaused by aortic stenosis [<strong>44</strong>].Weidemann et al. reported that subjectswith aortic stenosis, who exhibitedsevere myocardial fibrosis as detected by<strong>CMR</strong>, showed less improvement in NYHA12C Mild aortic stenosis(SSFP cine in systole).12F12F Aortic bioprosthesis(SSFP cine in systole).12I Mitral bioprosthesis(SSFP cine in systole and diastole).functional class and higher mortality afteraortic valve replacement compared tothose with mild or no myocardial fibrosis[45]. Azevedo et al. reported similarresults for patients with aortic stenosisand aortic regurgitation undergoingaortic valve replacement [46]. Thus, LGE<strong>CMR</strong> may be a novel tool for risk stratificationand optimal timing of surgeryin aortic valve disease. Regarding themitral valve, Chan et al. published a valuablearticle on how to assess mitralregurgitation using <strong>CMR</strong> [47]. Han et al.reported that <strong>CMR</strong> can identify mitralvalve prolapse by the same echocardiographiccriteria. Furthermore, they foundmyocardial fibrosis involving the papillarymuscle associated with complex ventriculararrhythmias in a subgroup ofsubjects [48]. The severity of posteriorpapillary muscle region scarring asassessed by LGE seems to impact onthe surgical success after mitral repair.Flynn et al. therefore propose that preoperativescar assessing using <strong>CMR</strong> mayhelp to find the best surgical approachin patients undergoing mitral valve operation[49]. Moreover, with increasinguse of transcatheter interventions to treatmitral valve disease, the exact visualizationof the complex mitral anatomy willbe of enormous importance in achievingsatisfactory results, as recently outlinedby van Mieghem et al. <strong>CMR</strong> is regarded aspart of that preparation [50]. Followingaortic or mitral valve replacement witha biological heart valve device, <strong>CMR</strong> is asaccurate as transthoracic and transesophagealechocardiography in assessingprosthetic function, as recently shownby our group [51, 52].Nevertheless, it should be taken intoaccount when applying phase-contrastsequences to assess valve disease thatthis technique is prone to significant backgrounderror. Gatehouse et al. demonstratedin a multi-centre, multi-vendorstudy that breathhold through-planeretrospectively ECG-gated phase contrastacquisitions showed significant velocityoffset error, potentially causing about5% miscalculation of cardiac output andup to 10% error in shunt measurement[53]. To omit such errors, users areencouraged to measure within the isocenterof the magnet, where the error isless, and manufacturers are currentlyworking on improved technologies andcorrection algorithms.Future trends in CardiovascularMagnetic ResonanceToday’s visions may be tomorrow’s routine.<strong>CMR</strong> is a very active field of research,and many innovations in hardware,software and new clinical applicationsare under investigation. The followingexamples are just a small selection ofcurrent developments in <strong>CMR</strong>.13A1.5 Tesla, SSFP,7mm slice thickness13 Three-chamber view obtained using the gold-standard, SSFP cine imaging at 1.5 Tesla,and using fast gradient echo (FGRE) cine imaging in combination with a 4-element coil andacoustic cardiac triggering at 7 Tesla, demonstrating the principal feasibility of cine imagingat 7 Tesla with high spatial resolution and satisfactory tissue-blood contrast. These images,and the research in the field of <strong>CMR</strong> at 7T as a whole, were realized within close cooperationbetween the working group of <strong>CMR</strong> of the Charite Medical University Berlin, and the BerlinUltrahigh Field Facility (B.U.F.F), headed by Prof. Thoralf Niendorf, located at the Max-Delbrueck-Centre.<strong>CMR</strong> at 7 TeslaIncreasing the field strength comes alongwith increases in signal- and contrast -tonoiseratio. This benefit is expected tobe translated into higher spatial and temporalresolution and faster imaging techniques.However, increasing the fieldstrength also means dramatically increasingthe technological challenges, e.g.to achieve sufficient homogeneity of themagnetic field within the scanner. Therefore,human cardiac imaging at ultra-highfield, (currently 7T), is still experimentaland requires close cooperation betweenphysicists and physicians to find innovativetechnical solutions and develop novelsoftware and hardware components.Nevertheless, the first steps of <strong>CMR</strong> at 7Thave been successful: Cine imaging andcardiac chamber quantification can berealized in a robust and accurate mode,and the first images with impressiveblood-tissue contrast despite very small7 Tesla, FGRE,4mm slice thickness13Bslice thickness offers the promise that<strong>CMR</strong> at 7T may provide new insights intopathophysiological processes [54-56].BOLD at 3 TeslaBlood oxygen level dependent (BOLD)imaging (principle: increased oxyhemoglobinand decreased deoxyhemoglobintissue content result in higher T2* orT2 values, leading to corresponding signalenhancement on T2* or T2-weightedimaging) clearly benefits from higher fieldstrength. While at 1.5T widely impractical,stress BOLD imaging seems to workat 3T with adequate quality and sufficientdiagnostic accuracy to detect relevantcoronary artery disease [57, 58]. Furthertechnical developments may promote thispromising method in the future, and withBOLD an additional tissue marker – complementaryto the T1 and T2-weightedimages described above – may arise.14 <strong>MAGNETOM</strong> <strong>Flash</strong> · 2/2010 · www.siemens.com/magnetom-world<strong>MAGNETOM</strong> <strong>Flash</strong> · 2/2010 · www.siemens.com/magnetom-world 15
Clinical Cardiovascular MRICardiovascular MRI Clinical14A14 A 69-year-old man with aortic dilatation detected by transthoracic echocardiography was sent to <strong>CMR</strong> to assess the thoracic aorta. <strong>CMR</strong>cine imaging identified bicuspid aortic valve. Contrast-enhanced 3D angiography (14A) showed a loss of the typical sinutubular silhouette anda maximal diameter of 57 mm. <strong>No</strong>n-contrast enhanced SSFP and navigator-based 3D angiography with spatial resolution of 1.3 x 1.3 x 1.5 mm 3 ,which took 7:05 minutes to acquire, depicted the aorta with similar quality and led to the same geometric results (14B). The left coronaryartery is clearly visible. The patient was referred to cardiovascular surgery.<strong>No</strong>n-contrast-enhanced 3D angiography<strong>No</strong>n-contrast-enhanced three-dimensional(3D) angiography is desired, ascontrast media is associated with therisk for nephrogenic systemic fibrosis,requires venous puncture, and is expensive.Navigator-based, ECG triggered,3D, SSFP-based non-contrast angiographyseems to achieve the diagnosticaccuracy of the gold standard, contrastenhanced3D magnetic resonanceangiography, in first clinical trials, andmay enter clinical routine in the nearfuture [59].4D flow imagingTime-resolved, 3D phase-contrast flowimaging has been investigated and introduced– particularly by the group ofMichael Markl from Freiburg, Germany –as a novel technology to visualize bothvelocity and direction of the flowingblood and to quantify hemodynamicparameters like wall shear stress [60].This application may be extremely helpfulin understanding the pathomechanismsand flow turbulences of diseasesof the aortic valve and the aorta, andfurthermore in comprising the complexblood flow in congenital heart diseasebefore and after surgery [61]. At present,both visualization and quantification of4D flow imaging require complex postprocessingusing specific software. However,commercially available platformswith optimized workflow are currentlyon the way to integrate such analysesinto clinical practice.“4D Flow MR Imaging” by Alex Barker,Michael Markl et al. starts on page 46 ofthis issue.ElastographyToday the quantification of diastolic dysfunctionis one of the main challengesin cardiology. The accepted gold-standardis the invasive quantification of pressurevolume-curves.Nevertheless, that complexand expensive method is not commonin clinical routine. Therefore, a noninvasiveprocedure allowing the quantificationof cardiac elasticity and contractilityis warranted. Recently Elgeti et al. [62]published first results in pigs applying<strong>CMR</strong> elastography and compared theresults to left ventricular pressure. Thepromising results suggested that thereis a potential for non-invasive assessmentof pressure-volume function of theheart using <strong>CMR</strong>.14BConclusionIn conclusion, many important <strong>CMR</strong>studies regarding cardiac chamberquantification, ischemic, non-ischemicand valvular heart disease have beenpublished during the past years. Thecompacted selection summarized in thepresent article represents just a smallproportion of the intensive research thatis performed in the wide field of <strong>CMR</strong>.Nevertheless, it underlines the increasingsignificance of <strong>CMR</strong> both in clinicalroutine, and as a research tool. In particular,studies providing prognostic dataare increasingly available. In combinationwith trials about new <strong>CMR</strong> applicationsand innovative <strong>CMR</strong> techniques, thesedata will help to promote the acceptanceof <strong>CMR</strong> as a very important imagingtool complementary to other imagingmodalities, providing unique morphologicand functional cardiovascular information.References1 Hundley WG, Bluemke DA, Finn JP, Flamm SD,Fogel MA, Friedrich MG, Ho VB, Jerosch-Herold M,Kramer CM, Manning WJ, Patel M, Pohost GM,Stillman AE, White RD, Woodard PK. ACCF/ACR/AHA/NASCI/S<strong>CMR</strong> 2010 expert consensus documenton cardiovascular magnetic resonance:a report of the American College of CardiologyFoundation Task Force on Expert ConsensusDocuments. Circulation 2010;121:2462-2508.2 Kim RJ, de Roos A, Fleck E, Higgins CB, PohostGM, Prince M, Manning WJ. Guidelines fortraining in Cardiovascular Magnetic Resonance(<strong>CMR</strong>). J Cardiovasc Magn Reson 2007;9:3-4.3 Kramer CM, Barkhausen J, Flamm SD, Kim RJ,Nagel E. Standardized cardiovascular magneticresonance imaging (<strong>CMR</strong>) protocols, societyfor cardiovascular magnetic resonance: board oftrustees task force on standardized protocols.J Cardiovasc Magn Reson 2008;10:35.4 Hundley WG, Bluemke D, Bogaert JG, FriedrichMG, Higgins CB, Lawson MA, McConnell MV,Raman SV, van Rossum AC, Flamm S, Kramer CM,Nagel E, Neubauer S. Society for CardiovascularMagnetic Resonance guidelines for reportingcardiovascular magnetic resonance examinations.J Cardiovasc Magn Reson 2009;11:5.5 Bruder O, Schneider S, <strong>No</strong>thnagel D, Dill T, HombachV, Schulz-Menger J, Nagel E, Lombardi M,van Rossum AC, Wagner A, Schwitter J, Senges J,Sabin GV, Sechtem U, Mahrholdt H. Euro<strong>CMR</strong>(European Cardiovascular Magnetic Resonance)registry: results of the German pilot phase.Journal of the American College of Cardiology2009;54:1457-1466.6 Flett AS, Westwood MA, Davies LC, Mathur A,Moon JC. The prognostic implications of cardiovascularmagnetic resonance. Circ CardiovascImaging 2009;2:243-250.7 Pennell DJ. Cardiovascular magnetic resonance.Circulation 2010;121:692-705.8 Buechel EV, Kaiser T, Jackson C, Schmitz A, KellenbergerCJ. <strong>No</strong>rmal right- and left ventricular volumesand myocardial mass in children measuredby steady state free precession cardiovascularmagnetic resonance. J Cardiovasc Magn Reson2009;11:19.9 Sarikouch S, Peters B, Gutberlet M, Leismann B,Kelter-Kloepping A, Koerperich H, Kuehne T,Beerbaum P. Sex-specific pediatric percentilesfor ventricular size and mass as reference valuesfor cardiac MRI: assessment by steady-state freeprecessionand phase-contrast MRI flow. CircCardiovasc Imaging 2010;3:65-76.10 Gerber BL, Raman SV, Nayak K, Epstein FH,Ferreira P, Axel L, Kraitchman DL. Myocardialfirst-pass perfusion cardiovascular magneticresonance: history, theory, and current state ofthe art. J Cardiovasc Magn Reson 2008;10:18.11 Nandalur KR, Dwamena BA, Choudhri AF, NandalurMR, Carlos RC. Diagnostic performance ofstress cardiac magnetic resonance imaging inthe detection of coronary artery disease: ameta-analysis. Journal of the American Collegeof Cardiology 2007;50:1343-1353.12 Schwitter J, Wacker CM, van Rossum AC, LombardiM, Al-Saadi N, Ahlstrom H, Dill T, LarssonHB, Flamm SD, Marquardt M, Johansson L. MR-IMPACT: comparison of perfusion-cardiac magneticresonance with single-photon emissioncomputed tomography for the detection of coronaryartery disease in a multicentre, multivendor,randomized trial. European heart journal2008;29:480-489.13 Klein C, Nagel E, Gebker R, Kelle S, SchnackenburgB, Graf K, Dreysse S, Fleck E. Magnetic resonanceadenosine perfusion imaging in patientsafter coronary artery bypass graft surgery. Jacc2009;2:437-<strong>44</strong>5.14 Bernhardt P, Spiess J, Levenson B, Pilz G, HoflingB, Hombach V, Strohm O. Combined assessmentof myocardial perfusion and late gadoliniumenhancement in patients after percutaneous coronaryintervention or bypass grafts: a multicenterstudy of an integrated cardiovascular magneticresonance protocol. Jacc 2009;2:1292-1300.15 Jahnke C, Nagel E, Gebker R, Kokocinski T, KelleS, Manka R, Fleck E, Paetsch I. Prognostic valueof cardiac magnetic resonance stress tests:adenosine stress perfusion and dobutaminestress wall motion imaging. Circulation2007;115:1769-1776.16 Steel K, Broderick R, Gandla V, Larose E, Resnic F,Jerosch-Herold M, Brown KA, Kwong RY. Complementaryprognostic values of stress myocardialperfusion and late gadolinium enhancementimaging by cardiac magnetic resonance inpatients with known or suspected coronary arterydisease. Circulation 2009;120:1390-1400.17 Geleijnse ML, Krenning BJ, Nemes A, van DalenBM, Soliman OI, Ten Cate FJ, Schinkel AF, BoersmaE, Simoons ML. Incidence, pathophysiology, andtreatment of complications during dobutamineatropinestress echocardiography. Circulation2010;121:1756-1767.18 Klem I, Heitner JF, Shah DJ, Sketch MH, Jr., BeharV, Weinsaft J, Cawley P, Parker M, Elliott M, JuddRM, Kim RJ. Improved detection of coronary arterydisease by stress perfusion cardiovascular magneticresonance with the use of delayed enhancementinfarction imaging. Journal of the AmericanCollege of Cardiology 2006;47:1630-1638.19 Plein S, Schwitter J, Suerder D, Greenwood JP,Boesiger P, Kozerke S. k-Space and time sensitivityencoding-accelerated myocardial perfusion MRimaging at 3.0 T: comparison with 1.5 T. Radiology2008;249:493-500.20 Cheng AS, Pegg TJ, Karamitsos TD, Searle N,Jerosch-Herold M, Choudhury RP, Banning AP,Neubauer S, Robson MD, Selvanayagam JB.Cardiovascular magnetic resonance perfusionimaging at 3-tesla for the detection of coronaryartery disease: a comparison with 1.5-tesla.Journal of the American College of Cardiology2007;49:2<strong>44</strong>0-2<strong>44</strong>9.21 Lockie T, Nagel E, Redwood S, Plein S. Use ofcardiovascular magnetic resonance imaging inacute coronary syndromes. Circulation2009;119:1671-1681.22 Kim HW, Farzaneh-Far A, Kim RJ. Cardiovascularmagnetic resonance in patients with myocardialinfarction: current and emerging applications.Journal of the American College of Cardiology2009;55:1-16.23 Kim RJ, Albert TS, Wible JH, Elliott MD, Allen JC,Lee JC, Parker M, Napoli A, Judd RM. Performanceof delayed-enhancement magnetic resonanceimaging with gadoversetamide contrastfor the detection and assessment of myocardialinfarction: an international, multicenter, doubleblinded,randomized trial. Circulation2008;117:629-637.24 Abdel-Aty H, Cocker M, Meek C, Tyberg JV,Friedrich MG. Edema as a very early marker foracute myocardial ischemia: a cardiovascularmagnetic resonance study. Journal of the AmericanCollege of Cardiology 2009;53:1194-1201.25 Friedrich MG, Abdel-Aty H, Taylor A, Schulz-Menger J, Messroghli D, Dietz R. The salvagedarea at risk in reperfused acute myocardial infarctionas visualized by cardiovascular magneticresonance. Journal of the American College ofCardiology 2008;51:1581-1587.26 Francone M, Bucciarelli-Ducci C, Carbone I,Canali E, Scardala R, Calabrese FA, Sardella G,Mancone M, Catalano C, Fedele F, Passariello R,Bogaert J, Agati L. Impact of primary coronaryangioplasty delay on myocardial salvage, infarctsize, and microvascular damage in patients withST-segment elevation myocardial infarction:insight from cardiovascular magnetic resonance.Journal of the American College of Cardiology2009;54:2145-2153.27 Eitel I, Desch S, Fuernau G, Hildebrand L, GutberletM, Schuler G, Thiele H. Prognostic significanceand determinants of myocardial salvageassessed by cardiovascular magnetic resonancein acute reperfused myocardial infarction.Journal of the American College of Cardiology2010;55:2470-2479.28 Raman SV, Simonetti OP, Winner MW, 3rd, DickersonJA, He X, Mazzaferri EL, Jr., Ambrosio G.Cardiac magnetic resonance with edema imagingidentifies myocardium at risk and predictsworse outcome in patients with non-ST-segmentelevation acute coronary syndrome. Journal ofthe American College of Cardiology2010;55:2480-2488.29 Ganame J, Messalli G, Dymarkowski S, RademakersFE, Desmet W, Van de Werf F, Bogaert J.Impact of myocardial haemorrhage on left ventricularfunction and remodelling in patientswith reperfused acute myocardial infarction.European heart journal 2009;30:1<strong>44</strong>0-1<strong>44</strong>9.30 Nijveldt R, Beek AM, Hirsch A, Stoel MG, HofmanMB, Umans VA, Algra PR, Twisk JW, van RossumAC. Functional recovery after acute myocardialinfarction: comparison between angiography,electrocardiography, and cardiovascular magneticresonance measures of microvascular injury.Journal of the American College of Cardiology2008;52:181-189.16 <strong>MAGNETOM</strong> <strong>Flash</strong> · 2/2010 · www.siemens.com/magnetom-world<strong>MAGNETOM</strong> <strong>Flash</strong> · 2/2010 · www.siemens.com/magnetom-world 17
Clinical Cardiovascular MRICardiovascular MRI Clinical31 Cury RC, Shash K, Nagurney JT, Rosito G, ShapiroMD, <strong>No</strong>mura CH, Abbara S, Bamberg F, FerencikM, Schmidt EJ, Brown DF, Hoffmann U, Brady TJ.Cardiac magnetic resonance with T2-weightedimaging improves detection of patients withacute coronary syndrome in the emergencydepartment. Circulation 2008;118:837-8<strong>44</strong>.32 Eitel I, Behrendt F, Schindler K, Kivelitz D,Gutberlet M, Schuler G, Thiele H. Differentialdiagnosis of suspected apical ballooningsyndrome using contrast-enhanced magneticresonance imaging. European heart journal2008;29:2651-2659.33 Assomull RG, Lyne JC, Keenan N, Gulati A, BunceNH, Davies SW, Pennell DJ, Prasad SK. The role ofcardiovascular magnetic resonance in patientspresenting with chest pain, raised troponin, andunobstructed coronary arteries. European heartjournal 2007;28:1242-1249.34 Morton G, Schuster A, Perera D, Nagel E. Cardiacmagnetic resonance imaging to guide complexrevascularization in stable coronary artery disease.European heart journal 2010.35 Thiele H, Kappl MJ, Conradi S, Niebauer J,Hambrecht R, Schuler G. Reproducibility ofchronic and acute infarct size measurement bydelayed enhancement-magnetic resonanceimaging. Journal of the American College ofCardiology 2006;47:1641-1645.36 Kwong RY, Chan AK, Brown KA, Chan CW,Reynolds HG, Tsang S, Davis RB. Impact of unrecognizedmyocardial scar detected by cardiacmagnetic resonance imaging on event-freesurvival in patients presenting with signs orsymptoms of coronary artery disease. Circulation2006;113:2733-2743.37 Kwong RY, Sattar H, Wu H, Vorobiof G, Gandla V,Steel K, Siu S, Brown KA. Incidence and prognosticimplication of unrecognized myocardial scarcharacterized by cardiac magnetic resonance indiabetic patients without clinical evidence ofmyocardial infarction. Circulation2008;118:1011-1020.38 Kwon DH, Halley CM, Carrigan TP, Zysek V,Popovic ZB, Setser R, Schoenhagen P, Starling RC,Flamm SD, Desai MY. Extent of left ventricularscar predicts outcomes in ischemic cardiomyopathypatients with significantly reduced systolicfunction: a delayed hyperenhancement cardiacmagnetic resonance study. Jacc 2009;2:34-<strong>44</strong>.39 Roes SD, Borleffs CJ, van der Geest RJ, WestenbergJJ, Marsan NA, Kaandorp TA, Reiber JH,Zeppenfeld K, Lamb HJ, de Roos A, Schalij MJ,Bax JJ. Infarct tissue heterogeneity assessed withcontrast-enhanced MRI predicts spontaneousventricular arrhythmia in patients with ischemiccardiomyopathy and implantable cardioverterdefibrillator.Circ Cardiovasc Imaging2009;2:183-190.40 Schmidt A, Azevedo CF, Cheng A, Gupta SN,Bluemke DA, Foo TK, Gerstenblith G, Weiss RG,Marban E, Tomaselli GF, Lima JA, Wu KC. Infarcttissue heterogeneity by magnetic resonanceimaging identifies enhanced cardiac arrhythmiasusceptibility in patients with left ventriculardysfunction. Circulation 2007;115:2006-2014.41 Bogun F, Desjardins B, Crawford T, Good E, JongnarangsinK, Oral H, Chugh A, Pelosi F, MoradyF. Post-infarction ventricular arrhythmias originatingin papillary muscles. Journal of the AmericanCollege of Cardiology 2008;51:1794-1802.42 Okayama S, Uemura S, Soeda T, Onoue K, SomekawaS, Ishigami KI, Watanabe M, Nakajima T,Fujimoto S, Saito Y. Clinical significance of papillarymuscle late enhancement detected via cardiacmagnetic resonance imaging in patientswith single old myocardial infarction. Internationaljournal of cardiology 2010.43 Karamitsos TD, Francis JM, Myerson S,Selvanayagam JB, Neubauer S. The role of cardiovascularmagnetic resonance imaging inheart failure. Journal of the American Collegeof Cardiology 2009;54:1407-1424.<strong>44</strong> Flett AS, Hayward MP, Ashworth MT, Hansen MS,Taylor AM, Elliott PM, McGregor C, Moon JC.Equilibrium contrast cardiovascular magneticresonance for the measurement of diffuse myocardialfibrosis: preliminary validation in humans.Circulation 2010;122:138-1<strong>44</strong>.45 Friedrich MG. Myocardial edema – a new clinicalentity? Nat Rev Cardiol 2010;7:292-296.46 Zagrosek A, Abdel-Aty H, Boyé P, Wassmuth R,Messroghli D, Utz W, Rudolph A, Bohl S, Dietz R,Schulz-Menger J. Cardiac magnetic resonancemonitors reversible and irreversible myocardialinjury in myocarditis. J Am Coll Cardiol Img2009;2:131-138.47 Friedrich MG, Sechtem U, Schulz-Menger J,Holmvang G, Alakija P, Cooper LT, White JA,Abdel-Aty H, Gutberlet M, Prasad S, Aletras A,Laissy JP, Paterson I, Filipchuk NG, Kumar A,Pauschinger M, Liu P. Cardiovascular magneticresonance in myocarditis: A JACC White Paper.Journal of the American College of Cardiology2009;53:1475-1487.48 Wassmuth R, Gobel U, Natusch A, Schneider W,Kettritz R, Dietz R, Luft FC, Schulz-Menger J. Cardiovascularmagnetic resonance imaging detectscardiac involvement in Churg-Strauss syndrome.J Card Fail 2008;14:856-860.49 Abdel-Aty H, Siegle N, Natusch A, Gromnica-IhleE, Wassmuth R, Dietz R, Schulz-Menger J.Myocardial tissue characterization in systemiclupus erythematosus: value of a comprehensivecardiovascular magnetic resonance approach.Lupus 2008;17:561-567.50 Taylor AJ, Vaddadi G, Pfluger H, Butler M, BerginP, Leet A, Richardson M, Cherayath J, Iles L, KayeDM. Diagnostic performance of multisequentialcardiac magnetic resonance imaging in acutecardiac allograft rejection. Eur J Heart Fail 2010;12:45-51.51 Baccouche H, Mahrholdt H, Meinhardt G,Merher R, Voehringer M, Hill S, Klingel K,Kandolf R, Sechtem U, Yilmaz A. Diagnosticsynergy of non-invasive cardiovascular magneticresonance and invasive endomyocardial biopsyin troponin-positive patients without coronaryartery disease. European heart journal2009;30:2869-2879.52 Masci PG, Marinelli M, Piacenti M, Lorenzoni V,Positano V, Lombardi M, L‘Abbate A, Neglia D.Myocardial structural, perfusion, and metaboliccorrelates of left bundle branch block mechanicalderangement in patients with dilated cardiomyopathy:a tagged cardiac magnetic resonanceand positron emission tomography study.Circ Cardiovasc Imaging 2010;3:482-490.53 Hombach V, Merkle N, Torzewski J, Kraus JM,Kunze M, Zimmermann O, Kestler HA, Wohrle J.Electrocardiographic and cardiac magneticresonance imaging parameters as predictors ofa worse outcome in patients with idiopathicdilated cardiomyopathy. European heart journal2009;30:2011-2018.54 Marcus FI, McKenna WJ, Sherrill D, Basso C,Bauce B, Bluemke DA, Calkins H, Corrado D, CoxMG, Daubert JP, Fontaine G, Gear K, Hauer R,Nava A, Picard MH, Protonotarios N, Saffitz JE,Sanborn DM, Steinberg JS, Tandri H, Thiene G,Towbin JA, Tsatsopoulou A, Wichter T, Zareba W.Diagnosis of arrhythmogenic right ventricularcardiomyopathy/dysplasia: proposed modificationof the task force criteria. Circulation2010;121:1533-1541.55 Wijnmaalen AP, Schalij MJ, Bootsma M, Kies P,A DER, Putter H, Bax JJ, Zeppenfeld K. Patientswith scar-related right ventricular tachycardia:determinants of long-term outcome. J CardiovascElectrophysiol 2009;20:1119-1127.56 Kellman P, Hernando D, Arai AE. Myocardial FatImaging. Curr Cardiovasc Imaging Rep2010;3:83-91.57 Dalal D, Tandri H, Judge DP, Amat N, Macedo R,Jain R, Tichnell C, Daly A, James C, Russell SD,Abraham T, Bluemke DA, Calkins H. Morphologicvariants of familial arrhythmogenic right ventriculardysplasia/cardiomyopathy a geneticsmagneticresonance imaging correlation study.Journal of the American College of Cardiology2009;53:1289-1299.58 Rudolph A, Abdel-Aty H, Bohl S, Boye P, ZagrosekA, Dietz R, Schulz-Menger J. <strong>No</strong>ninvasive detectionof fibrosis applying contrast-enhanced cardiacmagnetic resonance in different forms of leftventricular hypertrophy relation to remodeling.Journal of the American College of Cardiology2009;53:284-291.59 Maceira AM, Prasad SK, Hawkins PN, RoughtonM, Pennell DJ. Cardiovascular magnetic resonanceand prognosis in cardiac amyloidosis. JCardiovasc Magn Reson 2008;10:54.60 Rubinshtein R, Glockner JF, Ommen SR, AraozPA, Ackerman MJ, Sorajja P, Bos JM, Tajik AJ,Valeti US, Nishimura RA, Gersh BJ. Characteristicsand clinical significance of late gadoliniumenhancement by contrast-enhanced magneticresonance imaging in patients with hypertrophiccardiomyopathy. Circ Heart Fail 2010;3:51-58.61 Bruder O, Wagner A, Jensen CJ, Schneider S,Ong P, Kispert EM, Nassenstein K, Schlosser T,Sabin GV, Sechtem U, Mahrholdt H. Myocardialscar visualized by cardiovascular magnetic resonanceimaging predicts major adverse events inpatients with hypertrophic cardiomyopathy.Journal of the American College of Cardiology2010;56:875-887.62 O‘Hanlon R, Grasso A, Roughton M, Moon JC,Clark S, Wage R, Webb J, Kulkarni M, Dawson D,Sulaibeekh L, Chandrasekaran B, Bucciarelli-Ducci C, Pasquale F, Cowie MR, McKenna WJ,Sheppard MN, Elliott PM, Pennell DJ, Prasad SK.Prognostic significance of myocardial fibrosis inhypertrophic cardiomyopathy. Journal of theAmerican College of Cardiology 2010;56:867-874.63 Wagner A, Bruder O, Schneider S, <strong>No</strong>thnagel D,Buser P, Pons-Lado G, Dill T, Hombach V,Lombardi M, van Rossum AC, Schwitter J,Senges J, Sabin GV, Sechtem U, Mahrholdt H,Nagel E. Current variables, definitions andendpoints of the European cardiovascularmagnetic resonance registry. J Cardiovasc MagnReson 2009; 11:43.64 Maron BJ. Contemporary insights and strategiesfor risk stratification and prevention of suddendeath in hypertrophic cardiomyopathy. Circulation2010;121:<strong>44</strong>5-456.65 Maron MS, Lesser JR, Maron BJ. Managementimplications of massive left ventricular hypertrophyin hypertrophic cardiomyopathy significantlyunderestimated by echocardiography but identifiedby cardiovascular magnetic resonance. TheAmerican journal of cardiology 2010;105:1842-1843.66 Cawley PJ, Maki JH, Otto CM. Cardiovascularmagnetic resonance imaging for valvular heartdisease: technique and validation. Circulation2009;119:468-478.67 Weidemann F, Herrmann S, Stork S, Niemann M,Frantz S, Lange V, Beer M, Gattenlohner S, VoelkerW, Ertl G, Strotmann JM. Impact of myocardialfibrosis in patients with symptomatic severe aorticstenosis. Circulation 2009;120:577-584.68 Azevedo CF, Nigri M, Higuchi ML, PomerantzeffPM, Spina GS, Sampaio RO, Tarasoutchi F,Grinberg M, Rochitte CE. Prognostic significanceof myocardial fibrosis quantification by histopathologyand magnetic resonance imaging inpatients with severe aortic valve disease. Journalof the American College of Cardiology2010;56:278-287.69 Chan KM, Wage R, Symmonds K, Rahman-HaleyS, Mohiaddin RH, Firmin DN, Pepper JR, PennellDJ, Kilner PJ. Towards comprehensive assessmentof mitral regurgitation using cardiovascularmagnetic resonance. J Cardiovasc MagnReson 2008;10:61.70 Han Y, Peters DC, Salton CJ, Bzymek D, NezafatR, Goddu B, Kissinger KV, Zimetbaum PJ, ManningWJ, Yeon SB. Cardiovascular magnetic resonancecharacterization of mitral valve prolapse. Jacc2008;1:294-303.71 Flynn M, Curtin R, <strong>No</strong>wicki ER, Rajeswaran J,Flamm SD, Blackstone EH, Mihaljevic T. Regionalwall motion abnormalities and scarring in severefunctional ischemic mitral regurgitation: A pilotcardiovascular magnetic resonance imagingstudy. The Journal of thoracic and cardiovascularsurgery 2009;137:1063-1070 e1062.72 Van Mieghem NM, Piazza N, Anderson RH, TzikasA, Nieman K, De Laat LE, McGhie JS, GeleijnseML, Feldman T, Serruys PW, de Jaegere PP.Anatomy of the Mitral Valvular Complex and ItsImplications for Transcatheter Interventions forMitral Regurgitation. Journal of the AmericanCollege of Cardiology 2010;56:617-626.73 von Knobelsdorff-Brenkenhoff F, Rudolph A,Wassmuth R, Bohl S, Buschmann EE, Abdel-Aty H,Dietz R, Schulz-Menger J. Feasibility of cardiovascularmagnetic resonance to assess the orificearea of aortic bioprostheses. Circ CardiovascImaging 2009;2:397-404, 392 p following 404.74 von Knobelsdorff-Brenkenhoff F, Rudolph A,Wassmuth R, Schulz-Menger J. Assessmentof mitral bioprostheses using cardiovascularmagnetic resonance. J Cardiovasc Magn Reson2010;12:36.75 Gatehouse PD, Rolf MP, Graves MJ, Hofman MB,Totman J, Werner B, Quest RA, Liu Y, von SpiczakJ, Dieringer M, Firmin DN, van Rossum A, LombardiM, Schwitter J, Schulz-Menger J, Kilner PJ.Flow measurement by cardiovascular magneticresonance: a multi-centre multi-vendor study ofbackground phase offset errors that can compromisethe accuracy of derived regurgitant orshunt flow measurements. J Cardiovasc MagnReson 2010;12:5.76 Niendorf T, Sodickson DK, Krombach GA, Schulz-Menger J. Toward cardiovascular MRI at 7 T:clinical needs, technical solutions and researchpromises. European radiology 2010.77 Snyder CJ, DelaBarre L, Metzger GJ, van deMoortele PF, Akgun C, Ugurbil K, Vaughan JT.Initial results of cardiac imaging at 7 Tesla.Magn Reson Med 2009;61:517-524.78 von Knobelsdorff-Brenkenhoff F, Frauenrath T,Prothmann M, Dieringer MA, Hezel F, Renz W,Kretschel K, Niendorf T, Schulz-Menger J. Cardiacchamber quantification using magnetic resonanceimaging at 7 Tesla-a pilot study. Europeanradiology 2010.79 Jahnke C, Gebker R, Manka R, Schnackenburg B,Fleck E, Paetsch I. Navigator-gated 3D blood oxygenlevel-dependent <strong>CMR</strong> at 3.0-T for detectionof stress-induced myocardial ischemic reactions.Jacc 2010;3:375-384.80 Karamitsos TD, Leccisotti L, Arnold JR, Recio-Mayoral A, Bhamra-Ariza P, Howells RK, Searle N,Robson MD, Rimoldi OE, Camici PG, Neubauer S,Selvanayagam JB. Relationship between regionalmyocardial oxygenation and perfusion inpatients with coronary artery disease: insightsfrom cardiovascular magnetic resonance andpositron emission tomography. Circ CardiovascImaging 2010;3:32-40.81 Vohringer M, Flewitt JA, Green JD, DharmakumarR, Wang J, Jr., Tyberg JV, Friedrich MG. Oxygenation-sensitive<strong>CMR</strong> for assessing vasodilatorinducedchanges of myocardial oxygenation.J Cardiovasc Magn Reson 2010;12:20.82 Krishnam MS, Tomasian A, Malik S, DesphandeV, Laub G, Ruehm SG. Image quality and diagnosticaccuracy of unenhanced SSFP MR angiographycompared with conventional contrastenhancedMR angiography for the assessmentof thoracic aortic diseases. European radiology2010;20:1311-1320.83 Frydrychowicz A, Berger A, Russe MF, Stalder AF,Harloff A, Dittrich S, Hennig J, Langer M, MarklM. Time-resolved magnetic resonance angiographyand flow-sensitive 4-dimensional magneticresonance imaging at 3 Tesla for blood flow andwall shear stress analysis. The Journal of thoracicand cardiovascular surgery 2008;136:400-407.84 Markl M, Geiger J, Kilner PJ, Foll D, Stiller B,Beyersdorf F, Arnold R, Frydrychowicz A. Timeresolvedthree-dimensional magnetic resonancevelocity mapping of cardiovascular flow paths involunteers and patients with Fontan circulation.Eur J Cardiothorac Surg 2010.85 Elgeti T, Laule M, Kaufels N, Schnorr J, Hamm B,Samani A, Braun J, Sack I. Cardiac MR elastography:comparison with left ventricular pressuremeasurement. J Cardiovasc Magn Reson 2009;11:<strong>44</strong>.ContactJeanette Schulz-Menger, M.D.Experimental and Clinical Research CenterMedical University BerlinCharité Campus BuchandHELIOS Krankenhaus Berlin-BuchDept. of Cardiology and NephrologySchwanebecker Chaussee. 50D-13125 BerlinGermanyjeanette.schulz-menger@charite.de18 <strong>MAGNETOM</strong> <strong>Flash</strong> · 2/2010 · www.siemens.com/magnetom-world<strong>MAGNETOM</strong> <strong>Flash</strong> · 2/2010 · www.siemens.com/magnetom-world 19
How-I-do-itClinical CardiovascularCardiovascular How-I-do-it ClinicalS<strong>CMR</strong> recommended <strong>CMR</strong> protocolsand <strong>CMR</strong> Users Guide – on CD!To aid standardization of <strong>CMR</strong>, the Society for Cardiovascular MagneticResonance (S<strong>CMR</strong>) released <strong>CMR</strong> exam protocol recommendations for themost frequent <strong>CMR</strong> procedures, from MR imaging of myocardial infarct andcardiomyopathies, stress MRI, coronary MRA to valvular disease, congenitalheart disease and more. In a collaborational effort of <strong>Siemens</strong> <strong>Healthcare</strong>and the S<strong>CMR</strong> we were able to prepare clinically optimized exam protocolsfor 1.5T and 3T <strong>MAGNETOM</strong> systems with Tim in accordance to the S<strong>CMR</strong>recommendations.© <strong>Siemens</strong> AG 2010, Order <strong>No</strong>. A91MR-1000-4E-7600S<strong>CMR</strong> RecommendedCardiac MRI Protocols1.5T and 3T <strong>MAGNETOM</strong> Systems with Timfor software version syngo MR B17In collaboration withS<strong>CMR</strong>Society for CardiovascularMagnetic ResonanceAcknowledgement: We would like to thank Prof. Stefan Neubauer (University of Oxford, UK;President of S<strong>CMR</strong>), Prof. Christopher Kramer (University of Virginia, USA; Chair of the<strong>CMR</strong> Acquisition Protocol Committee at S<strong>CMR</strong>) and Gary McNeal (Advanced <strong>CMR</strong> ApplicationSpecialist; <strong>Siemens</strong> Medical Solutions USA) for their tremendous efforts and support.The protocols for software versionsyngo MR B17 are available as downloadableEDX files on the attached CD.The protocols for software versionssyngo MR B15 and syngo MR B13 areavailable for download atwww.siemens.com/scrm-recommended-protocolsPlease use the appropriate protocolsoptimized for your particular scannertype, number of receiver channels andgradient performance. For ease of use,the protocols are organized by exammodules or common cardiac diseasesand sub-organized by the patient’scooperative abilities.For example:Acute Myocardial Infarct■ Recommended – Breathhold& Triggered Protocol■ Free Breathing & Triggered Protocol■ Extreme Arrhythmia – Free Breathing& <strong>No</strong>n-Triggered ProtocolThe CD also contains a comprehensive<strong>CMR</strong> Users Guide (90+ pages) for themost frequent <strong>CMR</strong> indications includingillustrations on how to plan the correctorientations. To enable the use in everydayroutine, the chapters are closelylinked to the EDX protocols provided onthe CD.This is an example of the comprehensive <strong>CMR</strong> Users Guide for the most frequent <strong>CMR</strong> indications that you willfind on the CD or at www.siemens.com/scmr-recommended-protocolsArrhythmogenic RightVentricular Cardiomyopathy1 Localizer Module for localization.2 LV Function Module to assess ventricular function.3A 3B 3C4A 4B 4C5A 5B 5C3 Right VentricularVertical Long AxisCine: prescribe 1 rightventricular long axisslice from four chamberand basal short axisviews, parallel to ventricularseptum bisectingtricuspid valve, rightatrium, and right ventricle,single breathhold,retrospective gating.4 Right VentricularOutflow Tract Cine:prescribe 1 slice fromright ventricularvertical long axis andaxial views, bisectpulmonary outflowtract, pulmonic valve,and main pulmonaryartery, single breathhold,retrospectivegating.5 Axial Cine:prescribe 12 slices,adjust gap to coverentire right ventriclefrom base to apex,multiple breathholds,retrospective gating.20 <strong>MAGNETOM</strong> <strong>Flash</strong> · 2/2010 · · www.siemens.com/magnetom-world<strong>MAGNETOM</strong> <strong>Flash</strong> · 2/2010 · www.siemens.com/magnetom-world 21
How-I-do-itClinical CardiovascularCardiovascular How-I-do-it Clinical6A6B6C9A 9B 9C6 Optional Axial TSE Dark Blood T1: for selected slice levels of right ventricle, segmented dark blood tse, single breathhold, trigger on everyheartbeat, capture cycle for diastolic gating.9 Optional Right Ventricular Vertical Long Axis Delayed: 1 slice in 1 breathhold, phase sensitive inversion recovery turboflash technique, providesboth magnitude and real images, adjust TI for nulling of normal RV myocardium, trigger on every second heartbeat, capture cycle for diastolic gating.7A 7B 7C10A 10B 10C7 Optional Axial TSE Dark Blood T1 Fatsat: for selected slice levels of right ventricle, segmented dark blood tse with fatsat, single breathhold,trigger on every heartbeat, capture cycle for diastolic gating.10 Optional Right Ventricular Outflow Tract Delayed: 1 slice in 1 breathhold, phase sensitive inversion recovery turboflash technique, providesboth magnitude and real images, adjust TI for nulling of normal RV myocardium, trigger on every second heartbeat, capture cycle for diastolic gating.8A 8B 8C 8D11A 11B 11C 11D8 Optional TI Scout: determine optimal TI for nulling of normal RV myocardium, prescribe as a mid ventricular short axis slice, rotate FoVto avoid wrap, single breathhold, trigger on every second heartbeat, capture cycle for optimal acquisition window.11 Optional Axial Delayed: 12 slices in 12 breathholds, phase sensitive inversion recovery turboflash technique, provides both magnitudeand real images, adjust TI for nulling of normal RV myocardium, trigger on every second heartbeat, capture cycle for diastolic gating.22 <strong>MAGNETOM</strong> <strong>Flash</strong> · 2/2010 · · www.siemens.com/magnetom-world <strong>MAGNETOM</strong> <strong>Flash</strong> · 2/2010 · www.siemens.com/magnetom-world 23
How-I-do-itClinical CardiovascularCardiovascular How-I-do-it ClinicalLow-Dose Contrast-Enhanced MR AngiographyRoya Saleh, M.D. 1 ; Paul Finn, M.D. 1 ; Yutaka Natsuaki, Ph.D. 2 ; Gerhard Laub, Ph.D. 21Department of Radiology, University of California at Los Angeles, CA, USA2<strong>Siemens</strong> <strong>Healthcare</strong>, West Coast Team, MR R&D, Los Angeles, CA, USAIntroductionContrast-enhanced MR angiography(ceMRA) has been firmly established asa very powerful diagnostic tool and isemployed worldwide both for routineclinical work and for specialized applications.Gadolinium-DTPA is frequentlyused in ceMRA for imaging the carotid,thoracic, abdominal, and peripheralcirculations. With proper timing andtechnique, high quality MRA can beperformed with sub-millimeter spatialresolution in as little as a breathholdperiod.In recent years, the recognition ofnephrogenic systemic fibrosis (NSF) hassparked widespread concern withinthe clinical community and has focusedattention on the safe utilization anddosage of contrast agents. Symptomsof NSF first appeared in 1997 [1], butit was not until 2006 that an associationwith gadolinium (Gd)-based contrastagents was made [2]. While it is stillspeculative how Gd-based agents cantrigger NSF, impairment of renal functionis known to be a universal preconditionand most cases have been associatedwith end stage renal failure. With normalkidney function, 90% of the injecteddose of extracellular contrast agentis removed via the kidneys within thefirst 24 hours and in patients withsevere renal impairment (not on dialysis)this time can be prolonged up to 7 daysto clear 80% of contrast media, dependingon the degree of renal function [3].The process of renal clearance is exponential,such that the higher the injecteddose, the faster the rate of renal excretion,but the longer it takes for the bloodconcentration to fall below a giventhreshold. In renal impairment, the eliminationrate constant for extracellularcontrast agents falls proportionatelyto the degree of renal impairment. So,patients with kidney impairment willhave more difficulty clearing the Gd thanpatients with normal kidneys. It is reasonableto suggest that decreasing thedose of Gd will decrease risk exposurein susceptible patients, and the majorityof proven cases of NSF have been associatedwith high dose Gd administration(often repeated) [4-6]. Abujudeh et al.,in a recent study of 36 patients withNSF has shown and concluded that NSFdevelops in patients with renal impairmentafter exposure to Gd in a dose-Table 1: Dilution of native Gd contrast solution for MR angiographyand time-dependent manner [7]. Useof the minimum effective dose ofGd in renal impairment has been recommendedby scientific societies andgovernmental agencies both in the U.S.and in Europe.At one extreme, MRA can be acquiredwithout any contrast injection (i.e. noncontrastMRA), and numerous successfulnon-contrast MRA techniques have beenreported (e.g. syngo NATIVE TrueFISP[8, 9], syngo NATIVE SPACE, Time-Of-Flight [10] and 3D SSFP [11-13]). However,all of the non-contrast techniquesare to some extent flow-sensitive, andthis limitation makes them less robustand often less practical when comparedto ceMRA. Also, the majority of noncontrastMRA techniques require longerscan times since multiple arterial andvenous phases are necessary to completethe data acquisition.An alternative approach to non-contrastMRA is to use low Gd doses. By optimizingthe ceMRA sequences to match thecontrast timing and k-space acquisition,significant reduction in the contrastdose is possible. Moreover, at 3T, dramaticdose reduction can be realized1.5 Tesla 3 TeslaUndiluted Added Final Undiluted Added Finalcontrast Saline solution contrast Saline solutionvolume conc. volume conc.Single station MRA 20 cc 20 cc 50% 10 cc 30 cc 25%(Head & Neck, Chest and Renals)Multi station (Lower Extremity MRA) 30 cc 30 cc 50% 20 cc 40 cc 33%Table 2: Contrast injection scheme for MR angiography at 1.5 Tesla and 3.0 Teslarelative to conventional doses at 1.5T.Time resolved 3D MRA with syngo TWISTcan be performed with less than 2 mlof Gd contrast and high spatial resolution3D Carotid imaging can be performedreliably with 8 ml or less. In ourpractice, when we reduce the dose forceMRA, we do so by dilution of the nativegadolinium formulation at the time ofadministration – sometimes by a factorof four (Table 1, 2). The reason for thisis so that the timing and infusion durationof the (diluted) contrast solutionis identical to what it would be for anequal volume of the native (undiluted)gadolinium formulation. The result isthat the peak intravascular concentrationof Gd is lower with the diluted solution,but occurs at the same time as with theoriginal protocol. Therefore, the shapeand duration of the curves are identical.Background and techniqueImage quality and vessel contrast areaffected by the contrast dose as well asthe timing of the agent passing throughthe region of interest. A higher doseof contrast agent causes more shorteningof the blood T1 and may producestronger vessel delineation (althoughthe effect is not linear over all doseranges). A high dose (double or tripledose) of contrast has been used frequentlyin the past, assuming that MRMethods of MRA Injection # Solution vol. Saline Injection(diluted Gd) flush rateHead and Neck MRA Isotropic Dynamic MRA (Sag & Cor) 1 6 cc 20 cc 3 cc/sStatic MRA 2 34 cc 20 cc 2 cc/sChest MRA 3D Timing bolus 1 2 cc 20 cc 2 cc/sDynamic MRA 2 6 cc 20 cc 3 cc/sStatic MRA 3 32 cc 20 cc 2 cc/sRenal MRA* 3D Timing bolus 1 2 cc 20 cc 2 cc/sDynamic MRA 2 6 cc 20 cc 3 cc/sStatic MRA 3 32 cc 20 cc 2 cc/sMulti Station 3D Timing bolus MRA (Calves) 1 3 cc 20 cc 1.2 cc/s(Lower Extremity 3D Timing bolus MRA (Abdomen) 2 3 cc 20 cc 1.2 cc/sMRA) Static MRA (Calves) 3 24 cc 20 cc 1.2 cc/sStatic MRA (Abdomen and thighs) 4 30 cc 20 cc 1.2 cc/s*For renal MRA at 3.0 T, solution is made of 15 cc contrast and 25 cc saline (37.5% relative Gd conc.) with iPAT x 4.contrast agents are safe under all conditions.For a 70 kg patient, a double doseof 0.2 mmol/kg of Gd-DTPA correspondsto 30 ml of the contrast formulationwhile a triple dose of 0.3 mmol/kg correspondsto approximately 45 ml.However, it is possible to produce highquality MR angiograms with a fractionof commonly employed doses [14-16].Several imaging strategies can be implementedto perform low-dose contrastenhancedMRA. The common goal ofthese strategies is to optimally matchinjection and k space coverage to achievethe best image quality at a reduceddose. Low dose contrast-enhanced MRAcan be performed at both 1.5T and 3T.The tradeoff in vascular signal whenreducing the contrast dose is less noticeableat 3T. Due to the higher intrinsicblood-to-tissue signal available at 3Tcompared to at 1.5T, low dose ceMRAis particularly successful at 3T.The peak concentration of Gd in theblood following intravenous injection isdetermined by the rate of injection. Theduration over which the peak persists(the ‘plateau’) is determined by theduration of the injection. A high, sustainedpeak blood concentration impliesthat the injection rate is fast and thatthe injection duration is prolonged;both conditions can be met only if theinjected dose is high (the product ofinjection rate and duration). To a firstapproximation, it is desirable to havethe blood concentration constant overthe duration of a 3D acquisition. It isconventional wisdom that the mostimportant part of the 3D acquisition iswhen the center of k-space is acquiredand that the peak Gd concentrationshould coincide with that. This is true,but the rest of k-space is not irrelevantand if the Gd concentration changesdramatically during the data acquisition,a type of image blurring or ‘k-space’ filteringoccurs. If one injects a reducedamount of contrast at the same rate,one can decrease the acquisition timeto match the shortened duration of thebolus passage. Using a short TR and ashort TE, time-resolved imaging canacquire data dynamically as the contrastpasses through the vasculature of interest.In practice, time-resolved acquisitionssuch as syngo TWIST shorten theacquisition time and are well suited forlow dose ceMRA. This does require gradientperformance and a very shortTR. Alternatively, if the acquisition timecannot be shortened, a reduced amountof contrast agent can be diluted to agreater volume to extend the durationof the bolus. There will be less bloodT1-shortening related to the lower contrastconcentration resulting in a reductionof signal intensities as shown in24 <strong>MAGNETOM</strong> <strong>Flash</strong> · 2/2010 · · www.siemens.com/magnetom-world<strong>MAGNETOM</strong> <strong>Flash</strong> · 2/2010 · www.siemens.com/magnetom-world 25
How-I-do-itClinical CardiovascularCardiovascular How-I-do-it Clinical1 30.20TR = 3 msPreptime0.9Centersegmentk y -t plotKr-t plotk y -k z plotrel. signal intensity0.150.100.050.00∆S ernst(T1 low ) ernst(T1 std )0 10 20 30 40T1 std = 50 msT1 low = 80 msflip angle1 A standard dose can shorten the T1 of blood to about 50 ms. For a gradient echo sequence with a TR of 3 ms the optimal flip angle is around20° (Ernst angle). Due to SAR limitations, particularly at 3T, the flip angle needs to be reduced in practical situations. Alternatively, a lowerconcentration can be used resulting in longer T1 times (80 ms). The Ernst angle is lower, and will not increase the SAR limits. Effectively, thereis only a small loss in signal intensity well tolerable in light of the reduction of overall contrast dose.60 %PhaseFOVKr (mm – 1)0.80.70.60.50.40.30.20.100 5 10 15 20 25t (sec)0.90.80.7Kr-t plotkkk zzk ryk y2A 2B 2Crel. signal enhancementtimearterialwindowarterial phasemeasurementvenous phasetimek yk yk yk y100%PhaseFOVKr (mm – 1)0.60.50.40.30.20.100 5 10 15 20 25t (sec)TT2 A typical enhancement time dynamics for arteries and veins following injection of bolus dose. The time between the arterial and venousenhancement, referred to as arterial window, is usually a fraction of the acquisition window for the MR angiogram (shown in the diagram).Different k-space acquisition order can be used, such as 1) linear or 2) flexible centric. Depending on the phase encode order, the arterial windowmay cover a different region in k-space, as shown in B for linear and C for flexible centric respectively. The flexible central phase encode ordergenerates an isotropic coverage of k-space and is well suited for low dose contrast-enhanced MRA.3 A schematic diagram showing delayed centric phase encoding during contrast enhancement. k r -t plot and correspoding k y -k z plot of thespiral centric reordering. Shown here are two examples with 60% phase FOV (top row) and 100% phase FOV (bottom row). The time-to-center(TTC) of 3 seconds stays the same independent of the phase FOV. The sequence (product and WIP) incorporates a 1-second prep time to makesure that the magnetization is in steady state. The duration of the center segment corresponds to (TTC – prep time) x 2, i.e. 4 seconds in thecase shown here.Fig. 1. However, most protocols at 3Tare SAR-limited anyway, and flip anglesare usually below the Ernst angle forwhich maximal signal is expected. Inthis situation, a lower concentration withslightly longer T1 times can be used,and the signal loss compared to thehigher concentration case is minimalbecause the Ernst angle is getting smallerfor longer T1 times. Particularly at 3T,low-dose ceMRA with diluted contrastis quite effective. At 1.5T, the RF poweris considerably lower, and larger flipangles in combination with higher contrastconcentration than at 3T are used.In either case, one needs to take intoconsideration the matching of the dataacquisition to the contrast passage.Careful timing between bolus arrivaland k-space coverage is particularlyimportant when performing low doseceMRA (Fig. 2A). Fig. 1B shows the conventionallinear approach in coveringk-space whereas Fig. 1C shows the centricapproach. Better results are obtainedusing the centric approach that generatesisotropic coverage of the k y -k z spaceduring the targeted contrast phase (e.g.the arterial window as shown in Fig. 2A,and the corresponding k y -k z space coverageas shown in 2C).For ceMRA using a test bolus, a delayedmeasurement of the center of k-spaceis preferable. The order of k-spacepoints in the centric reordering ischanged such that the k-space pointat k r = 0 is scanned after a user-definedtime called time-to-center (TTC). Thedelayed centric reordering starts thek-space trajectory at the edge of thecenter segment moving towards k r = 0,then moves outwards again to acquirethe complete center segment in 2 equallength paths. The trajectory thenacquires the region outside of the centersegment to complete the k-spacedataset. The details of the delayed centricreordering are outlined in Fig. 3.It is important to note that the TTC isindependent of other geometric parametersused in the imaging protocol.For example, if the phase field-of-view(FOV) is increased from 60% to 100% asshown in Fig. 3, the TTC will not bechanged. What happens instead is a correspondingsize (area) reduction of thecenter segment in k-space, while thenumber of k-space points in the centersegment stays the same, independentof the actual value for the phase FOV.Similarly, changing other parameters(e.g., phase and slice resolution, or thenumber of slices) will not change theselected value for TTC. This has importantpractical implications; the centersegment can be adjusted to the arterialwindow as demonstrated in Fig. 2 independentof the geometric parameters inthe protocol.26 <strong>MAGNETOM</strong> <strong>Flash</strong> · 2/2010 · · www.siemens.com/magnetom-world <strong>MAGNETOM</strong> <strong>Flash</strong> · 2/2010 · www.siemens.com/magnetom-world 27
How-I-do-itClinical CardiovascularCardiovascular How-I-do-it Clinical4A4C4B4 Dynamic and static MRA of an 81-year-old woman with unruptured left anterior choroidal artery aneurysm. A and B are coronal and sagittalmaximum intensity projections reconstructed online from the dynamic 3D isotropic dataset acquired every 1.6 seconds with an injection of 1.5 cccontrast (diluted to 6 cc). (TR/TE: 2.03/0.83, FA 13°, GRAPPA × 6).4C Volume rendered reconstructed image from high spatial resolution static MRA. First pass MRA was acquired with infusion of 8.5 cccontrast agent (diluted to 34 cc). (TR/TE: 2.61/1.16, FA 15°).Table 3: Sample clinical applications of ceMRAHead and Neck■ Atherosclerosis■ Aneurysm■ AV Fistula■ AVM■ Vasculitis■ Pre- and Post-Surgicalassessment of tumorChest■ Assessment of thoracic aortafor atherosclerosis, coarctation,aneurysm, dissection andextravasation■ Pulmonary HTN■ Pulmonary AVM■ Congenital heart diseases■ Pulmonary perfusion■ Lung tumors■ Pulmonary venous mapping■ Pulmonary embolismAbdominal■ Assessment of abdominal aorta andall its branches, coarctation, aneurysm,dissection and extravasation■ Aneurysm■ AV Fistula■ AVM■ FMD■ Pre- and Post-Surgicalassessment of tumor■ Vasculitis■ Vascular graftProtocolsCurrently, various institutions performceMR angiography differently: usingdifferent sequences and parameters,different amounts and concentrationsof contrast agent, and different injectionand acquisition timing. The key tosuccess is optimal coverage of the centralk-space data during maximal contrastenhancement. We have experimentedwith different approaches and the followinghave worked well for all clinicalapplication of ceMRA in different vascularterritories (Table 3) using low doseceMRA.Head and neck low dose ceMRAWe always perform a bolus timing studywith syngo TWIST and about one mlof Gd as described in detail previously.Fig. 4 shows a head and neck ceMRAin a patient with a body weight of 65 kg.For high spatial resolution ceMRA,a dose of 8.5 ml native Gd solution(Magnevist) was diluted with 25.5 ml ofnormal saline to a 34 ml bolus solutionand injected at 2 ml/s. The infusionduration is therefore, 15 seconds.Typically, we acquire 128 slices withnear isotropic resolution (voxel size =0.8 mm x 0.7 mm x 0.8 mm) in a scantime of 23 seconds. Using the head andneck neurovascular coil, we normallyuse a FOV of 450 mm x 270 mm. Thisextended FOV covers the aortic arch,the origins of the great vessels, thecarotid arteries, and the intracranial vasculaturecompletely in one single injection.Parallel imaging (iPAT GRAPPA = 4)is used. The best results are obtainedwith breath-holding, which minimizesrespiratory motion in the upper thoraxand aortic arch.28 <strong>MAGNETOM</strong> <strong>Flash</strong> · 2/2010 · · www.siemens.com/magnetom-world<strong>MAGNETOM</strong> <strong>Flash</strong> · 2/2010 · www.siemens.com/magnetom-world 29
Clinical How-I-do-it CardiovascularCardiovascular How-I-do-it ClinicalChest low dose MRAPediatric body ceMRAMost of our chest MRA studies are performedat 1.5T as they are generallycombined with cardiac functional assessment,often in patients with adult congenitalheart disease. Figs. 8A–D showa chest ceMRA in a patient with pulmonaryatresia and hypoplastic right lung.Generally we perform a sagittal bolustiming study with syngo TWIST usingone ml of Gd. Next we perform acoronal time resolved study using theTWIST sequence with an injection of3 ml contrast at a rate of 3 ml/sec. Forhigh spatial resolution ceMRA, a doseof 16 ml Gd (Magnevist) is diluted withequal amount of normal saline to createa 50% solution and injected at 2 ml/s.Images are acquired during approximately20 seconds of breath-holding.We perform pediatric ceMRA at bothsystems (1.5 and 3T) under generalanesthesia. Fig. 9 is a one-day-old babywith patent ductus arteriosus scannedat 1.5 Tesla with 1.25 ml of contrastdiluted with 4.75 ml saline. Fig. 10 isan image of a two-day-old infant withinfantile type coarctation, acquired at3.0 Tesla using 1.25 cc of contrastdiluted with 4.75 ml of saline. Althougha very small volume of contrast wasused, this is still not ‘low dose’ by adultstandards. In these specific cases, thepractical challenges of delivering verysmall volumes through an adult deliverydevice made it difficult to optimize theinjected dose, even when diluted. Thisshortcoming can be addressed withdedicated, low volume pediatric deliverytubing and devices.8A9A9B9C8A Dynamic MRA on the 1.5T <strong>MAGNETOM</strong> Avanto of an 18-year-old female with hypoplastic right lung and atresia of the right pulmonaryartery (arrow points to the single left pulmonary artery). Right pulmonary parenchyma is perfused from an inferior phrenic artery and bronchialarteries. Images were acquired with 6.0 ml of contrast agent (diluted to 12 ml). TR/TE: 2.45/0.92, FA 25°.9 Full thickness MIP (A), partial MIP (B) and volume rendered (C) images were reconstructed from high spatial resolution MRA of a one-day-oldinfant girl. Images were acquired at 1.5 Tesla system with infusion of 1.25 ml of gadolinium diluted with 4.75 ml of saline). Ascending aorta andarch demonstrate an abnormal posterior course. <strong>No</strong>te the large patent ductus arteriosus (6.5 mm) in VR image. TR/TE 2.96/1.7 FA 30° GRAPPA × 3.8B 8C 8D10A10B8B–D Left anterior oblique (B), right anterior oblique (C) thin MIP images and volume rendered image (D) were reconstructedfrom static high spatial resolution MRA of the above patient with injection of 14 cc of contrast agent. <strong>No</strong>te complete absence ofthe right pulmonary artery. TR/TE: 2.28/0.95, FA 30°.10 Full thickness MIP (A) and volume rendered (B) images were reconstructed from high spatial resolution MRA of a two-day-old infant boy.Images were acquired at a 3T system with infusion of 1.25 ml of gadolinium diluted with 4.75 ml of saline). Aortic arch and distal ascendingaorta are diffusely hypoplastic (infantile-type coarctation). TR/TE 3.02/1.17, FA 20°, GRAPPA × 4.32 <strong>MAGNETOM</strong> <strong>Flash</strong> · 2/2010 · · www.siemens.com/magnetom-world <strong>MAGNETOM</strong> <strong>Flash</strong> · 2/2010 · www.siemens.com/magnetom-world 33
Clinical How-I-do-it CardiovascularTechnologyImage visualizationIn addition to data acquisition, imageprocessing and visualization is veryimportant. In situations where there islimited vessel contrast and signal-tonoiseratio (SNR), the thin-MIP (thinmaximum-intensity-projection) methodis advantageous as it takes MIP projectionsfrom a targeted number of thinslices to create a 10-20 mm slab. Thisminimizes background tissue signal andincreases the vessel contrast. This hasgenerated excellent results in differentvasculatures.SummaryLow dose ceMRA can be performed successfullyand routinely in clinical practice.The most dramatic dose reductionprotocols are possible at 3T, where thetrade-off in vascular signal with dosereduction is well tolerated. Low doseceMRA, using < 10 ml of contrast agent,instead of 30 ml or more, is made practicalby diluting the native contrast formulationand leaving the infusion rateunchanged.AcknowledgementThe authors would like to acknowledgeSergio Godinez, Francine Cobla andGlenn Nyborg for performing the clinicalexaminations.Listen to the talks on cardiovascularMR imaging that we have captured duringthe 7. <strong>MAGNETOM</strong> World SummitJens Vogel-ClaussenJohns Hopkins University, Baltimore, MD, USAImaging the heart – MRI compared to US and MI, andHeart perfusion – when should I stress the heart?References1 Cowper, S.E., et al., Scleromyxoedema-likecutaneous diseases in renal-dialysis patients.Lancet, 2000. 356(9234): p. 1000-1.2 Grobner, T., Gadolinium – a specific triggerfor the development of nephrogenic fibrosingdermopathy and nephrogenic systemicfibrosis? Nephrol Dial Transplant, 2006. 21(4):p. 1104-8.3 Morcos, S.K., H.S. Thomsen, and J.A. Webb,Dialysis and contrast media. Eur Radiol,2002. 12(12): p. 3026-30.4 Kribben, A., et al., Nephrogenic systemicfibrosis: pathogenesis, diagnosis, and therapy.J Am Coll Cardiol, 2009. 53(18): p. 1621-8.5 van der Molen, A.J., Nephrogenic systemicfibrosis and the role of gadolinium contrastmedia. J Med Imaging Radiat Oncol, 2008.52(4): p. 339-50.6 Othersen, J.B., et al., Nephrogenic systemicfibrosis after exposure to gadolinium inpatients with renal failure. Nephrol DialTransplant, 2007. 22(11): p. 3179-85.7 Abujudeh, H.H., et al., Nephrogenic SystemicFibrosis after Gadopentetate DimeglumineExposure: Case Series of 36 Patients. Radiology,2009.8 Liu, X., et al., Renal transplant: nonenhancedrenal MR angiography with magnetization-preparedsteady-state free precession. Radiology,2009. 251(2): p. 535-42.9 Robert R. Edelman, I.K., Renate Jerecic,Xiaming Bi (Spring 2009) <strong>No</strong>n-Contrast RenalMR Angiography, a case study. <strong>CMR</strong>S e-Vision.10 Du, Y.P., et al., Multi-echo acquisition of MRangiography and venography of the brainat 3 Tesla. J Magn Reson Imaging, 2009.30(2): p. <strong>44</strong>9-54.11 Francois, C.J., et al., Unenhanced MR angiographyof the thoracic aorta: initial clinicalevaluation. AJR Am J Roentgenol, 2008.190(4): p. 902-6.12 Francois, C.J., et al., Pulmonary vein imagingwith unenhanced three-dimensionalbalanced steady-state free precession MRangiography: initial clinical evaluation.Radiology, 2009. 250(3): p. 932-9.13 Wyttenbach, R., et al., Renal artery assessmentwith nonenhanced steady-state freeprecession versus contrast-enhanced MRangiography. Radiology, 2007. 245(1): p.186-95.14 Habibi, R., et al., High-spatial-resolutionlower extremity MR angiography at 3.0 T:contrast agent dose comparison study.Radiology, 2008. 248(2): p. 680-92.15 Lohan, D.G., et al., Ultra-low-dose, timeresolvedcontrast-enhanced magnetic resonanceangiography of the carotid arteries at3.0 tesla. Invest Radiol, 2009. <strong>44</strong>(4): p.207-17.16 Tomasian, A., et al., Supraaortic arteries:contrast material dose reduction at 3.0-Thigh-spatial-resolution MR angiographyfeasibilitystudy. Radiology, 2008. 249(3):p. 980-90.ContactProf. J. Paul Finn, M.D.The David Geffen Schoolof Medicine at UCLAChief, DiagnosticCardiovascular Imaging SectionDirector, Magnetic Resonance ResearchLos Angeles, CAUSApfinn@mednet.ucla.eduRussell BullThe Royal Bournemouth and Christchurch HospitalBournemouth, UKIncreasing productivity with the Cardiac Dot EngineJeanette Schulz-MengerCharité Berlin, Berlin, GermanyImaging of the young heart, andMRI in case of myocarditis and cardiomyopathiesLi Kun-ChengXianwu Hospital, Beijing, ChinaCoronary MRA at 3TJürgen HennigUniversity Hospital Freiburg, Freiburg, GermanyFuture trends in cardiac imagingHenrik MichaelyUniversity Medical Center Mannheim, Mannheim, GermanyLow dose and large field-of-viewMR angiographyJames C. Carr<strong>No</strong>rthwestern Memorial Hospital, Chicago, IL, USA<strong>No</strong>n-contrast enhanced MR angiography –when contrast matters34 <strong>MAGNETOM</strong> <strong>Flash</strong> · 2/2010 · · www.siemens.com/magnetom-worldVisit us at www.siemens.com/magnetom-worldGo to International Version > e-trainings & Presentations
Clinical Cardiovascular MRICardiovascular MRI ClinicalCase Report: Cardiac Imagingwith <strong>MAGNETOM</strong> ESSENZACardiac MRI of Anteroapical Infarctionin Patient with Left Ventrical Aneurysmwith Apical Thrombus / Tako-Tsubolike SyndromeG. Hadjidekov; G. TonevMC ”Pro-Vita”, Sofia, BulgariaIntroductionLeft ventricle aneurysm is an uncommonfinding on MR cardiac examinations. Wedescribe a case of aneurismal dilatationof the left ventricle with apical thrombusformation and confirmation of this thrombus,suspected on echocardiography bycardiac magnetic resonance imaging(<strong>CMR</strong>). Perfusion and late enhancementtechniques contributed to the detectionof chronic anteroapical infarction.Patient history42-year-old man with ischemic heartdisease, NYHA class II, persistent atrialfibrillation and aneurismal dilatationof the left ventricle with suspicion ofthrombus underwent <strong>CMR</strong>. The patientwas admitted to the hospital with cough,roaring and orthopnoe as well as pulmonaryedema. Echocardiography revealeda dilated left ventricle with hypokinesisof the anterior wall and the septum,severe apical hypokinesis and a reducedejection fraction (EF) of 29%, consistentwith the diagnosis of tako-tsubo cardiomyopathy(TTC) [1]. Additionally performedcoronary angiography did notshow significant coronary artery disease.The patient was than referred to <strong>CMR</strong>for further evaluation.Sequence detailsImages were acquired on our 1.5T<strong>MAGNETOM</strong> ESSENZA using the 6-element Body Matrix in combinationwith the integrated IsoCenter Matrixcoil. The following sequence parametershave been used:TrueFISP: TR 54.6 ms, TE 1.6 ms, matrix256/192, FOV 340 / 276 mm, bandwidth930 Hz/px, flip angle 80°, resolution 192/ 134.Dynamic perfusion evaluation usinggradient echo sequences: TR 167.48 ms,TE 1.21 ms, matrix 256/192, TI 100 ms,FOV 360 / 293 mm, bandwidth 651 Hz/px,flip angle 12°, resolution 160 / 120.Late enhancement using psir-singleshotsequences: TR 936 ms, TE 3.39 ms,TI 370 ms, matrix 256 / 192, FOV 340 /276 mm, bandwidth 140 Hz/px,flip angle 25°, resolution 256 / 179.Imaging findingsCardiac MRI shows a dyskinetic aneurismalanterior and apical left ventricularwall on the TrueFISP cine images in diastolicand systolic two-chamber, threechamberand four-chamber views, aswell as the left ventricle outflow tract(Figs. 1A, B, C, D). The presence of ananeurismal dilatation of the left ventricleand a small adjacent thrombus, measuring11 by 9 mm in diameter, are demonstrated.There is also a small pericardialeffusion. The same findings are clearlydemonstrated on short-axis (SA) views(Fig. 5) from base to apex. Figures 3 and4 present the dynamic sequences infour-chamber view (Fig. 3) and short axisand left ventricle long axis views (Fig. 4)with visualisation of the apical thrombusat the level of the anteroapical ventricularaneurysm. The post-contrast acquiredinversion recovery images (Fig. 2) showtransmural enhancement of the leftventricular apex and part of the anteriorwall, which is indicative of a scar. Onlate enhancement images we observehyperintense transmural involvement ofthe segments 17, 14 and partly 13. Adark low-signal-intensity mass is visibleadherent to the aneurismal enhancedand scarred myocardium. The left ventriclewas dilated and measured 92 by66 mm in end-diastole and the ejectionfraction (EF) was reduced at 32%, whichcorresponded to the values, measured inechocardiography. The septum thicknessis 18 mm.DiscussionIn the past, spoiled gradient-echo (GRE)imaging techniques with the use of flipangles less than 90° offered significantlyshorter imaging time than spin echosequences for cardiac imaging [2]. InTrueFISP sequences the higher signal-tonoiseratio (SNR) allows rapid data acquisitionswith very short TR values in therange of 3–5 ms. This sequence providesa high contrast between blood andmyocardium with excellent delineationof anatomic structures such as papillarymuscles, endocardial trabeculation andvalve leaflets, making thus suited for theevaluation of wall-motion abnormalities1A 1B 1C 1D1A–DLong axis, three-chamber, four-chamber and left ventrical outflow views of cine balanced steady-state free precession (b-SSFP) sequence.36 <strong>MAGNETOM</strong> <strong>Flash</strong> 2/2010 · www.siemens.com/magnetom-world <strong>MAGNETOM</strong> <strong>Flash</strong> · 2/2010 · www.siemens.com/magnetom-world 37
Clinical Cardiovascular MRICardiovascular MRI Clinical23A4A4B4A–D Leftventricle longaxis viewsdemonstratethe aneurysmaldilatation ofthe left ventricleand thesmall apicalthrombus (A,B). Perfusionsequence atshort axisviews (C, D).3B3C4C4D3D2 Four chamber lateenhancement images showingthe infracted areas.3A–D Four-chamber viewsof the perfusion sequenceclearly demonstrating thesmall apical thrombus atthe level of the anteroapicalventricular aneurysm.[3, 4]. Parallel imaging techniques substantiallyreduce imaging time and thereforeare often combined with sequenceswith high SNR, and the synergistic effectin terms of speed of data acquisitionreduces the overall examination time[5, 6]. Real-time cardiac imaging permitsexamination of patients with cardiacarrythmia and incapable of breath holdingwithout the need of cardiac- or respiratory-motioncompensation [7]. Recentstudies compare contrast-enhanced cine-MR sequences to pre-contrast cine-MRsequences in the assessment of left ventricularfunction providing comparablequantitative data upon regional contractilefunction [8]. The authors suggestthe use of contrasts enhanced cine True-FISP sequences between the first-passand delayed enhancement sequences toreduce the overall examination time. Interms of identification of left ventricularthrombus ceMRI has a higher sensitivityand specificity than transthoracic echocardiography(TTE) and transesophagealechocardiography (TEE) [9, 10, 11].Delayed enhancement ceMRI techniquesusing an inversion recovery pulse tosuppress signal are particularly beneficialin detecting intracavitary thrombiin addition to being an excellent techniquefor depicting adjacent myocardialinfarction and scars. This imaging techniqueallows the visualization of smallthrombi, which can often be invisibleon TEE. In our experience, the presenceof slow and turbulent flow patterns indysfunctional wall segments and a lackof contrast between a small muralthrombus and the adjacent myocardiummay obscure the visualization of smallthrombi on cine-MRI, even when usingthe newer TrueFISP techniques [9, 11].In clinical practice, a combination ofcine-MRI using the newer TrueFISP techniquesand contrast-enhanced inversionrecovery MRI with a careful analysis ofthe regions at risk – infarct area, aneurismaland dysfunctional wall segmentsof the ventricles, atrial appendages – isthe best way not to miss thrombi.38 <strong>MAGNETOM</strong> <strong>Flash</strong> 2/2010 · www.siemens.com/magnetom-world <strong>MAGNETOM</strong> <strong>Flash</strong> · 2/2010 · www.siemens.com/magnetom-world 39
5A5B5 Short-axisviews from baseto apex (cinesequences).Assessment and Classification ofPeripheral Vascular Anomalies byTime- Resolved MRA using TWISTCardiovascular MRI ClinicalUlrich Kramer 1 , Ulrike Ernemann 2 , Stephan Miller 11Diagnostic and Interventional Radiology, University Hospital Tübingen, Germany2Diagnostic and Interventional Neuroradiology, University Hospital Tübingen, Germany5C5DIntroductionVascular malformations (VM) can beclassified into high-flow arteriovenousmalformations and/or fistulas (AVM) andlow-flow venous or lymphatic malformations.In general, VMs are congenitalanomalies, usually caused by an arrestof normal vascular development andfailure of resorption of the embryologicprimitive vascular elements. VMs canpresent in any anatomic location, tissueor organ; the most common anatomiclocations being the pelvis, extremities(flexor muscles of the forearm and thequadriceps muscle) and the intracranialcirculation. Overall prevalence of VMsis estimated to be 1.5% of the generalpopulation.Multiple classifications for vascularabnormalities have been established,but the classification of Mulliken andGlowacki is the most frequently usedsystem [1, 2]. Treatment and prognosisof VMs are based on the type, subtypeand architecture of the lesions.A potential difficulty of making differentialdiagnoses for the lesions relying onlyon the above system is that diagnosesmay often be incorrect, resulting in turnin inappropriate treatment. Preciseimaging evaluation is needed for treatmentof the lesions, not only to evaluatethe extent of lesions but also to confirmthe suspected diagnoses.ConclusionAs shown in this case report, cardiacmagnetic resonance imaging can beused as a powerful tool in the diagnosisof thrombi and further evaluation ofischemic heart disease.ContactGeorgi Hadjidekov, M.D.MC “Pro-Vita”Montevideo str. N66Sofia 1632, Bulgariajordiman76@yahoo.comReferences1 G. Leurent, A. Larralde, D. Boulmier, C. Fougerou,B. Langella, R. Ollivier, M. Bedossa, H. Le Breton(2009). Cardiac MRI studies of transient left ventricularapical ballooning syndrome (takotsubocardiomyopathy): A systematic review. InternationalJournal of Cardiology, Volume 135,<strong>Issue</strong> 2, Pages 146-1492 Sprung K (2005) Basic techniques of cardiac MR.Eur Radiol 15 (suppl 2): B10-B163 Thiele H et al (2001). Functional cardiac MRimaging with steady-state free precession (SSFP)significantly improves endocardial border delienationwithout contrast agents. J magn ResonImaging 14(4):362-3674 Barkhausen J et al. (2001) MR evaluation of ventricularfunction: true fast imaging with steadystateprecession versus fast low-angle shot cineMR imaging: feasibility study. Radiology 219(1):264-2695 Pruessmann KP et al. (1999) SENSE: sensitivityencoding for fast MRI. Magn Reson Med 42(5):952-9626 Kyriakos WE et al. (2000) Sensitivity profiles froman array of coils for encoding and reconstructionin parallel (SPACE RIP). Magn Reson Med <strong>44</strong>(2):301-3087 Weiger M, Pruessmann KP, Boesinger P (2000)Cardiac real-time imaging using SENSE.SENSitivity Encoding scheme. Magn Reson Med43(2): 177-1848 Lasalarie JC, Serfaty JM, Carre C, Messika-ZeitounD, Jeannot C, Schouman-Claeys E, Laissy JP (2007)Accuracy of contrast-enhanced cine-MR sequencesin the assessment of left ventricular function:comparison with precontrast cine-MR sequences.Results of a bicentric study. Eur Radiol 17(11):2838-28<strong>44</strong>9 Mollet NR, Dymarkowski S, Volders W, et al. (2002)Visualization of ventricular thrombi with contrastenhancedmagnetic resonance imaging inpatients with ischemic heart disease. Circulation106: 2873–287610 Srichai MB, Junor C, Rodriguez LL, et al. (2006)Clinical, imaging, and pathological characteristicsof left ventricular thrombus: a comparison ofcontrast-enhanced magnetic resonance imaging,transthoracic echocardiography, and transesophagealechocardiography with surgical orpathological validation. Am Heart J 152:75–8411 Barkhausen J, Hunold P, Eggebrecht H, et al. (2002)Detection and characterization of intracardiacthrombi on MR imaging. AJR 179:1539–15<strong>44</strong>Diagnosis and standards of therapyMagnetic resonance imaging (MRI) andultrasound (US) are the noninvasivetechniques of choice and can be usedfor the evaluation of VMs. Because ofthe limitations of US (small field-ofview,restricted penetration, operatordependency), MRI has emerged as anextremely important modality in theassessment of these lesions. The literature,recognizes that the extent of tissueinvolvement (muscles, nerves, bone,tendons, subcutaneous tissue and skin)can be accurately determined by MRI,the full extent often being underestimatedby physical examination. As aconsequence, exact categorization of aVM by MRI guides treatment towardpercutaneous embolization, transarterialembolization or a surgical approach.Since the diagnosis of a vascular lesionrelies mainly on medical history andclinical examination, diagnostic imagingcan be focused on specific structuraland functional information required fortreatment planning. In general, evaluationof VMs requires delineation of itscomponents:(1) location, size, and tissue involvement,(2) origin, orientation, and course offeeding arteries, and(3) origin, size, and course of the drainingveins.Due to continuous improvements inhard- and software within the last fewyears, time-resolved MR angiography(MRA) in particular has been gainingacceptance as a practical alternative todigital subtraction angiography (DSA)for the diagnosis and determination ofappropriate treatment of VMs [3]. TimeresolvedMRA has been shown to be anaccurate technique to distinguish thedifferent types of vascular anomalies [4].MR imagingPatients with suspicious or known AVMwere studied using a 3D time-resolvedcontrast-enhanced (ce)MRA which incorporatesGeneralized Autocalibrating PartiallyParallel Acquisitions (GRAPPA) andecho sharing schemes, Time ResolvedImaging with Stochastic Trajectories(TWIST). All patients were examined ona 1.5T MR system (<strong>MAGNETOM</strong> Avanto,<strong>Siemens</strong> <strong>Healthcare</strong>, Erlangen, Germany),using a multi-channel phased-arraysurface coil or dedicated flex extremitycoils.All scans consisted of T1 and fat-suppressedT2-weighted images. Axialconventional spin-echo (SE) and / orturbo spin-echo (TSE) T1-weighted andT2-weighted TSE images were obtainedby using 5–10 mm section thickness,1–2 mm intersection spacing, and variablefield-of-view depending on theextremity. Post-contrast images wereobtained in axial and sagittal and/or coronalplane following intravenous administrationof 0.1 mmol/kg gadobutrol(Gadovist®, Bayer HealthCare, Germany).Time-resolved MRA using TWISTThe TWIST sequence divides k-space intoa central (A) and a peripheral (B) region.The central region (low frequencies)defines the contrast in the image andthe peripheral region (high frequencies)accounts for the detail information in40 <strong>MAGNETOM</strong> <strong>Flash</strong> 2/2010 · www.siemens.com/magnetom-world <strong>MAGNETOM</strong> <strong>Flash</strong> · 2/2010 · www.siemens.com/magnetom-world 41
Clinical Cardiovascular MRICardiovascular MRI Clinical1A1B1C1 39-year-old malepatient presented witha painful pulsatingmass in the left buttocksoft tissue. There is anincrease in local skintemperature and a thrillwhen the lesion is palpated.(1A): On time-resolvedMRA an aneurysm ofthe intern iliac artery aswell as a large VMinvolving the left upperthigh, buttock andlumbar region is found.Multiple feeding arteriesand an early opacificationof dilated outflowveins can be seen.Additional CT scan wasperformed in order toevaluate extent of diseaseand tissue involvementprior to treatment.CT images inaxial (1B) and coronal(1C) orientation confirmeddiagnosis demonstratinga number ofprominent arteries andarterioles mainly in theleft gluteus muscle andmultiple huge dilatedand early draining veinsin the subcutaneouslayer, compatible with ahigh-flow arteriovenousmalformation.2A2B2B2 46-year-old female patient presenting with a high-flow AVM of the right hand. (2A) On time-resolved MRA (2.7 s/frame) feeding arteries ofthe radial and ulnar artery as well as an enlarged dorsal draining vein can be observed. (2B) Due to high-spatial resolution (in-plane resolution(1.3 x 1.3) mm 2 , slice thickness 1.3 mm), multiplanar reformatted views obtained from a single dataset allow for more precise evaluation ofvascular pathology in addition to viewing the standard MIP in the acquired plane. (2C) Morphological images showed subcutaneous hypointensmass on T1w as well as T2w sequences. Fast flow vessels are also identified by the presence of flow voids within the mass (open arrow). There isno enhancement after application of gadobutrol (lower row).the images. While region A is completelysampled for every measurement repetition,region B is undersampled by afactor of n, which can be varied by theoperator. The larger the undersamplingfactor the shorter the time differencefor two consecutive acquisitions of thecentral region. The k-space trajectorywithin region B follows a spiral patternin the k y -k z plain with every trajectoryin B slightly different, depending on theundersampling factor n. During reconstruction,the missing data points inregion B for a particular time frame t iwill be copied from the correspondingk-space trajectories in other time frames.The following sequence parameterswere used: TR 2.27-3.46 ms, TE 0.8-1.29ms (depending on patient adjustment),flip angle (FA) 25°, sampling bandwidth(BW) 650-950 Hz/pixel; in-plane resolution 1.1 x 0.8 mm 2 , slice thickness1–3 mm. In our study we have used avalue of 15% for region A, and an undersamplingfactor of 25% for region B.Discussion2CT1 TSEThe TWIST technique has special advantagesfor MR imaging of VMs, becauseit provides information on the hemodynamicsof the malformations, demonstratingthe early filling of the lesionduring the arterial phase of the acquisitionas well as – where relevant – thefeeding artery. The use of parallel imagingtechniques in association with thevariable rate k-space sampling allows areduction of acquisition time, improvingthe temporal resolution while maintainingand even improving the spatial resolution.In our study protocol the temporalresolution was varying from 4.8 to1.4 seconds per single frame and thespatial resolution ranged from (1.1 x 0.8x 1.0) mm 3 to (1.1 x 1.1 x 3.0) mm 3 .A high acceleration factor of 3 was usedfor parallel imaging in most applications.Thus, we have been able to obtaindetailed anatomical and hemodynamicinformation similar not only to conventionalhigh-spatial resolution MRA butT2 STIRT1 TSE@Gd fsalso to that obtained with DSA, butwithout the risks associated with ionizingradiation exposure, iodizing contrastagents, or catheterization itself.Clinical implicationIn general, whilst differentiationbetween a vascular malformation and ahemangioma can often be obtainedclinically, MRI will be useful in this regardin several cases. Diagnostic imaging isoften required for the evaluation ofdeeper lesions or in the setting of anatypical history to allow differentiationfrom other malformations or non-malformationlesions. As a result, MRI hasbecome the imaging modality of choicein the assessment of morphologicalissues of VMs, e.g. extent of the lesion,tissue involvement and flow characteristics(signal voids in high-flow lesions).At our institution, based on these initialresults, time-resolved MRA will influencetherapeutic decision making by definingthe internal architecture of a VM and its42 <strong>MAGNETOM</strong> <strong>Flash</strong> 2/2010 · www.siemens.com/magnetom-world <strong>MAGNETOM</strong> <strong>Flash</strong> · 2/2010 · www.siemens.com/magnetom-world 43
Clinical Cardiovascular MRI3A3BT1 TSET2 STIRGd T1 TSE fs3 Ten consecutive coronaltime-resolved invertedMIP images (2.0 s/frame)in a 25-year-old malepatient presenting with avascular malformation ofright upper thigh. An earlyenhancement of dilatedvessels in the subcutaneouslayer can be seen.(3B) Correspondingmorphological images inan axial orientation.T1-weighted pre- andpost-contrast as well asT2-weighted images showmultiple dilated vessels inthe subcutaneous tissue.<strong>No</strong> involvement of theright gluteus maximusmuscle was found.relationship to adjacent critical structures.Moreover, TWIST allows highlysensitive and specific discriminationbetween high-flow and low-flow malformations.Furthermore, time-resolvedMRA can also serve as an objectivemethod to quantitatively assess therapeuticoutcomes through serial MRIscans (size of treated lesion, signal characteristics).ConclusionVascular malformations are complexlesions with a variety of clinical manifestations.Time-resolved MRA combinedwith parallel imaging and echo sharingschemes represents a reasonable alternativeto more invasive DSA for the evaluationof VMs. Therefore, time-resolvedMRA can play an important role in categorizingthese lesions and determiningtheir extent in order to correctly guidetreatment.References1 Mulliken JB, Glowacki J. Hemangiomas andvascular malformations in infants and children: aclassification based on endothelial characteristics.Plast Reconstr Surg 1982; 69:412-422.2 Meyer JS, Hoffer FA, Barnes PD, et al. Biologicalclassification of soft-tissue vascular anomalies:MR correlation. AJR Am J Roentgenol 1991;157:559-564.3 van Rijswijk CS, van der LE, van der Woude HJ, etal. Value of dynamic contrast-enhanced MRimaging in diagnosing and classifying peripheralvascular malformations. AJR Am J Roentgenol2002; 178:1181-1187.4 Rinker B, Karp NS, Margiotta M, et al. The role ofmagnetic resonance imaging in the managementof vascular malformations of the trunk and extremities.Plast Reconstr Surg 2003; 112:504-510.ContactUlrich Kramer, M.D.Diagnostic and Interventional RadiologyUniversity Hospital TübingenHoppe-Seyler-Str. 372076 TübingenGermanyUlrich.Kramer@med.uni-tuebingen.deCommon AcronymsAFB 0B 1CAce<strong>CMR</strong>CNRCOCPCTADCEDEDESSDSAEPIEDVEFESVFAFLASHFLAIRfMRIFoVGRAPPAGREHASTEHLAiPATIRLCELELGELVOTMEDICMIONMIPMNPMPRMPRIAtrial FibrillationMain (constant) magnetic fieldRadio-frequency magnetic fieldContrast AgentContrast EnhancedCardiac / Cardiovascular Magnetic Resonance(Imaging)Contrast-to-<strong>No</strong>ise RatioCardiac OutputCircular PolarizationComputed Tomography AngiographyDelayed Contrast Enhancement, syn.: DEDelayed Enhancement, delayedhyperenhancementDual Echo Steady StateDigital Subtraction AngiographyEcho Planar ImagingEnd-diastolic VolumeEjection FractionEnd-systolic VolumeFlip AngleFast-Low-Angle-SHotFluid Attenuated Inversion RecoveryFunctional Magnetic Resonance ImagingField of ViewGeneRalized Autocalibrating PartiallyParallel Acquisition (parallel imaging technique)GRadient EchoHalf-Fourier Acquisition Single-shot TurboSEHorizontal Long Axisintegrated Parallel Acquisition TechniqueInversion RecoveryLate Contrast Enhancement, syn.: DELate Enhancement, syn.: DELate Gadolinium Enhancement, syn.: DELeft-ventricular Outflow TractMulti-Echo Data Image CombinationMonocrystalline Iron Oxide NanoparticlesMaximum Intensity ProjectionMagnetic (Iron Oxide) NanoparticlesMultiplanar Reconstruction/ReformationMyocaridal Perfusion Reserve IndexMRAMagnetic Resonance AngiographyNATIVE SPACE For peripheral MR angiography. Imagesof arteries and veins without contrastagent (native).PCPDPSIRRFRVRVOTSARSESENSESLTSNRSRSSFPSTIRSVTTATDTETEETFLTITimTimCTTIRMTrueFISPTRTSEtSENSETTETTPTWISTvencVIBEVLAVRTVSDPhase ContrastProton DensityPhase-Sensitive Inversion RecoveryRadioFrequencyRight ventricleRight-ventricular Outflow TractSpecific Absorption RateSpin-EchoSensitivity EncodingSLice Thickness, syn.: SLSignal-to-<strong>No</strong>ise RatioSaturation RecoverySteady-State-Free-PrecessionShort T1 Inversion RecoveryStroke VolumeTeslaAcquisition TimeTrigger DelayEcho timeTransesophageal EchocardiographyTurboFLASHInversion TimeTotal imaging matrixTim Continuous Table MoveTurbo Inversion Recovery MagnitudeTrue Fast Imaging and Steady PrecessionRepetition TimeTurbo Spin-EchoTime-adaptive SENSitivity Encoding(parallel imaging technique)Transthoracic EchocardiographyTime to PeakTime-resolved angiography WithInterleaved Stochastic TrajectoriesVelocity EncodingVolume Interpolated BreathholdExaminationVertical Long AxisVolume Rendering TechniqueVentricular Septal Defect<strong>44</strong> <strong>MAGNETOM</strong> <strong>Flash</strong> 2/2010 · www.siemens.com/magnetom-world <strong>MAGNETOM</strong> <strong>Flash</strong> · 2/2010 · www.siemens.com/magnetom-world 45
Clinical Cardiovascular MRICardiovascular MRI Clinical4D Flow MR Imaging1A4D Flow MRI1BRaw DataAlex Barker; Jelena Bock; Ramona Lorenz; Michael MarklDepartment of Radiology, Medical Physics, University Hospital Freiburg, GermanyIntroductionMagnetic Resonance Imaging (MRI)techniques provide non-invasive, highlyaccurate anatomic depictions of theheart and vessels. The intrinsic motionsensitivity of MRI can be used to imagevessels with phase contrast (PC) MRangiography,or to quantify blood flow[1–3].Traditionally, MR imaging of flow isaccomplished using methods thatresolve two spatial dimensions (2D) inindividual slices [4]. Alternatively, 3Dspatial encoding offers the possibility ofisotropic high spatial resolution andthus the ability to measure and visualizethe temporal evolution of complex flowpatterns in a 3D-volume. In this context,ECG synchronized flow-sensitive 3D MRIusing 3-directional velocity encoding(also termed ‘flow-sensitive 4D MRI‘,‘4D Flow MRI‘, ‘time-resolved 3D velocitymapping‘ or ‘4D PC-MRI‘) can beemployed to detect and visualize globaland local blood flow characteristics intargeted vascular regions (aorta, cranialarteries, carotid arteries, etc.) [5, 6].The nature of such datasets (3 spatialdimensions, 3 blood flow velocity directions,and time) points towards thepotential of flow-sensitive 4D MRI toprovide detailed quantitative flow andvessel wall parameters with completevascular coverage. A number of recentstudies have indicated the potential offlow-sensitive 4D-MRI for the detailedvisualization of complex flow patternsassociated with healthy and pathologichemodynamics [7–12].Over the past few years, flow-sensitive4D MR imaging has systematicallyimproved to the point that it is possibleto reliably acquire comprehensive flowinformation within reasonable scantimes on routine clinical MR systems.However, the subsequent analysis andvisualization of complex, three-directionalblood flow within a 3D volume isstill time consuming, and advanced dataprocessing and 3D visualization toolsare necessary.In this article we report the first experienceswith a new software prototype*for analysis of 4D Flow data, developedby <strong>Siemens</strong> <strong>Healthcare</strong> in cooperationwith the Medical Physics group at theUniversity Hospital Freiburg, Germany.After a brief overview of MR imagingand data analysis methods, we presenttheir application for the evaluation offlow-sensitive 4D MRI in different vascularterritories in the human body.4D Flow MR ImagingModern phase contrast MR imagingallows for the simultaneous acquisitionof 3D morphology and time-resolvedblood flow velocities in 3 directions. Dueto the large amount of data collected,the acquisition timing relies on an efficientsynchronization with cardiac andrespiratory motion. Image acquisition istherefore based on an ECG-synchronizedfast gradient echo sequence with shortecho and repetition times in the orderof TE = 2–4 ms and TR = 5–7 ms. Forthoracic and abdominal applications,additional respiration control usingnavigator gating is necessary to avoidbreathing artifacts. A number of recentmethodological improvements (parallelimaging, adaptive respiration controlwith increased efficiency, etc.) allow forthe acquisition of flow-sensitive 4D MRIdata with reasonable scan times in theorder of 10–20 minutes. Ultimately, thetotal scan time will depend on the heartrate and efficiency of respiration controlin the individual patient. Typical imagingparameters providing full spatial andtemporal coverage of different cardiovascularregions of interest are summarizedin table 1.1CNavigatorgating3DvolumeData Analysis & 3D Visualizationanalysisplanevelocity vector graphsrawdatavessel segmentation ¢er linevelocity-time curvesalong center line* Works in Progress. The product is under development and is notcommercially available in the U.S. and its future availability cannotbe ensured.1 Schematic summary of the data acquisition and analysis strategy for flow-sensitive 4D MRI in the thoracic aorta. A: For 4D Flow imaging,a sagittal oblique volume covering the entire thoracic aorta is used. Data acquisition is synchronized with the cardiac cycle (ECG gating) and performedduring free breathing using adaptive respiration control based on navigator gating of the lung-liver interface. B: The 4D Flow raw data,directly after reconstruction consist of the magnitude (top left) and the three sets of velocity encoded phase difference images (v x , v y and v z ).These images depict a single sagittal oblique slice at one systolic time point within the acquired 3D volume. Each velocity image representsquantitative velocity components along one encoding direction in which the gray-scale values correspond to the velocity magnitude anddirection. C: 4D Flow data analysis prototype. 3D flow visualization in the same thoracic aorta is shown in figure 2. AAo: ascending aorta,DAo: descending aorta, lPA: left pulmonary artery.46 <strong>MAGNETOM</strong> <strong>Flash</strong> 2/2010 · www.siemens.com/magnetom-world <strong>MAGNETOM</strong> <strong>Flash</strong> · 2/2010 · www.siemens.com/magnetom-world 47
Clinical Cardiovascular MRICardiovascular MRI ClinicalTable 1: Typical scan parameters for flow-sensitive 4D MRI in different vascular territories.Velocity sensitivity refers to the maximum blood flow velocity that can be measured withoutfold-over artifacts (velocity aliasing).application spatial resolution temporal resolution navigator gating velocity sensitivityaorta & pulmonaryartery2.2 mm 3 40 ms lung-liverinterface100 –150 cm/scarotid arteries 1.2 mm 3 45 – 50 ms – 100 cm/s2AAAovelocity [m/s]74.32 cm/sec2A Time-resolved 3D pathlinesin a normal thoracicaorta during peak systole.A: All traces originate fromtwo emitter planes in theascending aorta and proximaldescending aorta(not shown). Color codingreflects the local absoluteblood flow velocity.intracranial arteries 1 mm 3 45 – 50 ms – 80 cm/sIPAportal venous system 2.1 mm 3 45 ms spleen-liverinterface50 cm/semitterplane0.00 cm/seciliac & femoralarteries2 mm 3 40 ms – 80 –100 cm/sDAo4D Flow analysis and3D visualizationFlow-sensitive 4D MRI obtains, for eachvoxel within a 3D-volume and at eachmeasured time point of the cardiac cycle,anatomical and three-directional velocityinformation. The 4D nature of the datafrees the operator from choosing predefinedexamination planes within thevascular system of interest and offersthe opportunity to quantify blood flowat any desired location within the datavolume.The new 4D Flow analysis software wasdeveloped to allow for a straightforwardand time-efficient analysis of flow characteristicsdirectly following data acquisition.Post-scan, the 4D Flow data canbe directly loaded into the software prototype,providing a basic toolbox necessaryto produce 3D anatomic and flowvisualization. This includes 3D vesselgeometry rendering by a combination ofthresholding and segmentation, optionsto semi-automatically or interactivelydefine 2D analysis planes, and automatedcalculation of vessel center lines.Analysis planes can be manually sized,angulated and used to display regionalblood flow velocities as vector fields orto show velocity-time curves along thecenter line.Currently implemented features for dataanalysis and 3D visualization include:■ Direct loading and database storage of4D Flow raw data.■ Combined vessel lumen thresholdingand segmentation to depict 3D vasculargeometry/anatomy.■ Interactive 3D data manipulation and4D (3D + time) viewing.■ Interactive ‘point and click’ definitionof analysis planes and vessel centerline calculation.■ Calculation of mean velocity-timecurves in analysis planes longitudinallyalong vessel center line.■ Flow visualization based on timeresolved3D pathlines originating frommultiple and freely selectable emitterplanes and locations (including theoption to color code according to localabsolute blood flow velocity or byvascular origin).■ Planar flow visualization as vectorgraphs or color coded overlay.A summary of representative 4D Flowdata acquisition and analysis in thethoracic aorta is illustrated in figure 1.The 4D Flow prototype and its differentfeatures to display and evaluate rawdata, vessel geometry, vessel center line,interactively positioned analysis planes,and velocity-time curves are shown infigure 1C. The 3D flow visualizationresults, using time-resolved 3D pathlinesare depicted in figure 2.2BAAoemitterplaneIPADAoaortapulmonary artery2B B: Flow visualization by3D pathlines in the aortaand pulmonary system.Color coding according tothe origin of the traces (red= aorta, blue = pulmonaryartery) allows for a clearseparation of aortic and pulmonaryflow channels whichcan help understandingcomplex flow patterns ormixing of flows of differentorigin. AAo: ascendingaorta, DAo: descendingaorta, lPA: left pulmonaryartery.48 <strong>MAGNETOM</strong> <strong>Flash</strong> 2/2010 · www.siemens.com/magnetom-world <strong>MAGNETOM</strong> <strong>Flash</strong> · 2/2010 · www.siemens.com/magnetom-world 49
Clinical Cardiovascular MRICardiovascular MRI Clinical3A3B4A4BleftPVIVCaneurysmflowvortexAo100.62 cm/secrightPVAAoemitterplaneportalveincenterline0.00 cm/secemitterplanesDAovelocity [m/s]4Cvelocity [m/s]33.21 cm/sec4 3D flow characteristicsof the venous supply in thenormal liver. Time-resolved3D pathlines illustrate thedynamics (A–C) of the fillingof the portal vein and itsmajor branches. <strong>No</strong>te thereduced venous blood flowvelocities compared to arterialflow patterns in figures1–3 and 5, which wereassessed by flow-sensitiveMRI with low velocity sensitivity(venc) of 50 cm/s.PV: portal vein, A0: aorta,IVC: inferior vena cava.3 3D flow pattern development in the thoracic aorta in a patient with tubular hypoplasia of the aortic arch and an aneurysm of the proximaldescending aorta (yellow arrow, diameter = 4.2 cm). 3D pathlines within the segmented aortic lumen clearly illustrate increased flow along theouter aneurysm wall and formation of a pronounced flow vortex within the aneurysm. The possibility to detect flow patterns such as vortex flowor identify regions with increased velocities may help to identify regions with abnormal flow and altered shear forces acting on the vessel wall.It is known from the literature that unfavorable shear forces at the vessel wall can change endothelial function and create areas at risk for vascularremodeling. The identification of such flow patterns may thus help to identify previously not assessable markers for the progression of disease ordevelopment of secondary pathologies such as aneurysms or dissections. AAo: ascending aorta, DAo: descending aorta.0.00 cm/secApplicationsIn the following examples, a number ofdifferent vascular territories are presentedto illustrate the utility of the new4D flow analysis software prototype forthe comprehensive evaluation of vascularhemodynamics. Figure 3 showsresults from the combined visualizationof vessel geometry and 3D flow patternsclearly illustrating altered flow patternsand marked vortex flow in a thoracicaortic aneurysm. The dynamics of normalportal venous flow supplying the liverare depicted in figure 4 demonstratingthe subsequent filling of the portal veinand its main branches. Figure 5 showsthe hemodynamic environment in acarotid bifurcation belonging to a patientwith a moderate stenosis of the internalcarotid artery. <strong>No</strong>te that for all patients,the flow sensitive 4D MRI data reflectsthe true underlying time-resolved bloodflow velocity vector field and it is thereforepossible to quantify blood flowvelocities as shown by the velocity-timecurves along the vessel center linesin figures 1 and 5. More details for eachcase are provided in the legends offigures 3–5.The current 4D Flow prototype offers anew and time efficient tool to evaluate4D flow data and has demonstrated itspotential for analysis of arterial andvenous hemodynamics in different vascularterritories. Further improvementsof this first software prototype includethe implementation of correction algorithmsfor eddy currents and velocityaliasing as well as improved reportingand presentation functionality. Inaddition, supplementary refinementsregarding flexible quantification of flowparameters (e.g. peak systolic velocities,regurgitant fraction) and derived parameters(e.g. wall shear stress, pressuredifferences) will enable a comprehensiveevaluation of the structural andfunctional information embedded in 4Dflow data.In summary, the new 4D Flow analysisprototype provides an important first stepfor the efficient evaluation of vascularhemodynamics – providing a foundationfor the adaptation of this technique inthe clinical workflow. Further softwareadditions and testing at multiple centerswill also provide the opportunity toimprove clinical acceptance of flow-sensitive4D MRI, including the identificationof important clinical applications and tostreamline future developments.50 <strong>MAGNETOM</strong> <strong>Flash</strong> 2/2010 · www.siemens.com/magnetom-world <strong>MAGNETOM</strong> <strong>Flash</strong> · 2/2010 · www.siemens.com/magnetom-world 51
5color codedClinical Cardiovascularvelocities3D pathlinesCardiovascular MRI ClinicalcenterlineICA stenosisECACCAICA57.23 cm/sec0.20 cm/secvelocity[m/s]Case Report: Combined Assessment ofHaemodynamics and Vessel Architecturein a case of Brain AVMJens Fiehler, M.D.ICA57.23 cm/secDepartment of Diagnostic and Interventional Neuroradiology,University Medical Center Hamburg-Eppendorf (UKE), Hamburg, Germanyvelocity-time curvesalong center lineECA5 Visualization of 3D blood flow characteristics in the carotid bifurcation in a patient with moderate (40%) stenosis of the internal carotidartery (ICA). Thresholding using 3D PC-MR angiography derived form the 4D Flow data and subsequent vessel segmentation allowed for thedepiction of the geometry of the carotid bifurcation. The definition of a vessel centerline from the common (CCA) into the internal carotidartery was used to calculate blood flow velocity – time curves in analysis planes along the center line. 3D flow visualization using time-resolvedpathlines revealed straight flow through the stenosis and considerably enhanced helix flow within the post-stenotic dilatation. ECA = externalcarotid artery.Left to right: Ramona Lorenz, Jelena Bock,Michael Markl, Alex BarkerContactPD. Dr. Michael MarklDepartment of Radiology, Medical PhysicsUniversity Hospital Freiburg, GermanyPhone: +49 761 270 3832Fax: +49 761 270 3831michael.markl@uniklinik-freiburg.deReferences1 Firmin DN, Nayler GL, Kilner PJ, Longmore DB.The application of phase shifts in NMR forflow measurement. Magn Reson Med 1990;14(2):230-241.2 Dumoulin CL. Phase contrast MR angiographytechniques. Magn Reson Imaging Clin N Am1995;3(3):399-411.3 Bock J, Frydrychowicz A, Stalder AF, Bley TA,Burkhardt H, Hennig J, Markl M. 4D phase contrastMRI at 3 T: effect of standard and blood-pool contrastagents on SNR, PC-MRA, and blood flow visualization.Magn Reson Med 2010;63(2):330-338.4 Pelc NJ, Herfkens RJ, Shimakawa A, Enzmann DR.Phase contrast cine magnetic resonanceimaging. Magn Reson Q 1991;7(4):229-254.5 Wigstrom L, Sjoqvist L, Wranne B. Temporallyresolved 3D phase-contrast imaging. MagnReson Med 1996;36(5):800-803.6 Markl M, Harloff A, Bley TA, Zaitsev M, Jung B,Weigang E, Langer M, Hennig J, FrydrychowiczA. Time-resolved 3D MR velocity mapping at 3T:improved navigator-gated assessment of vascularanatomy and blood flow. J Magn ResonImaging 2007;25(4):824-831.7 Frydrychowicz A, Winterer JT, Zaitsev M, Jung B,Hennig J, Langer M, Markl M. Visualization ofiliac and proximal femoral artery hemodynamicsusing time-resolved 3D phase contrast MRI at 3T.J Magn Reson Imaging 2007;25(5):1085-1092.CCA0.20 cm/secvelocity[m/s]8 Wetzel S, Meckel S, Frydrychowicz A, Bonati L,Radue EW, Scheffler K, Hennig J, Markl M. Invivo assessment and visualization of intracranialarterial hemodynamics with flow-sensitized4D MR imaging at 3T. AJNR Am J Neuroradiol2007;28(3):433-438.9 Harloff A, Albrecht F, Spreer J, Stalder AF, Bock J,Frydrychowicz A, Schollhorn J, Hetzel A,Schumacher M, Hennig J, Markl M. 3D blood flowcharacteristics in the carotid artery bifurcationassessed by flow-sensitive 4D MRI at 3T. MagnReson Med 2009;61(1):65-74.10 Uribe S, Beerbaum P, Sorensen TS, Rasmusson A,Razavi R, Schaeffter T. Four-dimensional (4D)flow of the whole heart and great vessels usingreal-time respiratory self-gating. Magn ResonMed 2009;62(4):984-992.11 Hope MD, Hope TA, Meadows AK, Ordovas KG,Urbania TH, Alley MT, Higgins CB. Bicuspid aorticvalve: four-dimensional MR evaluation of ascendingaortic systolic flow patterns. Radiology2010;255(1):53-61.12 Stankovic Z, Frydrychowicz A, Csatari Z, Panther E,Deibert P, Euringer W, Kreisel W, Russe M, Bauer S,Langer M, Markl M. MR-based visualization andquantification of three-dimensional flow characteristicsin the portal venous system. J Magn ResonImaging 2010;32(2):466-475.Patient history58-year-old male with brain arteriovenousmalformation (AVM). Brain imaging wasscheduled because of his newly occurringheadache probably not related tothe AVM.Sequence detailsAll images have been acquired using a3T <strong>MAGNETOM</strong> Trio and the 8-channelphasedarray-head-coil. Along with othersequences, we used a 3D time-resolvedecho-shared MR-angiography (TWIST)i.e. 4D-MRA. TWIST was performed usinga 3D fast low-angle shot sequence within-plane image resolution of 2.8 mm x1.9 mm and slice resolution of 5 mm.Parallel imaging with a GRAPPA (generalizedautocalibrating partially parallelacquisitions) factor of 2 applied. Contrastinjection was performed by intravenouspump injection of 20 ml contrast agent(MultiHance, Bracco-ALTANA, Konstanz,Germany) at 4 ml/s followed by 20 mlisotonic saline. This technique allowedacquisition of one 3D data set in 0.5seconds. After TWIST acquisition, a 3Dtime-of-flight magnetic resonance angiography(TOF-MRA) was obtained with amagnetization transfer saturation pulse,TR 36 ms, TE 6 ms, flip angle 25°, 2 slabswith 32 partitions, image in-plane imageresolution of 0.47 mm x 0.47 mm, slicethickness 0.5 mm and a FOV 150 mm x200 mm.11 3D maximum intensity projection over time (MIPt).52 <strong>MAGNETOM</strong> <strong>Flash</strong> 2/2010 · www.siemens.com/magnetom-world<strong>MAGNETOM</strong> <strong>Flash</strong> · 2/2010 · www.siemens.com/magnetom-world 53
Clinical Cardiovascular MRICardiovascular MRI ClinicalImaging findings24A4BCombination of information of haemodynamicsbased on the voxel-orientedanalysis of the temporal intensity curvein TWIST 4D-MRA and anatomical vesselstructures in high spatial resolution(TOF-MRA) required the co-registrationof both datasets by the home writtensoftware tool AnToNIa (Analysis Tool forNeuro Image Data, http://www.uke.de/institute/medizinische-informatik/).A 3D maximum intensity projection overtime (MIPt) was created based on the4D-MRA dataset (Fig. 1). Thereafter, thereso-lution of the 3D MIPt was adaptedto the 4D-MRA using a cubic resamplingfilter. Finally, the transformation fieldbetween the two data sets was calculatedusing an affine 3D-3D registrationmethod with mutual information as similaritymeasure. Based on the computedtransformation field all dynamic characteristicswere transferred directly tothe TOF-MRA image and color-codeddepending on the blood inflow characteristicat the vessel surface (Fig. 2) orin section anatomy (Fig. 3). In an alternativeviewing method the inflowingblood can be depicted in a sequentialmanner (Figure 4 A–D).32.5 s4.0 s2.5 s4C4DDiscussionThe short acquisition time allows easyand robust application of TWIST in clinicalroutine patients. By using the postprocessingmethod as described one canevaluate the complex AVM anatomy fromall angles and directions together withinflow information at one time to determinethe treatment strategy. The hemodynamicrelation of all feeding arteriesand draining veins can be assessed intotal. In conventional DSA, injections intoseparate arteries that influence eachother are needed, resulting in differentseries that need to be merged for interpretation.In this particular case we seea temporal AVM that is fed by middlecerebral artery and drained by multipleepicerebral drainage veins. The vein ofTrolard is the last draining vein (Fig. 4D).Another advantage of the 4D method isthe possibility of view into the AVMNidus and its intranidal hemodynamics2 MIP projection of the vessels with color-coded information on haemodynamics of the AVM.3 Transversal reconstruction and overlay of haemodynamic information on TOF MPR.in any required direction. The intranidalflow direction is from lateral to mesial(Fig. 3). The amount of image informationis considerable. We needed sometime to take advantage of this method.4.0 sToday we are convinced that it deliversunique information. A TWIST is conductedin all of our AVM patients. We arein the process of further improvement.4 Inflowing blood (red color) and its distribution visualized at four different time points (A–D).ContactProf. Jens Fiehler, M.D.Department of Diagnostic andInterventional NeuroradiologyUniversity Medical CenterHamburg- Eppendorf (UKE)Haus Ost 22 (O 22)Martinistr. 5220246 Hamburg, GermanyTel.: +49 40 7410 52746Fax: +49 40 7410 40114fiehler@uke.de54 <strong>MAGNETOM</strong> <strong>Flash</strong> 2/2010 · www.siemens.com/magnetom-world <strong>MAGNETOM</strong> <strong>Flash</strong> · 2/2010 · www.siemens.com/magnetom-world 55
Clinical Cardiovascular MRICardiovascular MRI ClinicalPerfusion Imaging and Stroke1Pavlina Polaskova, M.D. 1 ; W. Taylor Kimberly, M.D. 2 , Ph.D.; A. Gregory Sorensen, M.D. 1 , Ona Wu, Ph.D. 11Athinoula A. Martinos Center for Biomedical Imaging, Department of Radiology,Massachusetts General Hospital, Charlestown, MA, USA2Massachusetts General Hospital Neuroscience Intensive Care Unit,Harvard Medical School, Charlestown, MA, USAMagnetic resonance imaging hasbecome an integral part of patient managementand clinical research in stroke.As the majority of stroke patients havean ischemic etiology, assessment of tissueperfusion with perfusion-weightedMR imaging can play a major role indiagnosis, evaluation of therapy, andclinical follow-up.To date, the only FDA-approved pharmaceuticaltreatment for acute ischemicstroke is recombinant tissue plasminogenactivator (rt-PA) [1]. However, in theUS and in other countries only a fewpercent of patients with acute ischemicstroke are treated by rt-PA, typicallybecause of late arrival to medical care(e.g. they arrive later than the requisitetime window of 3 or 4.5 hours) [2, 3].Hence there remains substantial interestin developing novel stroke therapeuticsthat could be effective in a wider therapeuticwindow, or to extend the windowfor thrombolysis into patient populationswith delayed presentation. The recentresults of ECASS 3 study demonstratethat thrombolysis can be safely applied aslate as 4.5 hours in certain well-characterizedpatients with a resultant improvementin neurological outcomes [4].The benefit of thrombolysis appears togradually diminish over time, which haslead to the maxim “time is brain,” andin all cases guidelines suggest treatingpatients as rapidly as possible. However,it has been proposed that the 3 hour oreven the 4.5 hour reperfusion windowmay be too narrow for certain groups ofpatients [5–8]. This has gained credenceas imaging has revealed that the extentof tissue that eventually undergoesinfarction varies substantially amongstroke patients, with some patientsappearing to have a persistent “ischemicpenumbra” that might be salvageablewell beyond 3 or 4.5 hours [9–11].How common is delayed presentation?In the US, the rate of rt-PA administrationin acute stroke patients hoversaround 5%. Because of the time neededto determine eligibility for thrombolysis,an additional 5% could be candidates fortreatment if the window were extendedto 6 hours [12]. Strikingly, a further 40%of stroke patients present to the emergencydepartment at time greater than6 hours but still acutely, suggesting thatstrategies that could extend treatmenteven into a small subpopulation couldhave a significant impact. While there isevidence that a substantial segment ofacute stroke patients present later than6 hours and less than 12, how likely isit that they may benefit from delayedthrombolysis? Accumulating data in theliterature combined with our own providetantalizing evidence that time ismuch less relevant after 6 hours ascompared to before. The heterogeneityof this delayed population however,obscures the potential benefit of thrombolysisthat certain subsets might experience.Indeed, ECASS 2 showed thatminimally selective strategies applied topatients even less than 6 hours did notresult in improved neurological outcomeand may have even been harmful.Extending treatment to patients in the6 to 12 hour category would thereforerequire careful selection.Which patients might benefit fromdelayed treatment? While there are fewsolid data to answer this question, thereare some intriguing clues.One widely used approach to the identificationof salvageable tissue is basedon a popular hypothesis: regions of mismatchbetween diffusion-weightedimaging (DWI) lesions and perfusionweightedimaging (PWI) lesions foundon early stroke imaging, that sometimesgo on to infarction, but sometimes donot, represent tissue that has anincreased likelihood of salvageability.The basis for this thinking is that sincebrain parenchyma can undergo a periodof hypoperfusion without developingpermanent parenchymal injury, perhapsthis mismatch region is salvageable.This mismatch region is sometimes thereforecalled an imaging correlate of theischemic penumbra. The DWI lesion isthought to represent irreversibly damagedarea, termed by some investigatorsto be representative of the ischemic core.This hypothesis has been tested in theDEFUSE study, a prospective study of 74patients receiving rt-PA therapy between3 to 6 hours after symptom onset [13].Patients with a mismatch had significantlyincreased odds of favorable clinicaloutcome if reperfusion was attained,whereas no beneficial effect with reperfusionwas observed in patients without.These findings support the idea that themismatch is a useful concept; other single-centerretrospective studies based onboth CT and MRI mismatches further supportthe mismatch hypothesis [14–16].Remarkably, we have found that as manyas 40% of our patients in the 6 to 12hour time frame still have a persistentpenumbra defined by DWI/PWI mismatch.Recent analysis reveals that perfusionimaging used to guide delayedIV thrombolysis is associated withDWI CBF MTT Follow-up FLAIR1 Persistent penumbra in 52-year-old male 11 hours post onset of symptoms. Mismatch (red arrows) proceeds to infarction onfollow-up FLAIR at 6 days. Figures reprinted with permission from MRM 50:856-864 (2003).increased reperfusion [17]. Interventionalapproaches have recently demonstratedthat good neurological outcomescan be achieved even when revascularizationoccurs later than 8 hours [18].Experience in the MERCI/multiMERCIcohort suggests that the time to reperfusionis not adversely associated withoutcomes in these delayed patients andthat good neurological outcomes arenearly as common early as they are late(~ 40%). Put another way, patients whowere reperfused later than 7 hours fromthe ictus had similar rates of good outcomecompared to those with earlierreperfusion [19]. Nevertheless, just overhalf of these patients did not experiencea good outcome and may have beenunnecessarily exposed to the risks of theintervention. Similarly, extending thrombolysisinto such a delayed populationmay carry increased risk of hemorrhage.This further emphasizes the importanceof characterizing and distinguishingpatients who may benefit from delayedtreatment from those who would not.At least two recent trials have investigatedthe outcome of reperfusion therapybased on PWI/DWI mismatch: EPITHET[20] barely missed its prospectivelydefined primary endpoint, which was todemonstrate whether patients exhibitingmismatch responded better to latert-PA therapy than those that did not;DIAS II [21] failed to demonstrate thatpatients selected using neuroimagingcan benefit from reperfusion therapy upto 9 h. While there were methodologicalissues with both of these trials – particularlywith perfusion imaging, which webelieve needs to be improved and madeless sensitive to delay artifacts – it seemslikely that more than DWI/PWI will beneeded. While the diffusion abnormalityis almost always associated with laterinfarction, even this is not always thecase [22].Still, the late presence of the DWI/PWImismatch remains intriguing. We haveidentified that this mismatch can behighly persistent, lasting for many hours[23], particularly in patients with proximalartery occlusions [24]. But the highvariability in tissue and clinical outcomeof the treatment based on the mismatchsuggests at least two major areas offurther research:■ methodological differences in thedefinition and measurement of themismatch;■ biological factors playing a role intissue salvageability.While the mismatch could be a sign thatthere is still viable tissue even at latetime points – something that PET alsohas suggested [25, 26] – it also couldmean that PWI-based method is unreliableand is actually not useful. Someinvestigators have suggested that theso-called mismatch might in reality bedue to technical limitations that havepreviously overestimated the size of thepenumbra. This leads to the question:Could the persistent penumbra simplybe an artifact?Currently, the measurement of tissueperfusion is based on serial imaging ofthe concentration of exogenous contrastagent, such as gadolinium-DTPA orendogenous agent, such as magneticallylabeled blood [27]. The most commontechnique is contrast-enhanced dynamicsusceptibility (T2*-weighted) technique(DSC), which employs the measurabledecrease of signal intensity, as it is seenon a series of rapid images obtainedwhen a bolus of IV contrast agent passesthrough the brain. This signal intensitydecrease can be converted to a concentration-timecurve, from which the hemodynamicparameters are then calculated.Cerebral blood flow (CBF), cerebralblood volume (CBV) and mean transittime (MTT), are estimated by deconvolvingthe change in tissue concentrationover the first pass of a bolus of contrastagent with an arterial input function(AIF) using standard singular valuedecomposition (sSVD) [28]. However,flow estimates using sSVD have beenshown to be sensitive to tracer arrivaldelay (such as might occur with carotidstenosis that caused a delay in tracerarrival but not a decrease in flow), anddispersion between the selected AIF and56 <strong>MAGNETOM</strong> <strong>Flash</strong> 2/2010 · www.siemens.com/magnetom-world <strong>MAGNETOM</strong> <strong>Flash</strong> · 2/2010 · www.siemens.com/magnetom-world 57
2Clinical DWI CardiovascularsCBFsMTTCardiovascular MRI ClinicalCBVoCBFtissue signals [29–32]. This results to asignificant underestimation of CBF andtherefore, greater mismatch.We developed a method to compensatethis, called circular deconvolution(oSVD), that uses a block-circulantmatrix for deconvolution to reduce sensitivityto tracer arrival differencesbetween chosen AIF and tissue signal.Adding the delay parameter to themethod (reflecting the disturbed hemodynamics)provides more accurate estimatesof CBF and MTT than standardsSVD. Importantly, the oSVD techniquegives results comparable to those ofsSVD when there are no differencesbetween the tracer arrival time of theAIF and the tissue signal [32, 33].Another cause of variability is using“global” arterial input function. It is typicallyselected manually by a trainedspecialist as the average of a small numberof concentration-time curves fromvoxels immediately adjacent to a majorartery in the contralateral hemisphereand then deconvolved from the concentration-timecurves for every voxel of thebrain. But, if used on a tissue that hasdelayed and/or dispersed concentrationtimecurves, this leads again to anunderestimation of the blood flow, thusadding another possible source of misinterpretation.In theory, both delay and dispersioncan be overcome by using the so-called“local AIF” method. In this method, anarterial input function (AIF) is definedfor each voxel based on the voxels in theoMTTFollow-upFLAIRlocal nearby region of tissue. Moreover,this method is fully automated, becausethe local AIFs can be selected as a partof a predefined algorithm. First resultsappear promising, though full validationremains to be carried out. As patientswith stroke are likely to have delay and/ordispersion, further improvements indelay and dispersion correction methodsremain the aim of ongoing research [34].We note that even with this improvedblood flow calculation methodology,more metabolic information may well beneeded to understand the concept ofpersistent penumbra and to truly identifysalvageable tissue. We and other groupshave already developed models thatincorporated other biological variables,such as stroke location, age and strokesubtype [35–37]. These methods takemultiple input parameters and allowthe system to create “risk maps” that canbe used to describe the probability ofinfarction of each single voxel of tissue,based on acute imaging. Other metabolic-focusedapproaches, currently beingstudied in our laboratory and other laboratories,include:■ brief patient exposure to oxygen, andmeasurement of the tissue response(by, for example, quantitative BOLDimaging);■ use of pH-weighted MR imaging,and correlating these findings withfollow-up tissue outcome,■ measuring levels of lactate in bothinfarcted tissue and penumbra (usingan adiabatic high-resolution spiral CSI2 Artifactual mismatch due todelay-sensitive CBF calculation ina 62-year-old male imaged 7 hafter symptom onset. The diffusionlesion (orange arrow) is similarto the 4 month follow-up FLAIRlesion (white arrow). The standardCBF and MTT maps (sCBF, sMTT)show a large mismatch (redarrows); this mismatch disappearswhen circular deconvolutionmethods are used (oCBF, oMTT,green arrows). Therefore the correctassessment is that there is noDWI/PWI mismatch in this patientwhen PWI is correctly computed.Figures reprinted with permissionfrom MRM 50:164-174 (2003).sequence) to determine their geographicaldifference and relation to thetissue viability.ConclusionStroke remains a major public healthproblem throughout the world, and MRIhas already contributed substantially toits management. Further efforts areneeded to improve perfusion imagingand beyond in order to optimally reducemorbidity and mortality.References1 Tissue plasminogen activator for acute ischemicstroke. The National Institute of NeurologicalDisorders and Stroke rt-PA Stroke Study Group.N Engl J Med. 1995;333:1581-1587.2 Goldstein LB. Acute ischemic stroke treatment in2007. Circulation. 2007;116:1504-1514.3 Katzan IL, Hammer MD, Hixson ED, Furlan AJ,Abou-Chebl A, Nadzam DM. Utilization of intravenoustissue plasminogen activator for acuteischemic stroke. Arch Neurol. 2004;61:346-350.4 Hacke W, Kaste M, Bluhmki E, Brozman M, DavalosA, Guidetti D, Larrue V, Lees KR, Medeghri Z,Machnig T, Schneider D, von Kummer R, WahlgrenN, Toni D. Thrombolysis with alteplase 3 to4.5 hours after acute ischemic stroke. N Engl JMed. 2008;359:1317-1329.5 Ringleb PA, Schellinger PD, Schranz C, Hacke W.Thrombolytic therapy within 3 to 6 hours afteronset of ischemic stroke: useful or harmful?Stroke. 2002;33:1437-1<strong>44</strong>1.6 Hacke W, Donnan G, Fieschi C, Kaste M, von KummerR, Broderick JP, Brott T, Frankel M, Grotta JC,Haley EC, Jr., Kwiatkowski T, Levine SR, LewandowskiC, Lu M, Lyden P, Marler JR, Patel S, TilleyBC, Albers G, Bluhmki E, Wilhelm M, Hamilton S.Association of outcome with early stroke treatment:pooled analysis of ATLANTIS, ECASS, and NINDSrt-PA stroke trials. Lancet. 2004;363:768-774.7 Kent DM, Ruthazer R, Selker HP. Are some patientslikely to benefit from recombinant tissue-typeplasminogen activator for acute ischemic strokeeven beyond 3 hours from symptom onset?Stroke. 2003;34:464-467.8 Kent DM, Selker HP, Ruthazer R, Bluhmki E,Hacke W. Can multivariable risk-benefit profilingbe used to select treatment-favorable patientsfor thrombolysis in stroke in the 3- to 6-hourtime window? Stroke. 2006;37:2963-2969.9 Schaefer PW, Ozsunar Y, He J, Hamberg LM,Hunter GJ, Sorensen AG, Koroshetz WJ, GonzalezRG. Assessing tissue viability with MR diffusionand perfusion imaging. AJNR Am J Neuroradiol.2003;24:436-<strong>44</strong>3.10 Sorensen AG, Buonanno FS, Gonzalez RG,Schwamm LH, Lev MH, Huang-Hellinger FR, ReeseTG, Weisskoff RM, Davis TL, Suwanwela N, Can U,Moreira JA, Copen WA, Look RB, Finklestein SP,Rosen BR, Koroshetz WJ. Hyperacute stroke: evaluationwith combined multisection diffusion-weightedand hemodynamically weighted echo-planarMR imaging. Radiology. 1996;199:391-401.11 Sorensen AG, Copen WA, Ostergaard L, BuonannoFS, Gonzalez RG, Rordorf G, Rosen BR, SchwammLH, Weisskoff RM, Koroshetz WJ. Hyperacutestroke: simultaneous measurement of relativecerebral blood volume, relative cerebral bloodflow, and mean tissue transit time. Radiology.1999;210:519-527.12 Prioritizing interventions to improve rates ofthrombolysis for ischemic stroke. Neurology.2005;64:654-659.13 Albers GW, Thijs VN, Wechsler L, Kemp S, SchlaugG, Skalabrin E, Bammer R, Kakuda W, LansbergMG, Shuaib A, Coplin W, Hamilton S, Moseley M,Marks MP. Magnetic resonance imaging profilespredict clinical response to early reperfusion: thediffusion and perfusion imaging evaluation forunderstanding stroke evolution (DEFUSE) study.Ann Neurol. 2006;60:508-517.14 Jansen O, Schellinger P, Fiebach J, Hacke W, SartorK. Early recanalisation in acute ischaemic strokesaves tissue at risk defined by MRI. Lancet.1999;353:2036-203715 Lev MH, Segal AZ, Farkas J, Hossain ST, PutmanC, Hunter GJ, Budzik R, Harris GJ, Buonanno FS,Ezzeddine MA, Chang Y, Koroshetz WJ, GonzalezRG, Schwamm LH. Utility of perfusion-weightedCT imaging in acute middle cerebral arterystroke treated with intra-arterial thrombolysis:prediction of final infarct volume and clinicaloutcome. Stroke. 2001;32:2021-2028.16 Parsons MW, Barber PA, Chalk J, Darby DG, RoseS, Desmond PM, Gerraty RP, Tress BM, WrightPM, Donnan GA, Davis SM. Diffusion- and perfusion-weightedMRI response to thrombolysisin stroke. Ann Neurol. 2002;51:28-3717 Mishra NK, Albers GW, Davis SM, Donnan GA,Furlan AJ, Hacke W, Lees KR. Mismatch-baseddelayed thrombolysis: a meta-analysis. Stroke.2010;41:e25-33.18 Natarajan SK, Snyder KV, Siddiqui AH, Ionita CC,Hopkins LN, Levy EI. Safety and effectivenessof endovascular therapy after 8 hours of acuteischemic stroke onset and wake-up strokes.Stroke. 2009;40:3269-3274.19 <strong>No</strong>gueira RG, Liebeskind DS, Sung G, DuckwilerG, Smith WS. Predictors of good clinical outcomes,mortality, and successful revascularizationin patients with acute ischemic strokeundergoing thrombectomy: pooled analysis ofthe Mechanical Embolus Removal in CerebralIschemia (MERCI) and Multi MERCI Trials. Stroke.2009;40:3777-3783.20 Davis SM, Donnan GA, Parsons MW, Levi C,Butcher KS, Peeters A, Barber PA, Bladin C, DeSilva DA, Byrnes G, Chalk JB, Fink JN, Kimber TE,Schultz D, Hand PJ, Frayne J, Hankey G, Muir K,Gerraty R, Tress BM, Desmond PM. Effects ofalteplase beyond 3 h after stroke in the EchoplanarImaging Thrombolytic Evaluation Trial(EPITHET): a placebo-controlled randomised trial.Lancet Neurol. 2008;7:299-309.21 Hacke W, Furlan AJ, Al-Rawi Y, Davalos A, FiebachJB, Gruber F, Kaste M, Lipka LJ, Pedraza S, RinglebPA, Rowley HA, Schneider D, Schwamm LH, LealJS, Sohngen M, Teal PA, Wilhelm-Ogunbiyi K, WintermarkM, Warach S. Intravenous desmoteplasein patients with acute ischaemic stroke selectedby MRI perfusion-diffusion weighted imaging orperfusion CT (DIAS-2): a prospective, randomised,double-blind, placebo-controlled study. LancetNeurol. 2009;8:141-150.22 Kidwell CS, Saver JL, Mattiello J, Starkman S,Vinuela F, Duckwiler G, Gobin YP, Jahan R, VespaP, Villablanca JP, Liebeskind DS, Woods RP, AlgerJR. Diffusion-perfusion MRI characterization ofpost-recanalization hyperperfusion in humans.Neurology. 2001;57:2015-2021.23 Gonzalez RG, Hakimelahi R, Schaefer PW, RoccatagliataL, Sorensen AG, Singhal AB. Stabilityof large diffusion/perfusion mismatch in anteriorcirculation strokes for 4 or more hours. BMCNeurol. 2010;10:13.24 Copen WA, Rezai Gharai L, Barak ER, SchwammLH, Wu O, Kamalian S, Gonzalez RG, SchaeferPW. Existence of the diffusion-perfusionmismatch within 24 hours after onset of acutestroke: dependence on proximal arterial occlusion.Radiology. 2009;250:878-886.25 Marchal G, Beaudouin V, Rioux P, de la Sayette V,Le Doze F, Viader F, Derlon JM, Baron JC. Prolongedpersistence of substantial volumes ofpotentially viable brain tissue after stroke: acorrelative PET-CT study with voxel-based dataanalysis. Stroke. 1996;27:599-606.26 Baron JC, Moseley ME. For how long is braintissue salvageable? Imaging-based evidence.J Stroke Cerebrovasc Dis. 2000;9:15-20.27 Rosen BR, Belliveau JW, Vevea JM, Brady TJ.Perfusion imaging with NMR contrast agents.Magn Reson Med. 1990;14:249-265.28 Ostergaard L, Weisskoff RM, Chesler DA, GyldenstedC, Rosen BR. High resolution measurementof cerebral blood flow using intravascular tracerbolus passages. Part I: Mathematical approach andstatistical analysis. Magn Reson Med.1996;36:715-72529 Ostergaard L, Chesler DA, Weisskoff RM, SorensenAG, Rosen BR. Modeling cerebral blood flowand flow heterogeneity from magnetic resonanceresidue data. J Cereb Blood Flow Metab.1999;19:690-699.30 Calamante F, Gadian DG, Connelly A. Delay anddispersion effects in dynamic susceptibility contrastMRI: simulations using singular value decomposition.Magn Reson Med. 2000;<strong>44</strong>:466-473.31 Calamante F, Gadian DG, Connelly A. Quantificationof perfusion using bolus tracking magneticresonance imaging in stroke: assumptions, limitations,and potential implications for clinicaluse. Stroke. 2002;33:1146-1151.32 Wu O, Ostergaard L, Koroshetz WJ, Schwamm LH,O'Donnell J, Schaefer PW, Rosen BR, WeisskoffRM, Sorensen AG. Effects of tracer arrival timeon flow estimates in MR perfusion-weightedimaging. Magn Reson Med. 2003;50:856-864.33 Wu O, Ostergaard L, Weisskoff RM, Benner T,Rosen BR, Sorensen AG. Tracer arrival timing-insensitivetechnique for estimating flow in MRperfusion-weighted imaging using singular valuedecomposition with a block-circulant deconvolutionmatrix. Magn Reson Med. 2003;50:164-174.34 Lorenz C, Benner T, Chen PJ, Lopez CJ, Ay H, ZhuMW, Menezes NM, Aronen H, Karonen J, Liu Y,Nuutinen J, Sorensen AG. Automated perfusionweightedMRI using localized arterial input functions.J Magn Reson Imaging. 2006;24:1133-1139.35 Ay H, Benner T, Arsava EM, Furie KL, Singhal AB,Jensen MB, Ayata C, Towfighi A, Smith EE,Chong JY, Koroshetz WJ, Sorensen AG. A computerizedalgorithm for etiologic classificationof ischemic stroke: the Causative Classificationof Stroke System. Stroke. 2007;38:2979-2984.36 Ay H, Koroshetz WJ, Vangel M, Benner T,Melinosky C, Zhu M, Menezes N, Lopez CJ,Sorensen AG. Conversion of ischemic braintissue into infarction increases with age. Stroke.2005;36:2632-2636.37 Menezes NM, Ay H, Wang Zhu M, Lopez CJ,Singhal AB, Karonen JO, Aronen HJ, Liu Y,Nuutinen J, Koroshetz WJ, Sorensen AG. Thereal estate factor: quantifying the impactof infarct location on stroke severity. Stroke.2007;38:194-197.38 Wu O, Ostergaard L, Weisskoff RM, Benner T,Rosen BR, Sorensen AG. Tracer arrival timinginsensitivetechnique for estimating flow inMR perfusion-weighted imaging using singularvalue decomposition with a block-circulantdeconvolution matrix. Magn Reson Med.2003;50(1):164-74.ContactOna Wu, PhDAthinoula A. Martinos Centerfor Biomedical Imaging149 Thirteenth Street, Suite 2301Charlestown, Massachusetts 02129USAPhone: +1617 643 3873Fax: +1617 643 3939ona@nmr.mgh.harvard.edu58 <strong>MAGNETOM</strong> <strong>Flash</strong> 2/2010 · www.siemens.com/magnetom-world<strong>MAGNETOM</strong> <strong>Flash</strong> · 2/2010 · www.siemens.com/magnetom-world 59
Clinical Abdomen/PelvisAbdomen/Pelvis ClinicalFunctional Prostate MR IncludingDynamic Contrast-EnhancedT1-Weighted Imaging at 1.5 TeslaWithout Endorectal Coil.First Clinical Experiences with a StudyProtocol at Multi-Imagem, Brazil1A1B1ELeonardo Kayat Bittencourt, M.D.; Thomas Doring, MSc; Marcio Bernardes, RT; Emerson Gasparetto, M.D., Ph.D.;Romeu Cortês Domingues, M.D.1C1DCDPI Clínica de Diagnóstico Por Imagem, Multi-Imagem, UFRJ - Federal University of Rio de Janeiro, Rio de Janeiro, BrazilIntroductionReviewing the current literature onprostate MR, most authors rely on theuse of 3T scanners that reveal betterdiagnostic and staging accuracy thanthe previous studies using older 1.5Tand 1.0T machines in the 90’s. However,in most countries 1.5T MR scannersare still more widely available than 3Tmachines. Looking at new developmentsin coil technology this new generationof 1.5 Tesla superconducting MR scannerspotentially provides an acceptableperformance on the management ofprostate cancer (PCa) patients.Moreover, the continuing improvementof functional sequences, namely diffusionweightedimaging (DWI) and dynamiccontrast enhancement (DCE) T1w imagingand the development of new postprocessingtools (i.e., image-fusion andpharmacokinetic maps) could furthercontribute on the diagnostic and stagingaccuracy of MRI including 1.5T MR scanners.Based on the literature, multi-modalimaging of the prostate at 1.5 Teslaincludes the usage of an endorectal coil.However, in clinical routine the applicationof such a coil can be restrictedby various reasons such as proctitis.However, it should also be taken intoaccount that the procedure of placing anendorectal coil can result in low acceptanceof the exam and potentially reducespatient compliance significantly. Thereforeit is of high clinical interest to betterunderstand the potential but also thelimitations of prostate MRI at 1.5 Teslawithout application of an endorectal coil.In this article, we describe in detail ourprostate MR protocol and post-processingparameters at 1.5 Tesla withoutendorectal coil with special focus on DCET1w imaging, and briefly present thepreliminary results, with illustrative cases.Table 1Materials and methodsThis protocol was developed in 2009,as part of an ongoing long-term prostateMR research project. The study wasapproved by the local Ethics and ResearchCommittee, and all patients signed aninformed consent.Thirteen consecutive patients were submittedto prostate MR examinations, priorto prostatectomy. Patients’ age rangedbetween 51 and 77 years (average 63years), their PSA levels varying between3.4 and 42.0 ng/mL (median 8.6 ng/mL).Examinations (table 1) were done on an18-channel 1.5T scanner (<strong>MAGNETOM</strong>Avanto, <strong>Siemens</strong> <strong>Healthcare</strong>, Erlangen,Feature Prostate MR HistopathologyUnilateral Involvement 3 2Bilateral Involvement 10 11Extra-prostatic extension 3 4Seminal Vesicle extension 1 1Positive Lymph <strong>No</strong>des 0 01 syngo Tissue 4D screen capture, depicting its four panels, with anatomical (T1w or T2w) images in 1A, (subtracted) image of dynamic dataset in 1B, parametric maps (K trans , Kep, Ve, iAUC) overlaid on anatomy in 1C, and relative enhancement curves in 1D. <strong>No</strong>te that the suspiciousT2w hypointense area in 1A (arrowhead) corresponds to the red ROI in 1B, the focally increased K trans area in 1C and early/intense enhancingcurve with washout in 1D.Germany), with a combination of the6-channel phased-array surface coil (BodyMatrix) combined with up to 6 elementsof the integrated spine coil. Prior to theexaminations, the patients were given10 mg of n-methil-scopolamine bromide(Buscopan®, Boehringer Ingelheim,Brazil), in order to attenuate peristalsis.The study protocol consisted of highresolutionT2-weighted turbo spin echo(TSE) sequences in the axial (TR 4750ms, TE 101 ms, no PAT, FOV (160 x 160)mm 2 , matrix (256 x 230) px 2 , slice thickness3 mm, no gap, 3 averages, acquisitiontime 5:47 min), coronal (TR 3000ms, TE 101 ms, no PAT, FOV (160 x 160)mm 2 , matrix (256 x 230) px 2 , slicethickness 3.5 mm, 20% gap, 2 averages,acquisition time 2:15 min) and sagittal(TR 3800 ms, TE 100 ms, no PAT, FOV(170 x 170) mm 2 , matrix (320 x 240)px 2 , slice thickness 3 mm, 10% gap,2 averages, acquisition time 3:21 min)planes, high-resolution axial dark fluidT1-weighted sequence (TIRM; TR 2100ms, TE 20 ms, TI 829.7 ms, PAT factor 2(syngo GRAPPA), FOV (200 x 180) mm 2 ,matrix (256 x 200) px 2 , slice thickness3 mm, 10% gap, 2 averages, acquisitiontime 3:09 min), DWI (syngo REVEAL) inthe axial plane (ep2d_diff; TR 3000 ms,TE 88 ms, b-values 0, 500, 1000 mm/s 2 ,3-scan trace, ADC map Inline, noise levelset to 0, PAT factor 2 (syngo GRAPPA),FOV (200 x 200) mm 2 , matrix (150 x 150)px 2 , slice thickness 3.5 mm, no gap,8 averages, acquisition time 2:57 min),thick-slice T2-weighted sequence inthe axial plane covering lymph nodestages from the renal veins down to thepubic bone (HASTE; TR 700 ms, TE 38ms, PAT factor 2 (syngo GRAPPA), FOV60 <strong>MAGNETOM</strong> <strong>Flash</strong> 2/2010 · www.siemens.com/magnetom-world <strong>MAGNETOM</strong> <strong>Flash</strong> · 2/2010 · www.siemens.com/magnetom-world 61
3AClinical Abdomen/PelvisCardiovascular Clinical2A 2B 2C2D2F* * * *(350 x 317) mm 2 , matrix (512 x <strong>44</strong>0) px 2(interpolated), slice thickness 5 mm,100% gap, 1 average, acquisition time0:30 min), and DCE T1w images acquiredwith a 3D gradient echo (GRE) sequences(VIBE; TR 4.08 ms, TE 1.43 ms, PAT factor2 (syngo GRAPPA), no fat saturation, FOV(280 x 280) mm 2 , matrix (192 x 192)px 2 , slice thickness 3 mm, 1 average,40 measurements, 6.8 seconds per measurement,total acquisition time 4:33min) (cubital intravenous application of0.2 mmol/kg of gadolinium-chelate(DOTAREM, Guerbet, Aulnay-sous-Bois,France) on an MR-compatible powerinjector (Injektron 82 MRT, Medtron,2E2GSaarbrücken, Germany) between the secondand third measurements). The wholeexamination took about 30 minutes.Recently, we also added multi-flip anglevolumetric T1w sequences (VIBE, sameparameters as above, 1 measurementeach, respectively 2º, 5º, 8º and 15º flipangle) prior to contrast injection, inorder to estimate the T1 value, so as toenable accurate transfer constant (k trans )calculation on DCE post-processing.DCE images were post-proccessed usinga work-in-progress package of the syngoTissue 4D application. The syngo Tissue4D applications allows pharmacokineticmodeling according to the Tofts-model2A–G Prostate cancer with ex-vivoand pathologic correlation.2A T2-weighted image2B ADC map2C Early arterial phase post-gadolinium2D K trans overlaid on T2w2E ADC map overlaid on T2w2F Ex-vivo prostatectomy specimen T2w MR2G Whole-mount processing of a similar sectionas of MR imaging. The suspicious lesion (arrowheads)on the right middle-third peripheral zoneis well depicted in all of the modalities, withgood correlation to the pathological specimen.*= Hyperplasia.including parameter calculations, namelytransfer constant (k trans ), volume constant(Kep), extra-cellular volume of distribution(Ve) and integral area under thecurve (iAUC). In addition, parametriccolor-maps can be generated and fusedover MR morphology to allow accurateand fast assessment of the prostate parenchyma,and also to enable accurate measurementsof pharmacokinetic parameterson suspected areas (Fig. 1). There isa built-in function to correct for movementbetween acquisition phases, whichwe use whenever required. The curvecalculation is based on the placement ofregions-of-interest (ROIs) (for evaluationof data, four ROIs were evaluated inour study: ROI 1: suspected lesion, ROI2: contralateral peripheral zone, ROI 3:ipsillateral central gland, ROI 4: contralateralcentral gland). For calculation ofparameters, the software requires inputby the user; pre-evaluation parametersused in this study are as follow: noiselevel: 20, MR protocol: T1 and Dynamic,Contrast agent: Dotarem, volume: variable.The volume-of-interest (VOI) isdefined by an elliptical area – drawn bythe user – which encompasses the wholeprostate volume. The parametric mapsare generated from the full VOI, usingthe Tofts-model. For this, an arterial inputfunction has to be selected; in most ofour patients, a “slow” arterial input functionhas been chosen. K trans and iAUCmaps are saved as DICOM series, for furtherpost-processing.Post-processed images are afterwardsoverlaid on transverse T2w images, usingsyngo 3D-FUSION® (<strong>Siemens</strong> <strong>Healthcare</strong>,Erlangen, Germany), using PET-Rainbowand Descending Red Ramp color look-uptables, respectively for the k trans and theADC map.For evaluation of findings within the studysetting, one reader (LKB, 5 years of experience,2 years on prostate MR) evaluatedall of the examinations and imagingfindings were registered on a dedicatedevaluation sheet. Focused on the evaluationof capsular penetration of prostatecancer for planning of radical prostatectomy,suspected lesions were characterizedby laterality (left x right x bilateral),presence of local extra-prostatic extensionand seminal vesicle involvement.Prostatectomy specimens were submittedto routine histopathological evaluation,except for one, submitted to wholemountprocessing.ResultsProstatectomy showed prostate adenocarcinomain all 13 cases, with Gleasongrades varying between 6 (3+3) and 9(4+5) (median 6).In all 13 cases the main tumor focus wascorrectly identified by MR imaging. Thelaterality of the lesion was correctly determinedby MR in 12 patients (sensitivity:90%, specificity: 100%), eleven of which3A–E Extra-prostatic extension.3A T2w image showing a nodular T2 hypointensearea on the left base (arrowheads),focally bulging the capsular contour.3B On the ADC map, there is restricteddiffusion on the same spot, but furtheranatomical information.3C Early arterial phase post-gadoliniumimage, depicting intense and earlyenhancement on the suspicious area(arrowheads).3D ADC map overlaid on T2w image,confirming good correlation with bothanatomical and functional findings.3E K trans map overlaid on T2w image, showingthat the focal permeability abnormalities(black arrowheads) extend outside the prostatecontour (white arrowhead), strengtheningthe suspicion for extra-prostatic extension.This was the only sequence that depictedabnormal findings outside of the prostateparenchyma, showing the importance ofmultimodality imaging on the evaluation ofprostate cancer.62 <strong>MAGNETOM</strong> <strong>Flash</strong> 2/2010 · www.siemens.com/magnetom-world <strong>MAGNETOM</strong> <strong>Flash</strong> · 2/2010 · www.siemens.com/magnetom-world 633B3C3D3E
Clinical Abdomen/PelvisAbdomen/Pelvis Clinical4A 4B4C 4D 4E4A–E Seminal vesicle involvement.4A Axial T2w image, showing a diffuselyT2 hypointense prostate parenchyma,which lowers the accuracy forfinding focal suspicious areas. There isalthough an overtly hypointense focusinvolving the proximal ejaculatoryducts (arrowheads), raising awarenessfor seminal vesicle extension.4B Coronal T2w image, nicely showingthe suspicious area, with clear involvementof both seminal vesicles.4C ADC map, showing restricteddiffusion on the same area.4D K trans map overlaid in T2w image, wherea focal area of increased permeability (lightblueROI) is seen, in keeping with the T2hypointense lesion seen in 4A, also showingquantitative data (red rectangle).4E The lesionenhancementcurve (red) isthe steeper, withtendency to forma plateau ratherthan to keep onincreasing.had bilateral tumors. There was onefalse negative, in a patient with bilateralinvolvement substaged as unilateraltumor by MR.Four patients had extra-prostatictumoral extension, three of them beingidentified by MR imaging (sensitivity:75%, specificity: 100%).Only one patient had seminal vesicletumoral invasion, also seen on MRimaging.<strong>No</strong> patient had tumor-positive pelviclymph nodes, neither was it suspectedby MR in any of them.DiscussionFunctional prostate MR imaging, includingDWI, DCE, and 3D multi-voxel spectroscopy,is largely turning into the mainstayin prostate cancer detection, stagingand follow-up. The results among variousinstitutions bear good to optimal correlationwith histopathology, dependingon the scanner’s field strength (1.5T x3.0T), the kind of coil employed (surfaceonly x surface + endorectal), and also thegold standard utilized (biopsy x routinehistopathology x whole-mount histopathology).In this context, there’s a tendency pointingtowards studies on 3T prostate MR,with the combination of surface andendorectal coils, compared with wholemounthistopathology, in order to ally themost recent technology with the highesttheoretical spatial resolution achievable.However, this approach creates a potentialdilemma for health care providers,public health authorities and general radiologydepartments, considering that PCais the most prevalent neoplasm in men,and the availability of 3T scanners worldwidestill does not match the demandfor diagnosis, staging and follow-up forthis condition. Despite the most recenttechnological advances, an alternativeshould be pursued for MR imaging ofPCa, that allies cost-effectiveness andscanner availability with acceptable diagnosticaccuracy, in order to extend thebenefits of the technique to the overallpopulation, which is still being managedbased on PSA and rectal exam alone.Also, the endorectal coil (ERC) is anotherbarrier to the acceptance of prostate MR.Although being of undisputedly betterperformance than surface coil alone ontumor localization, patient refusal dueto cultural identity is still a major issue,most notably in Latin and Asian/Arabiccountries. It requires specially trained personnelfor proper placement, and considerablyincreases table time, not to mentionthe deformation produced on theprostate, that compromises radiotherapyplanning and follow up studies. Particularlyin Brazil, there is also an economicalproblem, for the ERC, which is disposableand for one use only, is not reimbursedby any of the health insurancecompanies or the public health system.Giving those circumstances, and consideringthat our institutions are localizedin a developing country, we initiated along-term prospective research projectaiming to create a prostate MR protocolthat is feasible in most of the alreadyworldwide installed 1.5T scanners, withoutthe need of an endorectal coil or speciallytrained personnel, with optimizedtable time, and bearing acceptable diagnosticaccuracy for relevant stagingparameters, to be applied in large populationalstudies.We also believe that newer post-processingtools for functional sequences,producing parametric color maps andfusions of functional and anatomicimages, may further add to the diagnosticperformance and to the communicationof results to the referring physicians.Preliminary results indicate a promisingperformance of this protocol on presurgicalstaging of PCa. Further patients willbe included, and the upcoming resultswill be accordingly published.References1 Ross R, Harisinghani M. Prostate cancer imaging– what the urologic oncologist needs to know.Radiol Clin <strong>No</strong>rth Am 2006; <strong>44</strong>:711-722, viii.2 Somford DM, Futterer JJ, Hambrock T, BarentszJO. Diffusion and perfusion MR imaging of theprostate. Magn Reson Imaging Clin N Am 2008;16:685-695, ix.3 Jung JA, Coakley FV, Vigneron DB, et al. Prostatedepiction at endorectal MR spectroscopic imaging:investigation of a standardized evaluationsystem. Radiology 2004; 233:701-708.4 Futterer JJ, Heijmink SW, Scheenen TW, et al.Prostate cancer localization with dynamic contrastenhancedMR imaging and proton MR spectroscopicimaging. Radiology 2006; 241:<strong>44</strong>9-458.5 Bloch BN, Furman-Haran E, Helbich TH, et al.Prostate cancer: accurate determination of extracapsularextension with high-spatial-resolutiondynamic contrast-enhanced and T2-weightedMR imaging – initial results. Radiology 2007;245:176-185.6 Weinreb JC, Blume JD, Coakley FV, et al. Prostatecancer: sextant localization at MR imaging andMR spectroscopic imaging before prostatectomy– results of ACRIN prospective multi-institutionalclinicopathologic study. Radiology 2009;251:122-133.7 Langer DL, van der Kwast TH, Evans AJ,Plotkin A, Trachtenberg J, Wilson BC, Haider MA.Prostate tissue composition and MR measurements:investigating the relationships betweenADC, T2, K(trans), v(e), and corresponding histologicfeatures. Radiology. 2010 May;255(2):485-94.8 Turkbey B, Pinto PA, Mani H, Bernardo M, PangY, McKinney YL, Khurana K, Ravizzini GC, AlbertPS, Merino MJ, Choyke PL. Prostate cancer: valueof multiparametric MR imaging at 3 T for detection– histopathologic correlation. Radiology.2010 Apr;255(1):89-99.9 Groenendaal G, Moman MR, Korporaal JG, vanDiest PJ, van Vulpen M, Philippens ME, van derHeide UA. Validation of functional imaging withpathology for tumor delineation in the prostate.Radiother Oncol. 2010 Feb;94(2):145-50.10 Langer DL, van der Kwast TH, Evans AJ, TrachtenbergJ, Wilson BC, Haider MA. Prostate cancerdetection with multi-parametric MRI: logisticregression analysis of quantitative T2, diffusionweightedimaging, and dynamic contrast-enhancedMRI. J Magn Reson Imaging. 2009Aug;30(2):327-34.11 Franiel T, Lüdemann L, Rudolph B, Rehbein H,Stephan C, Taupitz M, Beyersdorff D. Prostate MRimaging: tissue characterization with pharmacokineticvolume and blood flow parameters andcorrelation with histologic parameters. Radiology.2009 Jul;252(1):101-8.12 Ren J, Huan Y, Wang H, Ge Y, Chang Y, Yin H,Sun L. Seminal vesicle invasion in prostate cancer:prediction with combined T2-weighted anddiffusion-weighted MR imaging. Eur Radiol.2009 Oct;19(10):2481-6.13 Fütterer JJ, Barentsz JO, Heijmink SW. Value of3-T magnetic resonance imaging in local stagingof prostate cancer. Top Magn Reson Imaging.2008 Dec;19(6):285-9.14 McMahon CJ, Bloch BN, Lenkinski RE, RofskyNM. Dynamic contrast-enhanced MR imaging inthe evaluation of patients with prostate cancer.Magn Reson Imaging Clin N Am. 2009May;17(2):363-83.ContactThomas DoeringMedical Physicist MRI, MScPost-processing LaboratoryCDPI & Multi-imagemRio de JaneiroBrazilTel. +55 21 2432 9194thomas.doring@gmail.comL. Kayat Bittencourt, M.D.CDPI & Multi-ImagemRio de JaneiroBrazillkayat@gmail.com64 <strong>MAGNETOM</strong> <strong>Flash</strong> 2/2010 · www.siemens.com/magnetom-world <strong>MAGNETOM</strong> <strong>Flash</strong> · 2/2010 · www.siemens.com/magnetom-world 65
100.62 cm/sec0.00 cm/secSubscription<strong>Siemens</strong> <strong>Healthcare</strong> PublicationsOur publications offer the latest information and background for every healthcarefield. From the hospital director to the radiological assistant – here, you can quickly findinformation relevant to your needs.Medical SolutionsInnovations and trendsin healthcare. Themagazine is designedespecially for membersof hospital management,administrationpersonnel, and headsof medical departments.eNewsRegister for theglobal <strong>Siemens</strong><strong>Healthcare</strong> Newsletteratwww.siemens.com/healthcare-eNewsto receive monthlyupdates on topicsthat interest you.<strong>MAGNETOM</strong> <strong>Flash</strong>The Magazine of MR<strong>Issue</strong> Number 2/2010<strong>CMR</strong> Edition<strong>No</strong>t for distribution in the US.Clinical<strong>CMR</strong> UpdatePage 6TWISTPage 41flowvortex4D Flow MRIPage 46How-I-do-itCD with S<strong>CMR</strong>RecommendedProtocolsPage 20emitterplaneLow-dose MRAPage 24velocity [m/s]AXIOM InnovationsEverything from the worldsof interventional radiology,cardiology, fluoroscopy,and radiography. This semiannualmagazine is primarilydesigned for physicians,physicists, researchers, andmedical technical personnel.<strong>44</strong><strong>MAGNETOM</strong> <strong>Flash</strong>Everything from the worldof magnetic resonanceimaging. The magazinepresents case reports,technology, product news,and application tips. It isprimarily designed forphysicians, physicists, andmedical technical personnel.SOMATOM SessionsEverything from the worldof computed tomography.With its innovations, clinicalapplications, and visions,this semiannual magazineis primarily designed forphysicians, physicists,researchers, and medicaltechnical personnel.For current and past issues and to order the magazines, please visit www.siemens.com/healthcare-magazine.66 <strong>MAGNETOM</strong> <strong>Flash</strong> 2/2010 · www.siemens.com/magnetom-world
Over already?ImprintMarket your<strong>MAGNETOM</strong> system… I was just getting comfortable!Experience the new 3T <strong>MAGNETOM</strong> VerioMRI — now available at ABC Imaging CenterComfort:Speed:A more relaxing experienceAn extra-large opening means it can comfortablyaccommodate patients of different shapes and sizesand can help reduce anxiety and claustrophobia.A quicker examExclusive Tim (Total imaging matrix) technologyhelps make exams faster.All the tools necessary to market your facilityto patients and referring physicians are waitingfor you in the Your <strong>MAGNETOM</strong> section onwww.siemens.com/magnetom-worldHere you will find everything you need frompatient pamphlets to advertisements, to trailersand press releases, postcards, posters, eventchecklists, high-resolution images and muchmore – ready for immediate use.Confidence:Detailed images for your doctorExtraordinary images with exceptional details —your doctors will have the information they needto help make a more confident diagnosis.Rest easy!<strong>No</strong>w available at ABC Imaging Center(000) 000-00004<strong>MAGNETOM</strong> <strong>Flash</strong> – Imprint© 2010 by <strong>Siemens</strong> AG, Berlin and Munich,All Rights ReservedPublisher:<strong>Siemens</strong> AGMedical SolutionsBusiness Unit Magnetic Resonance,Karl-Schall-Straße 6, D-91052 Erlangen,GermanyEditor-in-Chief: Dr. Matthias Lichy, M.D.(matthias.lichy@siemens.com)Associate Editor: Antje Hellwich(antje.hellwich@siemens.com)Editorial Board: Ph.D.; Okan Ekinci, M.D.;Ignacio Vallines, Ph.D.; Wellesley Were;Milind Dhamankar, M.D.; Michelle Kessler;Gary McNeal; Sunil Kumar, M.D.Production: <strong>No</strong>rbert Moser, <strong>Siemens</strong> AG,Medical SolutionsLayout: independent Medien-DesignWidenmayerstrasse 16, D-80538 MunichPrinters: Farbendruck Hofmann, Gewerbestraße 5,D-90579 Langenzenn, Printed in Germany<strong>MAGNETOM</strong> <strong>Flash</strong> is also availableon the internet:www.siemens.com/magnetom-world<strong>No</strong>te in accordance with § 33 Para.1 of theGerman Federal Data Protection Law: Despatch ismade using an address file which is maintainedwith the aid of an automated data processingsystem.<strong>MAGNETOM</strong> <strong>Flash</strong> with a total circulation of20,000 copies is sent free of charge to <strong>Siemens</strong>MR customers, qualified physicians, technologists,physicists and radiology departmentsthroughout the world. It includes reports in theEnglish language on magnetic resonance:diagnostic and therapeutic methods and theirapplication as well as results and experiencegained with corresponding systems and solutions.It introduces from case to case newprinciples and procedures and discusses theirclinical potential.The statements and views of the authors inthe individual contributions do not necessarilyreflect the opinion of the publisher.The information presented in these articles andcase reports is for illustration only and is notintended to be relied upon by the reader forinstruction as to the practice of medicine. Anyhealth care practitioner reading this informationis reminded that they must use their own learning,training and expertise in dealing with theirindividual patients. This material does not substitutefor that duty and is not intended by <strong>Siemens</strong>Medical Solutions to be used for any purposein that regard. The treating physician bears thesole responsibility for the diagnosis and treatmentof patients, including drugs and doses prescribedin connection with such use. The OperatingInstructions must always be strictly followedwhen operating the MR system. The sources forthe technical data are the corresponding datasheets. Results may vary.Partial reproduction in printed form of individualcontributions is permitted, provided the customarybibliographical data such as author’s nameand title of the contribution as well as year, issuenumber and pages of <strong>MAGNETOM</strong> <strong>Flash</strong> arenamed, but the editors request that two copiesbe sent to them. The written consent of theauthors and publisher is required for the completereprinting of an article.We welcome your questions and comments aboutthe editorial content of <strong>MAGNETOM</strong> <strong>Flash</strong>. Pleasecontact us at magnetomworld.med@siemens.com.Manuscripts as well as suggestions, proposalsand information are always welcome; they arecarefully examined and submitted to theeditorial board for attention. <strong>MAGNETOM</strong> <strong>Flash</strong>is not responsible for loss, damage, or anyother injury to unsolicited manuscripts or othermaterials. We reserve the right to edit forclarity, accuracy, and space. Include your name,address, and phone number and send to theeditors, address above.<strong>MAGNETOM</strong> <strong>Flash</strong> · 2/2010 · www.siemens.com/magnetom-world 67
<strong>MAGNETOM</strong> <strong>Flash</strong>The Magazine of MR<strong>Issue</strong> Number 2/2010<strong>CMR</strong> Edition<strong>No</strong>t for distribution in the US.Clinical<strong>CMR</strong> UpdatePage 6syngo TWISTPage 41flowvortex4D Flow MRIPage 46100.62 cm/secHow-I-do-itCD with S<strong>CMR</strong>RecommendedProtocolsPage 20emitterplaneLow-dose MRAPage 240.00 cm/secvelocity [m/s]4Please enter your business addressInstitutionDepartmentFunctionTitleNameStreetPostal CodeCityStateCountryMR system usedunsubscribe from info serviceYes, I consent to the above information being usedfor future contact regarding product updates and otherimportant news from <strong>Siemens</strong>.E-mailthe monthly e-NewsletterPlease print clearly!Stay up to date with the latest informationRegister for:AXIOM InnovationsSOMATOM Sessions<strong>MAGNETOM</strong> <strong>Flash</strong>Medical SolutionsPlease include me in your mailing list for thefollowing <strong>Siemens</strong> <strong>Healthcare</strong> customer magazine(s):Subscription
k Visit www.siemens.com/magnetom-worldfor case reports,clinical methods,application tips,talks and much moreclinical information.SUBSCRIBE NOW!– and get your free copy of future<strong>MAGNETOM</strong> <strong>Flash</strong>! Interesting information fromthe world of magnetic resonance – gratis to yourdesk. Send us this postcard, or subscribe online atwww.siemens.com/<strong>MAGNETOM</strong>-World<strong>MAGNETOM</strong><strong>Flash</strong><strong>MAGNETOM</strong> <strong>Flash</strong>The Magazine of MR<strong>Issue</strong> Number 2/2010<strong>CMR</strong> Edition<strong>No</strong>t for distribution in the US.Clinical<strong>CMR</strong> UpdatePage 6flowsyngo TWISTvortexPage 414D Flow MRIPage 46100.62 cm/secHow-I-do-itemitterCD with S<strong>CMR</strong>planeRecommendedProtocolsPage 20Low-dose MRAPage 240.00 cm/secvelocity [m/s]<strong>44</strong><strong>Siemens</strong> AGMedical SolutionsMagnetic ResonanceAntje Hellwich - MarketingP.O. Box 32 60D-91050 ErlangenGermany
Global <strong>Siemens</strong> Headquarters<strong>Siemens</strong> AGWittelsbacherplatz 280333 MuenchenGermanyGlobal <strong>Siemens</strong><strong>Healthcare</strong> Headquarters<strong>Siemens</strong> AG<strong>Healthcare</strong> SectorHenkestr. 12791052 ErlangenGermanyPhone: +49 9131 84-0www.siemens.com/healthcarewww.siemens.com/healthcare-magazineOrder <strong>No</strong>. A91MR-1000-75C-7600 | Printed in Germany | CC MR 01000 ZS 101015. | © 10.10, <strong>Siemens</strong> AGOn account of certain regional limitations ofsales rights and service availability, we cannotguarantee that all products included in thisbrochure are available through the <strong>Siemens</strong>sales organization worldwide. Availability andpackaging may vary by country and is subjectto change without prior notice. Some/All ofthe features and products described herein maynot be available in the United States.The information in this document containsgeneral technical descriptions of specificationsand options as well as standard and optionalfeatures which do not always have to be presentin individual cases.<strong>Siemens</strong> reserves the right to modify the design,packaging, specifications and options describedherein without prior notice.Please contact your local <strong>Siemens</strong> salesrepresentative for the most current information.<strong>No</strong>te: Any technical data contained in thisdocument may vary within defined tolerances.Original images always lose a certain amountof detail when reproduced.Global Business Unit<strong>Siemens</strong> AGMedical SolutionsMagnetic ResonanceHenkestr. 127DE-91052 ErlangenGermanyPhone: +49 9131 84-0www.siemens.com/healthcareLocal Contact InformationIn Asia<strong>Siemens</strong> Pte LtdThe <strong>Siemens</strong> Center60 MacPherson RoadSingapore 348615Phone: +65 6490-8096In Canada<strong>Siemens</strong> Canada LimitedMedical Solutions2185 Derry Road WestMississauga ON L5N 7A6CanadaPhone: +1 905 819-5800Europe/Africa/Middle East<strong>Siemens</strong> AGMedical SolutionsHenkestr. 12791052 ErlangenGermanyPhone: +49 9131 84-0USA:<strong>Siemens</strong> Medical Solutions U.S.A., Inc.51 Valley Stream ParkwayMalvern, PA 19355-1406USAPhone: +1-888-826-9702Latin America<strong>Siemens</strong> S.A.Medical SolutionsAvenida de Pte. Julio A. Roca <strong>No</strong> 516,Piso 7C1067ABN Buenos AiresArgentinaPhone: +54 11 4340-8400

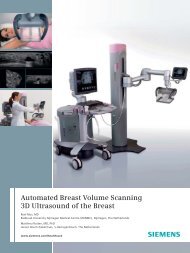
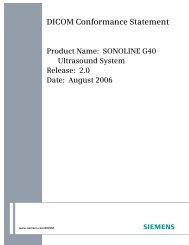
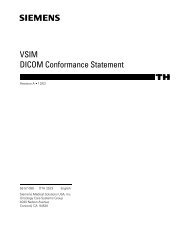

![WalkAway plus Technical Specifications [41 KB] - Siemens Healthcare](https://img.yumpu.com/51018135/1/190x253/walkaway-plus-technical-specifications-41-kb-siemens-healthcare.jpg?quality=85)