vuosikirja / yearbook 2007 â 2008 - Suomen pääomasijoitusyhdistys ry
vuosikirja / yearbook 2007 â 2008 - Suomen pääomasijoitusyhdistys ry
vuosikirja / yearbook 2007 â 2008 - Suomen pääomasijoitusyhdistys ry
- No tags were found...

You also want an ePaper? Increase the reach of your titles
YUMPU automatically turns print PDFs into web optimized ePapers that Google loves.
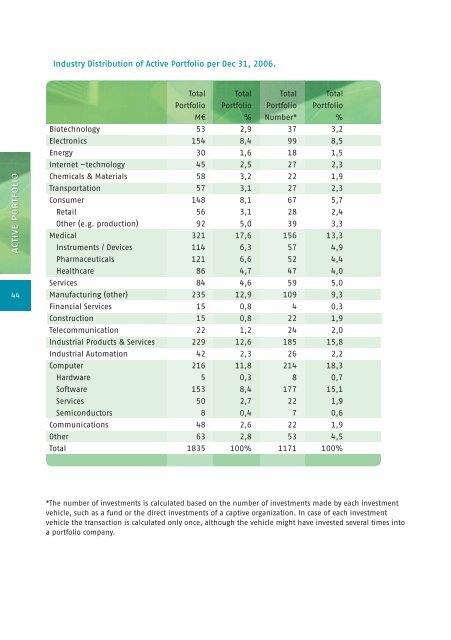
Indust<strong>ry</strong> Distribution of Active Portfolio per Dec 31, 2006.TotalPortfolioTotalPortfolioTotalPortfolioTotalPortfolioM€%Number*%Biotechnology532,9373,2Electronics1548,4998,5Energy301,6181,5Internet –technology452,5272,3active portfolioChemicals & MaterialsTransportationConsumerRetailOther (e.g. production)MedicalInstruments / Devices585714856923211143,23,18,13,15,017,66,32227672839156571,92,35,72,43,313,34,9Pharmaceuticals1216,6524,4Healthcare864,7474,0Services844,6595,044Manufacturing (other)23512,91099,3Financial Services150,840,3Construction150,8221,9Telecommunication221,2242,0Industrial Products & Services22912,618515,8Industrial Automation422,3262,2Computer21611,821418,3Hardware50,380,7Software1538,417715,1Services502,7221,9Semiconductors80,470,6Communications482,6221,9Other632,8534,5Total1835100%1171100%*The number of investments is calculated based on the number of investments made by each investmentvehicle, such as a fund or the direct investments of a captive organization. In case of each investmentvehicle the transaction is calculated only once, although the vehicle might have invested several times intoa portfolio company.