2009 Introduction - Mediobanca Ricerche e Studi S.p.A.
2009 Introduction - Mediobanca Ricerche e Studi S.p.A.
2009 Introduction - Mediobanca Ricerche e Studi S.p.A.

You also want an ePaper? Increase the reach of your titles
YUMPU automatically turns print PDFs into web optimized ePapers that Google loves.
FINANCIAL AGGREGATES FOR2022 ITALIAN COMPANIES(<strong>2009</strong>)
FINANCIAL AGGREGATES FOR2022 SELECTED COMPANIES1999-2008Excerpt in English from‘‘DATI CUMULATIVI DI2022 SOCIETÀ ITALIANE’’Copyright <strong>2009</strong> by <strong>Mediobanca</strong> Research DepartmentPiazzetta Maurilio Bossi, 1 - Milan, Italy - Tel. +39 2 8829.1Internet: http://www.mbres.itE-mail: ufficio.studi@mediobanca.ita MEDIOBANCA publicationIV. V.
This survey provides data for 2,022 large and medium-size Italian companiesoperating in the manufacturing and services sectors and covers the ten-year periodfrom 1999 to 2008. Their share of aggregate sales by Italian enterprises with over 20staff on their books as recorded by the Italian Statistics Office ISTAT in 2005 ( 1 ), is asfollows: 48% for industry, 66% for public services, 32% for transport, and 22% forretailing. In manufacturing industry the share is equal to 43% of sales, 51% of exports,31% of employment and 46% of fixed assets. It is believed that virtually all the Italiancompanies with over 500 staff are included in this survey, along with a significantproportion of the country’s medium-sized corporates.Individual groups of tables analysing balance-sheet data (Table I), additionalinformation (Table II), and profit-and-loss figures (Table III) provide statistics forthe following sets of aggregates: all 2,022 companies; all companies broken down byrecord of profitability, loss-making and mixed results; ownership structure (public orprivate sector, non-Italian-owned); medium-sized companies; manufacturing andservice industries; and lastly, sector of operation. A diagram providing an overviewof the various breakdowns is provided at the end of this report to facilitate interpretationof the tables, plus the ATECO 2007 codes (Italian version of NACE Rev. 2 codes)used to classify companies in the various sectors. As usual, the companies concernedprovided assistance in collating the financial data and additional information. Themethodological criteria adopted are set out in the appendix.To ensure the aggregate figures form a basis for like-for-like comparison over theperiod under review, these have been compiled using a ‘‘closed’’ number of firmshaving the status of ‘‘functioning’’ companies (see Table 1). For the same reason,the ownership structure (public or private sector, non-Italian-owned) has also beenkept constant, referring to the situation outstanding as at year-end 2008. Also forreasons of maintaining a like-for-like comparison basis, ENI’s primary gasdistribution business, which was subject to a wide-ranging corporate reorganizationin 2002, has continued to be included in the energy sector. Medium-sized enterpriseshave been defined in accordance with the same criteria as adopted in the <strong>Mediobanca</strong>-Unioncamere survey of such businesses ( 2 ).(1) Company Accounts for 2005 (Rome, <strong>2009</strong>). Data refers to approx. 45,000 industrial companiesand around 34,000 businesses in the tertiary sector.(2) Italian Medium-Size Businesses (annual survey). These are defined as companies not owned bylarge groups, whose headcount in 2008 numbered less than 500 staff and with turnover notexceeding A330m.VI.VII.
The statistics contained in this edition are also available on our website(www.mbres.it), along with some additional tables, plus historical data going back to1968 until 2002 for a restricted group of businesses based on the following criteria:— statistics for all companies from 1968 to 2002: these cover a group of 980 largeand medium-sized companies, with a breakdown for 140 medium-sizedcompanies;— statistics for private-sector companies and public-sector companies: in order toensure that the figures form a like-for-like basis for comparison, the timeframe hasbeen divided into four separate periods, each of them including common years atthe start and the end of the series, making it possible to prepare interconnectedindexes:– 1968-1992: data refer to 970 private-sector and 234 public-sector companies;– 1992-1994: data refer to 908 private-sector and 199 public-sector companies,the changes being due to various privatizations under a government programmeto sell off state holdings, and the failure by certain companies to provideupdated figures, which has led to their being excluded from the survey;– 1994-1997: 856 private-sector and 141 public-sector companies, the mostsignificant changes here relating to privatization of state-owned steelcompanies, and the exclusion of other companies due to data not beingavailable;– 1997-2002: 888 private-sector and 92 public-sector companies, the mostimportant change here relating to the privatization of telecommunicationscompanies owned by the IRI group.It should also be noted that the transport sector aggregates are not fully comparablein some of the editions, as Ferrovie dello Stato and Alitalia are treated differently inthem. Ferrovie dello Stato was transformed from a state-owned entity to a limitedcompany in 1992, and has been included in the survey since the 2005 edition (1995-2004 data). The Italian national airline was included until the last edition, but has beenleft out this year since being placed into extraordinary liquidation in August 2008.VIII.IX.
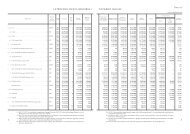
TABLE 1ANNUAL CHANGES IN NUMBER OF SELECTED COMPANIESADDITIONS(Companiesincorporatedin year)REDUCTIONS(Mergers)NUMBERAT YEAR-END1999 ......................................... — — 20902000 ......................................... 85 – 72 21032001 ......................................... 87 – 54 21362002 ......................................... 62 – 80 21182003 ......................................... 52 – 68 21022004 ......................................... 45 – 61 20862005 ......................................... 55 – 53 20882006 ......................................... 42 – 62 20682007 ......................................... 37 – 54 20512008 ......................................... 38 – 67 2022503 – 571N.B. - 182 companies have been added and 180 deleted since last year’s edition. Of the latter, 67 have been merged into otherselected companies, 3 into companies not in the aggregate, 30 have gone into bankruptcy proceedings, 3 have ceased trading, 1 due tohaving changed its corporate purpose and 76 failed to provide their figures in time for inclusion.TABLE 2AGGREGATE GROWTH INDICES2004 2005 2006 2007 2008% % % % %CHANGE IN NET SALES ......................... + 8.0 + 7.4 +10.1 + 4.7 + 6.0of which:domestic sales ............................. + 7.5 + 6.9 + 8.5 + 2.2 + 5.5exports ..................................... + 9.7 + 8.9 +14.7 +11.5 + 7.4INCREASES IN GROSS FIXED ASSETS ( 1 ) ......... + 4.8 + 5.2 + 3.2 + 4.4 + 3.8DECREASE IN NUMBER OF EMPLOYEES ........ – 0.8 – 0.3 — + 0.2 – 0.7(1) Excluding monetary revaluations pursuant to Laws 342/00, 448/01, 350/03, 266/05 and 2/09, write-ups arising from assettransfers between companies. The change in 2006 has been calculated excluding the effect of the transaction referred to on page 4,note 1.XXXIV.XXXV.
TABLE 3TABLE 4GROWTH INDICES BY INDUSTRY 2005/2008(Percentage changes)ANNUAL CHANGES IN VALUE ADDEDNETSALESGROSS FIXEDASSETS ( 1 )NUMBER OFEMPLOYEES% Rank % Rank % Rank(05/08) (07/08) (05/08) (07/08)PROCESS ENGINEERING ............. 62.1 6.4 1 5 43.3 1 9.3 4ENERGY ............................. 43.4 21.6 2 1 13.1 9 –7.0 20IRON AND STEEL .................... 41.8 –0.3 3 17 25.6 4 –1.5 11VEHICLES ........................... 32.7 0.3 4 14 23.6 5 5.2 6LEATHERWEAR .....................MECHANICAL ENGINEERING ........26.622.43.82.7569106.112.2211110.53.637CONFECTIONERY. ...................TRANSPORTS ........................22.019.79.23.8782818.48.46171.8–5.9916CLOTHING. ..........................RETAILING ..........................18.818.81.65.791012718.227.2737.313.252RUBBER AND CABLES. ..............BUILDING AND CIVIL ENGINEERING15.815.4–2.87.311121944.041.1222–9.845.5251DAIRY PRODUCTS ................... 13.4 6.3 13 6 16.0 8 –6.3 18TIMBER AND FURNISHING .......... 10.5 –4.2 14 21 12.8 10 3.4 8CONSERVES MANUFACTURES ....... 9.1 7.5 15 3 6.8 20 –1.8 12PAPER ............................... 8.8 –1.1 16 18 8.1 18 –6.7 19PHARMACEUTICALS AND COSME-TICS ..............................WINES, SPIRITS AND BEVERAGES ...8.85.81.7—1718111610.37.41419–4.30.61410CHEMICALS .........................BUILDING MATERIALS ..............3.3—–4.2–6.1192020239.411.01613–6.0–4.31715PUBLIC UTILITIES ...................ELECTRONICS .......................–0.3–1.10.2–4.52122152210.1–2.41524–8.8–7.62322RADIO, TV AND DOMESTIC AP-PLIANCES. ........................GLASS ...............................–1.8–3.6–7.50.623242613–4.01.12523–9.4–3.22413PRINTING AND PUBLISHING .........TEXTILES ...........................–7.8–8.9–6.5–6.72526242511.1–7.81227–7.2–14.22126MAN-MADE FIBRES. ................. –10.0 –14.1 27 27 –5.4 26 –15.0 272022 COMPANIES .................. 22.2 6.0 11.8 –0.5PUBLIC SECTOR COMPANIES ........PRIVATE SECTOR COMPANIES ......37.018.017.92.610.313.1–5.91.0MEDIUM -SIZE COMPANIES. .........MANUFACTURING COMPANIES. .....21.325.32.56.716.512.91.4–0.2SERVICE COMPANIES ...............NON-ITALIAN-OWNED COMPANIES. .7.914.62.42.410.414.3–1.2–2.12000 2001 2002 2003 2004 2005 2006 2007 2008% % % % % % % % %CHEMICALS .......................ENERGY ...........................11.78.7–13.41.93.1–15.50.112.98.86.4–8.52.0–4.4–0.113.43.2–19.7–7.0IRON AND STEEL .................. 15.1 –9.7 –6.4 6.4 28.8 9.8 13.7 16.2 –14.2BASIC INDUSTRIES .............. 10.0 –1.8 –12.1 10.1 9.6 1.8 1.7 6.7 –9.9FOOD .............................. 1.9 3.0 4.9 5.3 –0.8 –1.9 –2.0 0.1 3.3PAPER .............................VEHICLES .........................–3.112.213.5–15.8–3.6–19.5–5.518.9–2.31.4–3.07.9–10.224.33.112.7–4.2–7.5RADIO, TV AND DOMESTIC AP-PLIANCES .......................ELECTRONICS .....................1.114.9–4.64.03.1–6.2–1.6–0.82.67.9–8.7–3.21.8–1.93.03.9–5.4–1.1PHARMACEUTICALS AND COSME-TICS ............................ 9.1 7.9 5.6 –0.3 0.5 2.2 2.8 2.1 –0.4MAN-MADE FIBRES ................RUBBER AND CABLES .............12.90.3–7.8–3.9–17.30.2–15.2–6.42.111.7–5.8–1.72.35.64.14.9–31.5–16.5PROCESS ENGINEERING ........... 10.0 18.1 1.3 6.0 –10.4 16.3 8.4 17.8 10.7BUILDING AND CIVIL ENGINEE-RING ............................TIMBER AND FURNISHING .........–10.418.117.5–2.02.71.39.4–8.73.411.88.12.919.36.31.53.79.2–10.3MECHANICAL ENGINEERING ...... 9.4 0.4 0.7 2.1 6.2 2.6 6.7 9.1 1.1LEATHERWEAR .................... 27.4 14.9 –4.5 –3.1 13.2 8.7 12.5 0.6 1.9BUILDING MATERIALS ............ 10.9 5.2 8.0 0.8 –0.1 –6.8 6.0 –2.6 –14.8PRINTING AND PUBLISHING .......TEXTILES AND CLOTHING .........7.64.3–3.63.45.3–2.01.7–4.12.6–0.3–0.23.1–1.04.51.08.4–8.8–4.7GLASS ............................. 8.3 9.4 –3.1 –6.2 –0.7 2.6 –4.7 0.3 0.7OTHER MANUFACTURING COM-PANIES ........................ 8.0 1.1 –1.1 2.4 2.6 1.3 6.2 5.4 –2.5MANUFACTURING COMPANIES .. 8.7 –0.1 –5.2 5.1 5.1 1.5 4.5 5.9 –5.3RETAILING ........................PUBLIC UTILITIES .................7.54.511.08.68.47.05.39.36.65.22.6–1.68.12.07.9–4.00.8–0.2TRANSPORTS ...................... 10.9 7.4 –0.7 –10.3 27.0 –7.2 –12.6 17.6 6.5SERVICE COMPANIES ............ 6.1 8.5 5.5 5.1 8.3 –2.0 — 0.6 1.22022 COMPANIES .................PUBLIC SECTOR COMPANIES ......8.012.12.4–1.0–2.0–8.65.14.86.17.70.3–4.13.0–1.54.39.1–3.3–4.7PRIVATE SECTOR COMPANIES .....MEDIUM-SIZE COMPANIES .........6.46.03.74.10.62.45.21.65.64.82.00.34.66.12.76.8–2.9–1.4NON-ITALIAN-OWNED COMPANIES 10.4 12.1 1.8 5.4 6.5 4.2 2.2 3.9 –1.7N.B. - The indices may also be affected by transfers of businesses to and from companies operating in different industries.(1) Net of revaluations pursuant to Laws 342/00, 448/01, 350/03, 266/05 and 2/09 and gains arising on transfer, but gross ofdepreciation/amortization. The change has been calculated excluding the effect of the transaction referred to on page 4, note 1.XXXVI.XXXVII.
TABLE 5TABLE 7NET PROFIT (LOSS)2008 2007INCREASE(DECREASE)2008-2007NET SALES AS A PERCENTAGE OF GROSS TANGIBLE FIXED ASSETSPROFITS LOSSES PROFITS LOSSES PROFITS LOSSESNo. ofcompaniesA mNo. ofcompaniesA mNo. ofcompaniesA mNo. ofcompaniesA mA m1999 2000 2001 2002 2003 2004 2005 2006 2007 2008% % % % % % % % % %2022 COMPANIES .................. 1437 34,646 585 8,383 1563 36,692 488 5,387 (2,046) 2,996152 PUBLIC SECTOR COMPANIES 129 14,142 23 1,182 102 13,745 50 1,283 397 (101)1870 PRIVATE SECTOR COMPANIES 1308 20,504 562 7,201 1461 22,947 438 4,104 (2,443) 3,097600 MEDIUM-SIZE COMPANIES ... 453 1,215 147 534 481 1,298 116 174 (83) 3601796 MANUFACTURING COMPANIES 1254 28,640 542 6,509 1402 29,556 419 4,461 (916) 2,048226 SERVICE COMPANIES ........ 183 6,006 43 1,874 161 7,136 69 926 (1,130) 948563 NON-ITALIAN-OWNED COMPANIES 344 7,093 219 3,466 405 7,408 181 1,510 (315) 1,9562022 COMPANIES ( 1 ) ............ 86.1 101.7 103.9 99.0 100.3 103.4 105.6 115.5 115.9 118.4COMPANIES CONSISTENTLY INPROFIT OR BREAKING EVEN .. 81.5 95.5 107.6 104.2 111.1 116.8 125.9 133.2 132.4 137.8COMPANIES CONSISTENTLYINCURRING LOSSES ........... 111.8 149.0 149.5 134.5 131.7 136.6 137.0 144.1 150.9 141.9COMPANIES WITH MIXED RECORDS ( 1 ) 89.0 105.6 100.3 95.2 93.5 95.3 94.3 105.1 106.0 106.5PUBLIC SECTOR COMPANIES ( 1 ) 34.2 45.9 49.0 44.2 43.5 47.1 50.5 59.0 58.2 66.4EARNINGS STRUCTURE: A PERCENTAGE ANALYSISTABLE 6PRIVATE SECTOR COMPANIES ... 134.6 153.9 148.7 144.0 148.1 151.4 153.2 161.8 162.5 159.9MEDIUM-SIZE COMPANIES ....... 209.2 218.7 219.1 208.5 202.3 204.7 200.8 209.0 215.3 209.12022COMPANIESPUBLICSECTORCOMPANIESPRIVATESECTORCOMPANIESMEDIUM-SIZECOMPANIESMANUFAC-TURINGCOMPANIESSERVICECOMPANIESNON-ITALIAN-OWNEDCOMPANIES2007 2008 2007 2008 2007 2008 2007 2008 2007 2008 2007 2008 2007 2008% % % % % % % % % % % % % %NET SALES ............ 100.0 100.0 100.0 100.0 100.0 100.0 100.0 100.0 100.0 100.0 100.0 100.0 100.0 100.0OTHER OPERATINGREVENUES. ......... 3.8 4.2 6.5 7.6 2.9 3.0 1.7 1.7 3.2 3.6 6.7 7.2 3.7 3.9MANUFACTURING COMPANIES:– including energy companies 117.2 139.3 145.0 138.9 140.4 147.7 153.6 165.7 166.7 170.5– excluding energy companies 177.2 203.3 200.2 195.2 193.9 198.4 198.3 210.5 216.1 207.1SERVICE COMPANIES ( 1 ) ......... 38.9 44.2 46.2 44.4 46.0 45.5 43.6 46.3 45.5 45.2NON-ITALIAN-OWNED COMPANIES 211.2 227.7 204.7 194.8 195.6 199.2 204.1 212.9 208.8 204.6CONSUMABLE ANDSUNDRY OPERATINGCOSTS .............. –80.7 –83.1 –80.2 –86.4 –80.7 –82.0 –82.8 –83.6 –83.8 –86.4 –64.8 –65.8 –81.6 –82.7VALUE ADDED ........ 23.1 21.1 26.3 21.2 22.2 21.0 18.9 18.1 19.4 17.2 41.9 41.4 22.1 21.2LABOUR COST. ........ –10.8 –10.4 –11.4 –9.6 –10.6 –10.6 –10.6 –10.6 –9.5 –9.0 –17.4 –17.5 –10.7 –10.6GROSS OPERATINGMARGIN ............ 12.3 10.7 14.9 11.6 11.6 10.4 8.3 7.5 9.9 8.2 24.5 23.9 11.4 10.6DEPRECIATION ANDAMORTISATION .... –4.9 –4.7 –5.6 –4.8 –4.8 –4.7 –3.1 –3.0 –3.7 –3.5 –11.2 –11.2 –4.9 –4.7OPERATING MARGIN .. 7.4 6.0 9.3 6.8 6.8 5.7 5.2 4.5 6.2 4.7 13.3 12.7 6.5 5.9INTEREST CHARGES LESSINTEREST INCOME.... 0.3 0.2 2.5 2.5 –0.2 –0.6 –0.9 –0.9 1.1 1.0 –3.4 –3.8 –0.4 –0.6PROFIT (LOSS) BEFORETAX.................... 7.7 6.2 11.8 9.3 6.6 5.1 4.3 3.6 7.3 5.7 9.9 8.9 6.1 5.3N.B. - Excluding monetary revaluations pursuant to Laws 342/00, 448/01, 350/03, 266/05 and 2/09, write-ups arising from assettransfers between companies.(1) The change in 2006 is influenced by the transaction referred to on page 4, note 1.XXXVIII.XXXIX.
AVERAGE DEPRECIATION RATESAVERAGE DEPRECIATION RATES2007 2008AVERAGE1999/2008TABLE 8PERCENTAGEOF TANGIBLEFIXED ASSETSDEPRECIATEDAT END-2008(ordinary only)% % % % %2022 COMPANIES ....................... 3.9 3.7 4.8 4.7 54.3COMPANIES CONSISTENTLY IN PROFIT .. 3.9 3.6 5.0 4.7 56.3COMPANIES CONSISTENTLY INCURRINGLOSSES ............................... 5.0 4.5 5.6 5.6 73.1COMPANIES WITH MIXED RECORDS ..... 3.9 3.7 4.7 4.7 53.0PUBLIC SECTOR COMPANIES ............ 2.4 2.4 3.5 3.4 44.9PRIVATE SECTOR COMPANIES ........... 5.2 4.8 6.0 5.9 62.5MEDIUM-SIZE COMPANIES ............... 4.8 4.1 5.7 5.6 59.4MANUFACTURING COMPANIES .......... 4.4 4.1 5.5 5.3 59.5SERVICE COMPANIES .................... 3.1 3.1 3.9 3.9 47.1NON-ITALIAN-OWNED COMPANIES ....... 6.0 5.6 7.0 6.8 62.0INTEREST CHARGESTOTAL INTERESTCHARGES ( 1 )A mAveragecost offunding%TABLE 9INTEREST CHARGES LESSINTEREST INCOMEA mAs % ofNOM2022 COMPANIES2004 ...................................... 10,808 5.1 (1,692) –4.62005 ...................................... 13,267 5.8 (413) –1.12006 ...................................... 14,052 5.9 3,122 7.92007 ...................................... 18,887 7.3 2,122 4.82008 ...................................... 21,883 7.5 1,085 2.8PUBLIC SECTOR COMPANIES2004 ...................................... 2,647 4.8 747 6.82005 ...................................... 3,559 5.9 1,882 17.92006 ...................................... 3,412 5.6 3.422 37.12007 ...................................... 6,447 8.3 3,184 25.42008 ...................................... 7,162 6.9 3,471 31.9PRIVATE SECTOR COMPANIES2004 ...................................... 8,161 5.2 (2,439) –9.42005 ...................................... 9,708 5.8 (2,295) –8.42006 ...................................... 10,640 6.1 (300) –1.02007 ...................................... 12,440 6.9 (1,062) –3.32008 ...................................... 14,721 7.8 (2,386) –8.7MEDIUM-SIZE COMPANIES2004 ...................................... 452 4.5 (200) –13.12005 ...................................... 467 4.5 (195) –13.12006 ...................................... 512 4.7 (157) –8.72007 ...................................... 648 5.7 (283) –13.52008 ...................................... 757 6.3 (344) –18.4MANUFACTURING COMPANIES2004 ...................................... 6,550 5.1 991 4.12005 ...................................... 7,659 6.1 2,858 11.62006 ...................................... 8,549 6.6 5,887 22.02007 ...................................... 12,856 8.2 5,481 17.62008 ...................................... 15,307 8.2 5,010 19.8SERVICE COMPANIES2004 ...................................... 4,258 5.0 (2,683) –20.92005 ...................................... 5,608 5.5 (3,271) –25.02006 ...................................... 5,503 5.1 (2,765) –21.32007 ...................................... 6,031 5.9 (3,359) –25.52008 ...................................... 6,576 6.4 (3,925) –30.3NON-ITALIAN-OWNED COMPANIES2004 ...................................... 2,182 4.9 (989) –11.72005 ...................................... 2,490 5.5 (427) –4.32006 ...................................... 2,750 6.2 (290) –2.82007 ...................................... 3,377 7.1 (940) –8.02008 ...................................... 3,755 7.5 (996) –9.2N.B. - NOM = Net operating margin.(1) Excludes exchange gains and losses.XL.XLI.
TABLE 10CAPITALEXPENDITURECAPITAL EXPENDITURE AT CONSTANT PRICES ( 1 )DISPOSALS AS A PERCENTAGE OF CAPITAL EXPENDITURETotalPublicsectorPrivatesectorServicesMediumsizeManufacturingNon-ItalianownedcompaniesTotal( 2 )Publicsector( 2 )PrivatesectorServices( 2 )MediumsizeManufacturingNon-ItalianownedcompaniesA m1999 ................................ 27,850 9,843 18,007 1,161 16,922 10,928 6,317Index number ................... 100.0 100.0 100.0 100.0 100.0 100.0 100.02000 ................................ 29,921 10,942 18,979 1,276 17,290 12,631 6,792Index number ................... 107.4 111.2 105.4 109.9 102.2 115.6 107.52001 ................................ 31,242 11,219 20,023 1,240 17,996 13,246 7,758Index number ................... 112.2 114.0 111.2 106.8 106.3 121.2 122.82002 ................................ 31,008 12,456 18,552 1,310 17,569 13,439 7,259Index number ................... 111.3 126.5 103.0 112.9 103.8 123.0 114.92003 ................................ 29,772 13,318 16,454 1,220 16,084 13,688 5,712Index number ................... 106.9 135.3 91.4 105.1 95.0 125.2 90.42004 ................................ 31,434 15,182 16,252 1,125 16,644 14,790 5,542Index number ................... 112.9 154.2 90.3 96.9 98.4 135.3 87.72005 ................................ 30,525 13,939 16,586 1,166 16,217 14,308 5,410Index number ................... 109.6 141.6 92.1 100.4 95.8 130.9 85.62006 ................................ 27,312 9,547 17,765 1,321 17,054 10,258 5,468Index number ................... 98.1 97.0 98.7 113.7 100.8 93.9 86.62007 ................................ 28,796 9,472 19,324 1,387 17,868 10,928 5,536Index number ................... 103.4 96.2 107.3 119.4 105.6 100.0 87.62008 ................................ 28,939 9,772 19,167 1,391 18,908 10,031 5,582Index number ................... 103.9 99.3 106.4 119.8 111.7 91.8 88.41999 ................................ 37.4 29.3 41.9 27.1 40.2 33.1 39.62000 ................................ 48.7 37.1 55.4 26.4 43.5 55.8 30.62001 ................................ 40.1 42.6 38.7 40.1 50.8 25.6 34.62002 ................................ 31.9 16.3 42.3 31.8 36.4 26.0 36.22003 ................................ 36.5 23.7 46.8 36.0 44.8 26.7 49.42004 ................................ 33.5 26.2 40.3 47.3 46.1 19.3 45.02005 ................................ 37.2 27.7 45.1 45.4 39.8 34.2 42.32006 ................................ 45.2 29.2 53.8 41.5 45.1 45.5 52.62007 ................................ 34.7 20.2 41.9 36.9 34.4 35.3 47.52008 ................................ 37.5 27.9 42.3 29.9 34.2 43.6 37.8(1) Capital expenditure at current prices adjusted on basis of the Istat core goods ex-factory price index.(2) The change in 2006 has been calculated excluding the effect of the transaction referred to on page 4, note 1.XLII.XLIII.
2022 COMPANIES SOURCES AND APPLICATIONS OF FUNDSTABLE 112000 2001 2002 2003 2004 2005 2006 2007 2008 2000-02 2003-05 2006-08A m A m A m A m A m A m A m A m A m A m A m A mCapital expenditure ( 1 ) ................................... 30,075 31,832 31,899 30,760 33,035 32,234 29,821 32,082 32,720 93,806 96,029 94,623Financial investments ( 2 ) ................................. 42,004 35,185 25,345 22,321 20,411 18,669 16,177 47,532 9,307 102,534 61,401 73,016Increase (decrease) in cash and other liquid assets ( 3 ) 3,127 (544) (104) 1,781 7,216 3,600 1,199 146 (1,336) 2,479 12,597 9Increase (decrease) in working capital ( 4 ) .............. 3,283 6,680 18,507 25 108 17,527 (1,059) 9,593 6,582 28,470 17,660 15,116Total applications ................................... 78,489 73,153 75,647 54,887 60,770 72,030 46,138 89,353 47,273 227,289 187,687 182,764Cash-flow ( 5 )( 6 ) ........................................... 40,177 44,483 61,879 35,151 61,390 54,390 62,046 60,655 57,068 146,539 150,931 179,769Funds provided by shareholders ( 7 ) ..................... 9,974 5,839 2,885 3,272 (8,583) (5,061) (23,332) (19,662) (27,236) 18,698 (10,372) (70,230)Grants received ........................................... 151 193 69 65 89 49 32 36 35 413 203 103Increase (decrease) in borrowings ( 6 ) ................... 28,187 22,638 10,814 16,399 7,874 22,652 7,392 48,324 17,406 61,639 46,925 73,122Total sources ....................................... 78,489 73,153 75,647 54,887 60,770 72,030 46,138 89,353 47,273 227,289 187,687 182,764TOTAL(1) Excluding capitalised interest charges.(2) Excluding capital increases resulting from asset transfers.(3) Cash in hand and with banks and fixed-interest securities.(4) Increase (decrease) in inventories, trade accounts receivable and other current assets, net of trade accounts payable and other current debt.(5) Including funds generated by divestments.(6) The change in 2006 has been calculated excluding the effect of the transaction referred to on page 4, note 1.(7) Rights issues, including share premiums, net of dividends paid and capital refunded to shareholders.PUBLIC SECTOR COMPANIESSOURCES AND APPLICATIONS OF FUNDSTABLE 122000 2001 2002 2003 2004 2005 2006 2007 2008 2000-02 2003-05 2006-08A m A m A m A m A m A m A m A m A m A m A m A mCapital expenditure ( 1 ) ................................... 10,882 11,322 12,676 13,588 15,776 14,342 10,334 10,434 10,857 34,880 43,706 31,625Financial investments ( 2 ) ................................. 13,072 15,212 4,301 5,257 7,756 884 3,824 34,185 6,632 32,585 13,897 44,641Increase (decrease) in cash and other liquid assets ( 3 ) 249 1,414 34 1,856 (322) (589) 2,196 841 (849) 1,697 945 2,188Increase (decrease) in working capital ( 4 ) .............. 895 5,255 15,263 1,604 2,245 3,212 2,342 6,169 4,793 21,413 7,061 13,304Total applications ................................... 25,098 33,203 32,274 22,305 25,455 17,849 18,696 51,629 21,433 90,575 65,609 91,758Cash-flow ( 5 )( 6 ) ........................................... 15,800 20,075 27,852 17,068 24,210 16,448 20,873 19,298 20,919 63,727 57,726 61,090Funds provided by shareholders ( 7 ) ..................... 1,052 4,326 2,523 510 (2,519) (5,362) (8,568) (8,854) (8,818) 7,901 (7,371) (26,240)Grants received ........................................... 99 99 53 47 72 46 25 35 34 251 165 94Increase (decrease) in borrowings ( 6 ) ................... 8,147 8,703 1,846 4,680 3,692 6,717 6,366 41,150 9,298 18,696 15,089 56,814Total sources ........................................ 25,098 33,203 32,274 22,305 25,455 17,849 18,696 51,629 21,433 90,575 65,609 91,758TOTAL(1) Excluding capitalised interest charges.(2) Excluding capital increases resulting from asset transfers.(3) Cash in hand and with banks and fixed-interest securities.(4) Increase (decrease) in inventories, trade accounts receivable and other current assets, net of trade accounts payable and other current debt.(5) Including funds generated by divestments and adjustments arising from privatisations.(6) The change in 2006 has been calculated excluding the effect of the transaction referred to on page 4, note 1.(7) Rights issues, including share premiums, net of dividends paid and capital refunded to shareholders.XLIV.XLV.
PRIVATE SECTOR COMPANIESSOURCES AND APPLICATIONS OF FUNDSTABLE 132000 2001 2002 2003 2004 2005 2006 2007 2008 2000-02 2003-05 2006-08A m A m A m A m A m A m A m A m A m A m A m A mCapital expenditure ( 1 ) ................................... 19,193 20,510 19,223 17,172 17,259 17,892 19,487 21,648 21,863 58,926 52,323 62,998Financial investments ( 2 ) ................................. 28,932 19,973 21,044 17,064 12,655 17,785 12,353 13,347 2,675 69,949 47,504 28,375Increase (decrease) in cash and other liquid assets ( 3 ) 2,878 (1,958) (138) (75) 7,538 4,189 (997) (695) (487) 782 11,652 (2,179)Increase (decrease) in working capital ( 4 ) .............. 2,388 1,425 3,244 (1,579) (2,137) 14,315 (3,401) 3,424 1,789 7,057 10,599 1,812Total applications ................................... 53,391 39,950 43,373 32,582 35,315 54,181 27,442 37,724 25,840 136,714 122,078 91,006Cash-flow ( 5 ) ............................................. 24,377 24,408 34,027 18,083 37,180 37,942 41,173 41,357 36,149 82,812 93,205 118,679Funds provided by shareholders ( 6 ) ..................... 8,922 1,513 362 2,762 (6,064) 301 (14,764) (10,808) (18,418) 10,797 (3,001) (43,990)Grants received ........................................... 52 94 16 18 17 3 7 1 1 162 38 9Increase (decrease) in borrowings ...................... 20,040 13,935 8,968 11,719 4,182 15,935 1,026 7,174 8,108 42,943 31,836 16,308Total sources ........................................ 53,391 39,950 43,373 32,582 35,315 54,181 27,442 37,724 25,840 136,714 122,078 91,006TOTAL(1) Excluding capitalised interest charges.(2) Excluding capital increases resulting from asset transfers.(3) Cash in hand and with banks and fixed-interest securities.(4) Increase (decrease) in inventories, trade accounts receivable and other current assets, net of trade accounts payable and other current debt.(5) Including funds generated by divestments and adjustments arising from privatisations.(6) Rights issues, including share premiums, net of dividends paid and capital refunded to shareholders.MEDIUM-SIZE COMPANIESSOURCES AND APPLICATIONS OF FUNDSTABLE 142000 2001 2002 2003 2004 2005 2006 2007 2008 2000-02 2003-05 2006-08A m A m A m A m A m A m A m A m A m A m A m A mCapital expenditure ( 1 ) ................................... 1,291 1,272 1,359 1,274 1,195 1,260 1,452 1,556 1,593 3,922 3,729 4,601Financial investments ( 2 ) ................................. (177) 358 353 118 388 538 271 357 446 534 1,044 1,074Increase (decrease) in cash and other liquid assets ( 3 ) 42 47 151 430 109 122 (53) (90) (18) 240 661 (161)Increase (decrease) in working capital ( 4 ) .............. 930 730 141 532 705 688 855 697 503 1,801 1,925 2,055Total applications ................................... 2,086 2,407 2,004 2,354 2,397 2,608 2,525 2,520 2,524 6,497 7,359 7,569Cash-flow ( 5 ) ............................................. 1,398 1,925 1,958 1,970 2,253 2,270 2,276 2,340 2,049 5,281 6,493 6,665Funds provided by shareholders ( 6 ) .....................Grants received ...........................................(124)3(218)8(180)6(366)1(99)1(175)0(269)5(337)0(371)0(522)17(640)2(977)5Increase (decrease) in borrowings ...................... 809 692 220 749 242 513 513 517 846 1,721 1,504 1,876Total sources ........................................ 2,086 2,407 2,004 2,354 2,397 2,608 2,525 2,520 2,524 6,497 7,359 7,569TOTAL(1) Excluding capitalised interest charges.(2) Excluding capital increases resulting from asset transfers.(3) Cash in hand and with banks and fixed-interest securities.(4) Increase (decrease) in inventories, trade accounts receivable and other current assets, net of trade accounts payable and other current debt.(5) Including funds generated by divestments.(6) Rights issues, including share premiums, net of dividends paid and capital refunded to shareholders.XLVI.XLVII.
MANUFACTURING COMPANIESSOURCES AND APPLICATIONS OF FUNDSTABLE 152000 2001 2002 2003 2004 2005 2006 2007 2008 2000-02 2003-05 2006-08A m A m A m A m A m A m A m A m A m A m A m A mCapital expenditure ( 1 ) ................................... 17,475 18,451 18,206 16,766 17,643 17,464 18,688 19,973 21,531 54,132 51,873 60,192Financial investments ( 2 ) ................................. 24,033 27,048 20,677 10,688 14,660 2,986 16,426 42,965 11,414 71,758 28,334 70,805Increase (decrease) in cash and other liquid assets ( 3 ) 376 1,031 (1,357) 2,166 1,002 419 3,035 198 1,054 50 3,587 4,287Increase (decrease) in working capital ( 4 ) .............. (1,805) 7,400 3,390 930 2,337 11,630 2,492 13,368 8,454 8,985 14,897 24,314Total applications ................................... 40,079 53,930 40,916 30,550 35,642 32,499 40,641 76,504 42,453 134,925 98,691 159,598Cash-flow ( 5 ) ............................................. 27,840 35,728 33,191 29,433 44,557 39,137 47,650 44,179 42,477 96,759 113,127 134,306Funds provided by shareholders ( 6 ) ..................... (2,205) 744 1,208 (3,055) (3,954) (7,037) (13,703) (14,322) (15,715) (253) (14,046) (43,740)Grants received ........................................... 133 158 63 41 48 26 8 2 2 354 115 12Increase (decrease) in borrowings ...................... 14,311 17,300 6,454 4,131 (5,009) 373 6,686 46,645 15,689 38,065 (505) 69,020Total sources ........................................ 40,079 53,930 40,916 30,550 35,642 32,499 40,641 76,504 42,453 134,925 98,691 159,598TOTAL(1) Excluding capitalised interest charges.(2) Excluding capital increases resulting from asset transfers.(3) Cash in hand and with banks and fixed-interest securities.(4) Increase (decrease) in inventories, trade accounts receivable and other current assets, net of trade accounts payable and other current debt.(5) Including funds generated by divestments and adjustments arising from assets transferred between manufacturing and service companies.(6) Rights issues, including share premiums, net of dividends paid and capital refunded to shareholders.SERVICE COMPANIESSOURCES AND APPLICATIONS OF FUNDSTABLE 162000 2001 2002 2003 2004 2005 2006 2007 2008 2000-02 2003-05 2006-08A m A m A m A m A m A m A m A m A m A m A m A mCapital expenditure ( 1 ) ................................... 12,600 13,381 13,693 13,994 15,392 14,770 11,133 12,109 11,189 39,674 44,156 34,431Financial investments ( 2 ) ................................. 17,971 8,137 4,668 11,633 5,751 15,683 (249) 4,567 (2,107) 30,776 33,067 2,211Increase (decrease) in cash and other liquid assets ( 3 ) 2,751 (1,575) 1,253 (385) 6,214 3,181 (1,836) (52) (2,390) 2,429 9,010 (4,278)Increase (decrease) in working capital ( 4 ) .............. 5,088 (720) 15,117 (905) (2,229) 5,897 (3,551) (3,775) (1,872) 19,485 2,763 (9,198)Total applications ................................... 38,410 19,223 34,731 24,337 25,128 39,531 5,497 12,849 4,820 92,364 88,996 23,166Cash-flow ( 5 )( 6 ) ........................................... 12,337 8,755 28,688 5,718 16,833 15,253 14,396 16,476 14,591 49,780 37,804 45,463Funds provided by shareholders ( 7 ) .....................Grants received ...........................................12,179185,095351,67766,32724(4,629)411,97623(9,629)24(5,340)34(11,521)3318,951593,67488(26,490)91Increase (decrease) in borrowings ( 6 ) .................. 13,876 5,338 4,360 12,268 12,883 22,279 706 1,679 1,717 23,574 47,430 4,102Total sources ........................................ 38,410 19,223 34,731 24,337 25,128 39,531 5,497 12,849 4,820 92,364 88,996 23,166TOTAL(1) Excluding capitalised interest charges.(2) Excluding capital increases resulting from asset transfers.(3) Cash in hand and with banks and fixed-interest securities.(4) Increase (decrease) in inventories, trade accounts receivable and other current assets, net of trade accounts payable and other current debt.(5) Including funds generated by divestments and adjustments arising from assets transferred between manufacturing and service companies.(6) The change in 2006 has been calculated excluding the effect of the transaction referred to on page 4, note 1.(7) Rights issues, including share premiums, net of dividends paid and capital refunded to shareholders.XLVIII.XLIX.
NON-ITALIAN-OWNED COMPANIESSOURCES AND APPLICATIONS OF FUNDSTABLE 172000 2001 2002 2003 2004 2005 2006 2007 2008 2000-02 2003-05 2006-08A m A m A m A m A m A m A m A m A m A m A m A mCapital expenditure ( 1 ) ................................... 6,873 7,939 7,526 5,965 5,887 5,844 6,006 6,205 6,386 22,338 17,696 18,597Financial investments ( 2 ) ................................. 3,799 6,384 3,730 5,596 6,146 4,417 (1,032) 8,845 (4,797) 13,913 16,159 3,016Increase (decrease) in cash and other liquid assets ( 3 ) (112) 124 (655) 728 (7) 1,000 (561) 311 231 (643) 1,721 (19)Increase (decrease) in working capital ( 4 ) .............. (1,891) 637 (1,399) (427) (1,452) 1,411 (69) 2,088 (2,447) (2,653) (468) (428)Total applications ................................... 8,669 15,084 9,202 11,862 10,574 12,672 4,344 17,449 (627) 32,955 35,108 21,166Cash-flow ( 5 ) ............................................. 2,459 2,483 8,060 8,940 13,380 14,760 13,328 13,714 12,954 13,002 37,080 39,996Funds provided by shareholders ( 6 ) ..................... 1,230 5,428 (1,862) 1,947 (4,738) (1,629) (9,053) (2,147) (12,970) 4,796 (4,420) (24,170)Grants received ........................................... 18 55 4 8 0 1 0 0 0 77 9 0Increase (decrease) in borrowings ...................... 4,962 7,118 3,000 967 1,932 (460) 69 5,882 (611) 15,080 2,439 5,340Total sources ........................................ 8,669 15,084 9,202 11,862 10,574 12,672 4,344 17,449 (627) 32,955 35,108 21,166TOTAL(1) Excluding capitalised interest charges.(2) Excluding capital increases resulting from asset transfers.(3) Cash in hand and with banks and fixed-interest securities.(4) Increase (decrease) in inventories, trade accounts receivable and other current assets, net of trade accounts payable and other current debt.(5) Including funds generated by divestments and adjustments arising from assets transferred between non-Italian - and Italian-ownedcompanies.(6) Rights issues, including share premiums, net of dividends paid and capital refunded to shareholders.L. LI.
BORROWINGSFROM BANKSTABLE 18MEDIUM AND LONG-TERM FINANCE SHORT-TERM FINANCE TOTALBANKBORROWINGS ASA % OF TOTALEXTERNALFUNDING ( 1 )Public sector Private sector Totalof which:medium-sizeof which:non-italianownedPublic sector Private sector Totalof which:medium-sizeof which:non-italianownedPublic sector Private sector Totalof which:medium-sizeA ’000 A ’000 A ’000 A ’000 A ’000 A ’000 A ’000 A ’000 A ’000 A ’000 A ’000 A ’000 A ’000 A ’000 A ’000 %Balance at end of 1999 8,095,062 25,842,979 33,938,041 2,072,570 5,728,928 4,678,527 33,692,469 38,370,996 3,975,444 10,635,678 12,773,589 59,535,448 72,309,037 6,048,014 16,364,606 55.3% 63.4 43.4 46.9 34.3 35.0 36.6 56.6 53.1 65.7 65.0 100.0 100.0 100.0 100.0 100.0Change in 2000 1,718,522 610,325 2,328,847 104,315 644,344 4,332,971 10,955,466 15,288,437 720,432 141,312 6,051,493 11,565,791 17,617,284 824,747 785,656 62.5Change in 2001 7,125,609 5,256,523 12,382,132 93,351 3,408,221 2,143,635 (3,298,408) (1,154,773) 329,204 273,740 9,269,244 1,958,115 11,227,359 422,555 3,681,961 49.6Change in 2002 (3,670,013) 4,183,927 513,914 195,605 1,425,397 3,842,395 (4,880,913) (1,038,518) 218,788 (2,910,465) 172,382 (696,986) (524,604) 414,393 (1,485,068) ...Change in 2003 2,616,273 7,297,213 9,913,486 15,067 2,387,929 (4,230,489) (2,940,524) (7,171,013) 192,009 137,388 (1,614,216) 4,356,689 2,742,473 207,076 2,525,317 16.7Change in 2004 178,663 (5,912,575) (5,733,912) 126,058 2,580,812 (5,158,544) (1,437,313) (6,595,857) 39,092 (2,291,621) (4,979,881) (7,349,888) (12,329,769) 165,150 289,191 ...Change in 2005 (4,155,725) 9,318,719 5,162,994 321,634 (466,929) (1,382,406) (3,841,904) (5,224,310) 113,609 (439,296) (5,538,131) 5,476,815 (61,316) 435,243 (906,225) ...Change in 2006 (383,898) (1,961,156) (2,345,054) 322,961 (943,983) 1,667,334 2,498,667 4,166,001 371,386 (472,014) 1,283,436 537,511 1,820,947 694,347 (1,415,997) ...Change in 2007 20,250,227 2,231,619 22,481,846 232,582 86,722 (1,089,978) 1,066,916 (23,062) 394,874 742,994 19,160,249 3,298,535 22,458,784 627,456 829,716 46.5Change in 2008 5,756,717 3,839,812 9,596,529 94,875 (357,266) (558,635) 4,042,266 3,483,631 709,616 66,831 5,198,082 7,882,078 13,080,160 804,491 (290,435) 75.1of which:non-italianownedTotalChange between 1999and 2008 29,436,375 24,864,407 54,300,782 1,506,448 8,765,247 (433,717) 2,164,253 1,730,536 3,089,010 (4,751,131) 29,002,658 27,028,660 56,031,318 4,595,458 4,014,116 33.2% 101.5 92.0 96.9 32.8 218.4 (1.5) 8.0 3.1 67.2 (118.4) 100.0 100.0 100.0 100.0 100.0Balance at end of 2008 37,531,437 50,707,386 88,238,823 3,579,018 14,494,175 4,244,810 35,856,722 40,101,532 7,064,454 5,884,547 41,776,247 86,564,108 128,340,355 10,643,472 20,378,722 42.9% 89.8 58.6 68.8 33.6 71.1 10.2 41.4 31.2 66.4 28.9 100.0 100.0 100.0 100.0 100.0(1) Borrowings.LII.LIII.
TABLE 19TABLE 21WORKING CAPITAL AS A PERCENTAGE OF NET SALES1999 2000 2001 2002 2003 2004 2005 2006 2007 2008% % % % % % % % % %2022 COMPANIES ............... 11.9 10.6 12.1 13.6 13.5 12.8 14.6 12.8 12.7 12.0PUBLIC SECTOR COMPANIES ..... 10.3 7.5 11.3 15.0 14.0 14.0 16.7 15.2 17.1 13.9PRIVATE SECTOR COMPANIES ... 12.3 11.5 12.3 13.2 13.3 12.4 14.0 12.1 11.4 11.3MEDIUM-SIZE COMPANIES ....... 27.0 26.7 27.7 27.3 28.3 28.7 29.5 29.4 28.8 29.0MANUFACTURING COMPANIES. .. 16.1 13.9 15.2 16.2 16.0 15.6 17.6 15.3 16.3 15.7SERVICE COMPANIES ............ –7.1 –4.9 –1.5 2.3 3.2 0.8 1.2 0.5 –5.4 –8.1NON-ITALIAN-OWNED COMPANIES 13.1 10.9 12.5 12.4 11.7 10.7 10.5 9.8 8.7 7.5N.B. - Working capital has been computed as the sum of the following items: inventories and trade receivables (net of their respectiveprovisions for losses), other current assets, trade payables, amounts due to group companies and other current liabilities. The figures excludethe effect of gains on asset transfers. Ratios broken down by companies with a profitable, loss-making or mixed record are not given as theyare not significant.2022COMPANIESBALANCE SHEET STRUCTUREPUBLICSECTORCOMPANIESPRIVATESECTORCOMPANIESMEDIUM-SIZECOMPANIESMANUFAC-TURINGCOMPANIESSERVICECOMPANIESNON-ITALIAN-OWNEDCOMPANIES2007 2008 2007 2008 2007 2008 2007 2008 2007 2008 2007 2008 2007 2008% % % % % % % % % % % % % %NET TANGIBLE FIXEDASSETS .............. 44.9 45.6 57.0 56.2 34.8 36.8 28.4 34.2 32.8 33.1 72.6 77.1 36.9 39.8NET WORKINGCAPITAL ( 1 ) ........ 13.1 12.7 8.6 8.1 16.8 16.5 46.5 42.8 20.1 19.6 –3.0 –4.8 16.0 14.9ASSETS USED INOPERATIONS ....... 58.0 58.3 65.6 64.3 51.6 53.3 74.9 77.0 52.9 52.7 69.6 72.3 52.9 54.7INVESTMENTS INRELATED AND OTHERCOMPANIES .......... 35.8 36.0 30.1 31.9 40.7 39.4 14.2 13.4 41.7 42.0 22.5 20.9 42.7 40.4INVENTORIES AS A PERCENTAGE OF NET SALESTABLE 20CASH ................. 6.2 5.7 4.3 3.8 7.7 7.3 10.9 9.6 5.4 5.3 7.9 6.8 4.4 4.9TOTAL ........... 100.0 100.0 100.0 100.0 100.0 100.0 100.0 100.0 100.0 100.0 100.0 100.0 100.0 100.0SHAREHOLDERS’EQUITY ( 2 ) ......... 41.1 40.8 52.5 51.6 31.5 31.9 46.1 48.9 45.6 45.8 30.8 28.5 34.3 32.61999 2000 2001 2002 2003 2004 2005 2006 2007 2008% % % % % % % % % %2022 COMPANIES ............... 17.9 16.1 16.2 16.9 16.4 16.3 15.9 15.2 16.1 16.4PUBLIC SECTOR COMPANIES .... 20.0 14.0 13.2 15.0 14.9 14.5 12.8 12.9 13.6 10.9PRIVATE SECTOR COMPANIES ... 17.4 16.7 17.0 17.3 16.8 16.7 16.7 15.9 16.8 18.2MEDIUM-SIZE COMPANIES ....... 24.2 23.2 23.0 23.3 23.1 23.9 24.4 24.2 23.8 24.4MANUFACTURING COMPANIES .. 21.0 18.6 18.7 19.7 19.3 19.1 18.5 17.5 18.5 18.7SERVICE COMPANIES ............ 4.0 3.9 4.8 4.6 4.4 4.3 3.8 3.7 3.9 4.1STAFF-RELATEDPROVISIONS ....... 3.9 3.6 3.1 2.9 4.5 4.1 4.8 4.0 3.8 3.4 3.9 3.8 5.4 5.2BORROWINGS:– medium- andlong-term ......... 30.5 33.5 24.4 31.6 35.7 35.1 18.2 16.6 23.4 28.0 46.9 47.4 27.9 29.8– short-term ........ 17.7 16.1 12.6 7.8 22.0 23.0 28.0 27.6 20.6 17.2 11.1 13.4 24.0 23.848.2 49.6 37.0 39.4 57.7 58.1 46.2 44.2 44.0 45.2 58.0 60.8 51.9 53.6OTHER LIABILITIES ... 6.8 6.0 7.4 6.1 6.3 5.9 2.9 2.9 6.6 5.6 7.3 6.9 8.4 8.6TOTAL ........... 100.0 100.0 100.0 100.0 100.0 100.0 100.0 100.0 100.0 100.0 100.0 100.0 100.0 100.0NON-ITALIAN-OWNED COMPANIES 14.2 13.6 13.8 13.8 13.3 13.0 12.9 12.5 14.2 15.1N.B. - Inventories are stated net of provisions against losses and the effect of gains on asset transfers.(1) Working capital is the sum of inventories and trade accounts receivable (less provisions for writedown), current assets, trade payables,amounts due to Group companies and other current liabilities.(2) Net of own shares and non-tangible fixed assets.LIV.LV.
TABLE 22cont. TABLE 22CHANGES IN SHAREHOLDERS’ EQUITY2006-082000-02 2003-05 2006 2007 2008 TotalA mTotal2000-082022 COMPANIESBalance at beginning of year ........ 178,380 253,247 342,306 346,252 355,768 342,306 178,380Profit (loss) for year ..................Dividends paid during year ..........30,566(45,606)68,395(58,594)28,245(25,759)31,305(25,315)26,264(33,506)85,814 184,775(84,580) (188,780)New equity issues ..................... 64,304 48,222 2,427 5,653 6,270 14,350 126,876Increases in share capital arisingfrom asset transfers ................. 2,295 1,316 (649) 262 384 (3) 3,608Investment grants .....................Changes, own shares .................413(3,794)203(1,474)32(5,055)36(1,415)35(1,557)103(8,027)719(13,295)Revaluations ...........................Transfers to (from) p/l account ......38,95215,23010,17755,6793214,17702,4146,2304,1366,55110,72755,68081,636Other changes ( 1 ) ..................... (27,493) (34,865) 207 (3,424) (3,289) (6,506) (68,864)Balance at year-end ................... 253,247 342,306 346,252 355,768 360,735 360,735 360,735PUBLIC SECTOR COMPANIESBalance at beginning of year ........ 86,033 124,440 151,727 150,942 153,440 151,727 86,033Profit (loss) for year .................. 16,795 31,847 9,191 12,462 12,961 34,614 83,256Dividends paid during year .......... (13,709) (22,689) (10,740) (10,649) (10,206) (31,595) (67,993)New equity issues .....................Increases in share capital arising21,610 15,318 2,172 1,795 1,388 5,355 42,283from asset transfers .................Investment grants .....................620251207165(414)25(262)353834(638)94189510Changes, own shares .................Revaluations ...........................(2,849)32,128(1,482)3,429(1,732)0(1,014)0(840)234(3,586)234(7,917)35,791Transfers to (from) p/l account ......Other changes ( 1 ) .....................5,376(21,815)1,636(1,144)1,517(804)(225)356(483)(1,590)809(2,038)7,821(24,997)Balance at year-end ................... 124,440 151,727 150,942 153,440 154,976 154,976 154,9762006-082000-02 2004-05 2006 2007 2008 TotalTotal2000-08MEDIUM-SIZE COMPANIESBalance at beginning of year ........ 6,977 9,348 11,142 11,886 12,820 11,142 6,977Profit (loss) for year ..................Dividends paid during year ..........1,909(1,021)1,903(1,209)878(475)1,124(486)681(496)2,683(1,457)6,495(3,687)New equity issues ..................... 499 569 206 149 125 480 1,548Increases in share capital arisingfrom asset transfers ................. 7 (28) 81 92 63 236 215Investment grants .....................Changes, own shares .................17(13)2(74)5110120(25)5(2)24(89)Revaluations ...........................Transfers to (from) p/l account ......9593527201952520501,890271,915793,594626Other changes ( 1 ) ..................... (338) (284) 11 (7) (68) (64) (686)Balance at year-end ................... 9,348 11,142 11,886 12,820 15,017 15,017 15,017NON-ITALIAN-OWNED COMPANIESBalance at beginning of year ........Profit (loss) for year ..................32,8087,64553,03011,32370,8694,90267,5795,89869,9663,62770,86914,42732,80833,395Dividends paid during year .......... (9,607) (17,506) (6,188) (5,473) (15,448) (27,109) (54,222)New equity issues ..................... 14,403 13,086 (2,865) 3,326 2,478 2,939 30,428Increases in share capital arisingfrom asset transfers .................Investment grants .....................1,356772,4249(136)01800201024504,02586Changes, own shares .................Revaluations ...........................(4)2,311(21)3,332(3,300)2832240159853(2,917)1,136(2,942)6,779Transfers to (from) p/l account ......Other changes ( 1 ) .....................4,596(555)13,113(7,921)6623,3521,905(3,673)3,517(895)6,084(1,216)23,793(9,692)Balance at year-end ................... 53,030 70,869 67,579 69,966 64,458 64,458 64,458A mPRIVATE SECTOR COMPANIESBalance at beginning of year ........Profit (loss) for year ..................92,34713,771128,80736,548190,57919,054195,31018,843202,32813,303190,57951,<strong>2009</strong>2,347101,519Dividends paid during year ..........New equity issues .....................(31,897)42,694(35,905)32,904(15,019)255(14,666)3,858(23,300)4,882(52,985) (120,787)8,995 84,593Increases in share capital arisingfrom asset transfers ................. 1,675 1,109 (235) 524 346 635 3,419Investment grants .....................Changes, own shares .................162(945)3887(3,323)1(401)1(717)9(4,441)209(5,378)Revaluations ...........................Transfers to (from) p/l account ......6,8249,8546,74854,0433212,66002,6395,9964,6196,3179,91819,88973,815Other changes ( 1 ) ..................... (5,678) (33,721) (1,011) (3,780) (1,699) (4,468) (43,867)Balance at year-end ................... 128,807 190,579 195,310 202,328 205,759 205,759 205,759cont.(1) Mainly adjustments arising on mergers, including the acquisition of shares of companies subsequently amalgamated into buyer company.LVI.LVII.
TABLE 23TABLE 24INDEBTEDNESS AS A PERCENTAGE OF SHAREHOLDERS’ EQUITYAVERAGE ANNUAL COST PER EMPLOYEE1999 2000 2001 2002 2003 2004 2005 2006 2007 2008% % % % % % % % % %2022 COMPANIEStotal debt .......................... 160.9 165.4 159.7 175.3 177.2 176.9 156.1 156.2 172.7 183.7of which: indebtedness .......... 73.3 78.2 80.8 89.8 93.9 93.5 85.1 82.0 95.8 102.1borrowings from banks 40.6 44.3 45.0 47.0 46.5 39.3 32.3 32.6 39.1 43.8PUBLIC SECTOR COMPANIEStotal debt .......................... 80.8 91.3 87.1 99.3 99.0 103.0 102.7 100.8 139.1 150.3of which: indebtedness ..........borrowings from banks35.114.841.820.546.127.653.030.655.127.456.421.458.314.752.616.088.332.895.637.0PRIVATE SECTOR COMPANIEStotal debt .......................... 235.6 226.5 219.9 232.9 237.9 234.4 190.3 190.6 193.3 204.6of which: indebtedness .......... 109.0 108.3 109.5 117.8 123.9 122.3 102.2 100.2 100.3 106.2borrowings from banks 64.5 63.9 59.5 59.4 61.3 53.2 43.6 42.8 43.0 48.0MEDIUM-SIZE COMPANIEStotal debt .......................... 235.9 246.5 240.4 235.0 240.7 237.5 240.2 238.5 229.7 231.3of which: indebtedness ..........borrowings from banks106.186.7111.393.1113.092.6108.891.9116.593.4112.790.1113.591.0110.591.4105.889.3110.494.0MANUFACTURING COMPANIEStotal debt .......................... 175.8 178.3 173.3 180.1 184.7 177.3 164.5 168.9 193.0 198.9of which: indebtedness ..........borrowings from banks74.145.175.846.081.150.585.149.388.446.480.439.473.032.074.232.796.143.5100.648.9SERVICE COMPANIEStotal debt .......................... 130.6 139.5 133.4 164.4 162.3 176.0 142.8 134.9 137.7 154.0of which: indebtedness .......... 71.9 83.1 80.1 100.5 104.7 120.5 104.2 95.3 95.3 105.2borrowings from banks 31.4 40.7 34.3 41.8 46.7 39.1 32.9 32.3 31.7 33.7NON-ITALIAN-OWNED COMPANIEStotal debt .......................... 204.1 211.0 181.4 179.0 156.9 160.7 154.6 169.5 180.0 206.4of which: indebtedness ..........borrowings from banks83.150.186.846.381.843.483.538.272.636.775.737.170.933.775.233.481.833.490.136.72000 2001 2002 2003 2004 2005 2006 2007 2008A ’000 A ’000 A ’000 A ’000 A ’000 A ’000 A ’000 A ’000 A ’0002022 COMPANIES– Average cost .................. 40.4 41.2 42.0 43.2 44.4 45.9 47.4 48.4 49.3– Index number ................. 100.0 102.0 104.0 106.9 109.9 113.6 117.3 119.8 122.0PUBLIC SECTOR COMPANIES– Average cost .................. 45.1 46.8 47.0 49.4 51.6 52.2 56.7 56.5 57.6– Index number ................. 100.0 103.8 104.2 109.5 114.4 115.7 125.7 125.3 127.7PRIVATE SECTOR COMPANIES– Average cost .................. 39.0 39.6 40.7 41.6 42.5 44.3 45.0 46.4 47.3– Index number ................. 100.0 101.5 104.4 106.7 109.0 113.6 115.4 119.0 121.3MEDIUM-SIZE COMPANIES– Average cost .................. 35.3 36.0 37.1 38.0 39.3 40.7 41.7 43.3 44.5– Index number ................. 100.0 102.0 105.1 107.6 111.3 115.3 118.1 122.7 126.1MANUFACTURING COMPANIES– Average cost .................. 40.6 41.5 42.7 44.1 45.6 47.1 49.1 50.4 51.0– Index number ................. 100.0 102.2 105.2 108.6 112.3 116.0 120.9 124.1 125.6SERVICE COMPANIES– Average cost .................. 39.9 40.6 40.5 41.2 41.5 43.1 43.4 43.8 45.3– Index number ................. 100.0 101.8 101.5 103.3 104.0 108.0 108.8 109.8 113.5NON-ITALIAN-OWNED COMPANIES– Average cost .................. 41.5 42.8 43.6 44.9 46.0 48.0 49.3 51.0 52.2– Index number ................. 100.0 103.1 105.1 108.2 110.8 115.7 118.8 122.9 125.8N.B. - Net capital does not include amounts deriving from revaluations pursuant to Laws 342/00, 448/01, 350/03, 266/05 and 2/09,gains arising on transfer booked during the period, and the effects of tax ‘‘cleansing’’ (for 2004 and 2005); accounts payable do not includeprovisions for post-retirement benefits, provisions for deferred taxes, or sundry other provisions.N.B. - Costs are based on average number of employees in year.LVIII.LIX.
TABLE 25EMPLOYEESBY CATEGORY1999 2000 2001 2002 2003 2004 2005 2006 2007 2008No. % No. % No. % No. % No. % No. % No. % No. % No. % No. %1990 COMPANIES– Operatives and supervisors .. 645,592 49.6 636,830 48.9 621,235 48.1 603,276 47.4 583,083 46.4 571,384 45.8 567,891 45.7 564,505 45.4 567,823 45.4 560,915 45.0– Clerical and executive staff .. 656,092 50.4 666,423 51.1 670,125 51.9 669,733 52.6 672,408 53.6 674,981 54.2 675,394 54.3 679,366 54.6 681,596 54.6 684,199 55.0Total employees ........... 1,301,684 100.0 1,303,253 100.0 1,291,360 100.0 1,273,009 100.0 1,255,491 100.0 1,246,365 100.0 1,243,285 100.0 1,243,871 100.0 1,249,419 100.0 1,245,114 100.0PUBLIC SECTOR COMPANIES– Operatives and supervisors .. 81,134 37.2 77,713 36.8 72,950 36.4 68,459 35.3 60,878 33.0 57,893 32.1 56,170 31.6 54,455 30.9 52,856 30.8 50,821 30.0– Clerical and executive staff .. 136,985 62.8 133,695 63.2 127,348 63.6 125,249 64.7 123,484 67.0 122,338 67.9 121,676 68.4 121,560 69.1 118,654 69.2 118,735 70.0Total employees ........... 218,119 100.0 211,408 100.0 200,298 100.0 193,708 100.0 184,362 100.0 180,231 100.0 177,846 100.0 176,015 100.0 171,510 100.0 169,556 100.0PRIVATE SECTOR COMPANIES– Operatives and supervisors .. 564,458 52.1 559,117 51.2 548,285 50.3 534,817 49.6 522,205 48.8 513,491 48.2 511,721 48.0 510,050 47.8 514,967 47.8 510,094 47.4– Clerical and executive staff .. 519,107 47.9 532,728 48.8 542,777 49.7 544,484 50.4 548,924 51.2 552,643 51.8 553,718 52.0 557,806 52.2 562,942 52.2 565,464 52.6Total employees ........... 1,083,565 100.0 1,091,845 100.0 1,091,062 100.0 1,079,301 100.0 1,071,129 100.0 1,066,134 100.0 1,065,439 100.0 1,067,856 100.0 1,077,909 100.0 1,075,558 100.0MEDIUM-SIZE COMPANIES– Operatives and supervisors .. 61,394 65.8 62,430 65.2 62,823 64.7 62,594 63.9 62,778 63.3 62,038 62.8 61,533 62.3 61,385 61.8 61,389 61.5 61,121 61.1– Clerical and executive staff .. 31,843 34.2 33,279 34.8 34,326 35.3 35,391 36.1 36,322 36.7 36,716 37.2 37,193 37.7 37,913 38.2 38,357 38.5 38,987 38.9Total employees ........... 93,237 100.0 95,709 100.0 97,149 100.0 97,985 100.0 99,100 100.0 98,754 100.0 98,726 100.0 99,298 100.0 99,746 100.0 100,108 100.0MANUFACTURING COMPANIES– Operatives and supervisors .. 586,438 57.2 578,306 56.9 562,153 56.1 545,106 55.4 529,247 54.9 516,974 54.2 512,352 54.0 507,957 53.5 510,415 53.6 502,613 53.0– Clerical and executive staff .. 438,383 42.8 437,808 43.1 439,272 43.9 438,204 44.6 435,169 45.1 436,091 45.8 437,183 46.0 440,679 46.5 441,894 46.4 445,486 47.0Total employees ........... 1,024,821 100.0 1,016,114 100.0 1,001,425 100.0 983,310 100.0 964,416 100.0 953,065 100.0 949,535 100.0 948,636 100.0 952,309 100.0 948,099 100.0SERVICE COMPANIES– Operatives and supervisors .. 59,154 21.4 58,524 20.4 59,082 20.4 58,170 20.1 53,836 18.5 54,410 18.6 55,539 18.9 56,548 19.2 57,408 19.3 58,302 19.6– Clerical and executive staff .. 217,709 78.6 228,615 79.6 230,853 79.6 231,529 79.9 237,239 81.5 238,890 81.4 238,211 81.1 238,687 80.8 239,702 80.7 238,713 80.4Total employees ........... 276,863 100.0 287,139 100.0 289,935 100.0 289,699 100.0 291,075 100.0 293,300 100.0 293,750 100.0 295,235 100.0 297,110 100.0 297,015 100.0NON-ITALIAN-OWNED COMPANIES– Operatives and supervisors .. 166,837 43.8 167,332 42.9 166,194 42.1 161,147 41.3 159,435 41.0 155,716 40.8 153,281 40.7 149,288 39.9 146,638 39.3 143,958 39.1– Clerical and executive staff .. 214,070 56.2 222,744 57.1 228,298 57.9 228,809 58.7 229,350 59.0 225,572 59.2 223,034 59.3 224,787 60.1 226,760 60.7 224,541 60.9Total employees ........... 380,907 100.0 390,076 100.0 394,492 100.0 389,956 100.0 388,785 100.0 381,288 100.0 376,315 100.0 374,075 100.0 373,398 100.0 368,499 100.0N.B. - Figures cover 1990 companies with gross tangible assets at the end of 2008 amounting to A 498,322m, or 82,7% of the total fixedassets of all the 2022 companies, when these 1990 companies accounted for 93.1% of the aggregate workforce of all the 2022 companies.LX.LXI.
OttavioCapriolo - Caleppio di Settala (MI)IV. V.