Standard Reference Material 2881 - National Institute of Standards ...
Standard Reference Material 2881 - National Institute of Standards ...
Standard Reference Material 2881 - National Institute of Standards ...
You also want an ePaper? Increase the reach of your titles
YUMPU automatically turns print PDFs into web optimized ePapers that Google loves.
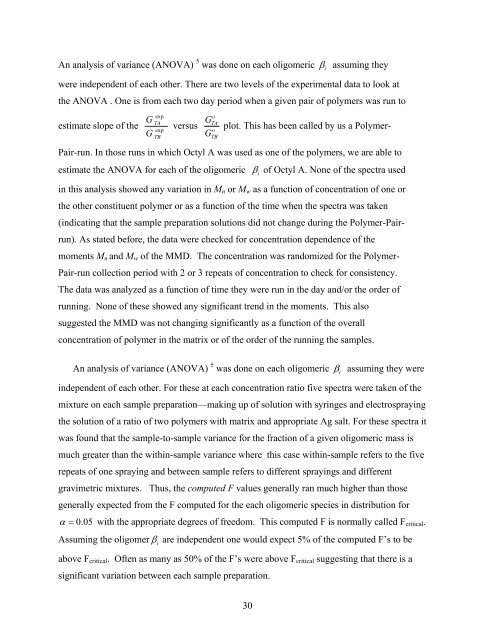
An analysis <strong>of</strong> variance (ANOVA) 5 was done on each oligomeric βiassuming theywere independent <strong>of</strong> each other. There are two levels <strong>of</strong> the experimental data to look atthe ANOVA . One is from each two day period when a given pair <strong>of</strong> polymers was run toestimate slope <strong>of</strong> theGGexpTAexpTBversusGGoTAoTBplot. This has been called by us a Polymer-Pair-run. In those runs in which Octyl A was used as one <strong>of</strong> the polymers, we are able toestimate the ANOVA for each <strong>of</strong> the oligomericβi<strong>of</strong> Octyl A. None <strong>of</strong> the spectra usedin this analysis showed any variation in M n or M w as a function <strong>of</strong> concentration <strong>of</strong> one orthe other constituent polymer or as a function <strong>of</strong> the time when the spectra was taken(indicating that the sample preparation solutions did not change during the Polymer-Pairrun).As stated before, the data were checked for concentration dependence <strong>of</strong> themoments M n and M w <strong>of</strong> the MMD. The concentration was randomized for the Polymer-Pair-run collection period with 2 or 3 repeats <strong>of</strong> concentration to check for consistency.The data was analyzed as a function <strong>of</strong> time they were run in the day and/or the order <strong>of</strong>running. None <strong>of</strong> these showed any significant trend in the moments. This alsosuggested the MMD was not changing significantly as a function <strong>of</strong> the overallconcentration <strong>of</strong> polymer in the matrix or <strong>of</strong> the order <strong>of</strong> the running the samples.An analysis <strong>of</strong> variance (ANOVA) 5 was done on each oligomeric βiassuming they wereindependent <strong>of</strong> each other. For these at each concentration ratio five spectra were taken <strong>of</strong> themixture on each sample preparation—making up <strong>of</strong> solution with syringes and electrosprayingthe solution <strong>of</strong> a ratio <strong>of</strong> two polymers with matrix and appropriate Ag salt. For these spectra itwas found that the sample-to-sample variance for the fraction <strong>of</strong> a given oligomeric mass ismuch greater than the within-sample variance where this case within-sample refers to the fiverepeats <strong>of</strong> one spraying and between sample refers to different sprayings and differentgravimetric mixtures. Thus, the computed F values generally ran much higher than thosegenerally expected from the F computed for the each oligomeric species in distribution forα = 0.05 with the appropriate degrees <strong>of</strong> freedom. This computed F is normally called F critical .Assuming the oligomer β are independent one would expect 5% <strong>of</strong> the computed F’s to beiabove F critical . Often as many as 50% <strong>of</strong> the F’s were above F critical suggesting that there is asignificant variation between each sample preparation.30


