View - Wageningen NMR Centre
View - Wageningen NMR Centre
View - Wageningen NMR Centre

Create successful ePaper yourself
Turn your PDF publications into a flip-book with our unique Google optimized e-Paper software.
Anal. Chem. 2000, 72, 2292-2301Electroosmotic and Pressure-Driven Flow in Openand Packed Capillaries: Velocity Distributions andFluid DispersionUlrich Tallarek,* ,† Erdmann Rapp, ‡ Tom Scheenen, † Ernst Bayer, ‡ and Henk Van As †Laboratory of Molecular Physics and <strong>Wageningen</strong> <strong>NMR</strong> <strong>Centre</strong>, Department of Biomolecular Sciences, <strong>Wageningen</strong>University, Dreijenlaan 3, 6703 HA <strong>Wageningen</strong>, The Netherlands, and Research Center of Nucleic Acid and PeptideChemistry, Institute of Organic Chemistry, University of Tübingen, Auf der Morgenstelle 18, 72076 Tübingen, GermanyThe flow field dynamics in open and packed segments ofcapillary columns has been studied by a direct motionencoding of the fluid molecules using pulsed magneticfield gradient nuclear magnetic resonance. This noninvasivemethod operates within a time window that allowsa quantitative discrimination of electroosmotic againstpressure-driven flow behavior. The inherent axial fluidflow field dispersion and characteristic length scales ofeither transport mode are addressed, and the resultsdemonstrate a significant performance advantage of anelectrokinetically driven mobile phase in both opentubularand packed-bed geometries. In contrast to theparabolic velocity profile and its impact on axial dispersioncharacterizing laminar flow through an open cylindricalcapillary, a pluglike velocity distribution of theelectroosmotic flow field is revealed in capillary electrophoresis.Here, the variance of the radially averaged, axialdisplacement probability distributions is quantitativelyexplained by longitudinal molecular diffusion at the actualbuffer temperature, while for Poiseuille flow, the preasymptoticregime to Taylor-Aris dispersion can beshown. Compared to creeping laminar flow through apacked bed, the increased efficiency observed in capillaryelectrochromatography is related to the superior characteristicsof the electroosmotic flow profile over any lengthscale in the interstitial pore space and to the origin, spatialdimension, and hydrodynamics of the stagnant fluid onthe support particles’ external surface. Using the Knoxequation to analyze the axial plate height data, an eddydispersion term smaller by a factor of almost 2.5 than incapillary high-performance liquid chromatography is revealedfor the electroosmotic flow field in the samecolumn.The actual flow pattern of a fluid undergoing slow, laminarflow in a packed bed of particles depends on the morphology (i.e.,the topology and geometry) of the pore space that is available forthe flow, and the existence of a point-to-point difference in flow* To whom correspondence should be addressed: (phone) + 31 (317) 48-2047; (fax) + 31 (317) 48-2725; (e-mail) ulrich.tallarek@water.mf.wau.nl.†<strong>Wageningen</strong> University.‡University of Tübingen.velocity is a fundamental property of the fluid flow field underthe most general conditions. 1 However, not only the inherentstructural heterogeneity of the porous medium but also the actualphysical origin(s) of the flow may very sensitively influence thecorrelation time and length which characterize velocity fluctuationsin the mobile phase.In contrast to the more conventional pressure-driven mode,capillary electrochromatography (CEC) utilizes the hydrodynamicsof an electroosmotic flow (EOF) to transport solute moleculesthrough the interconnected pore space of capillary columnspacked with small adsorbent particles. 2-7 The ideal EOF in anarrow cylindrical channel should be characterized by a flat, i.e.,pluglike velocity profile at distances from the surface that are ofthe order of the electric double-layer thickness. This intrinsicproperty makes the channel cross-sectional profile and magnitudeof the EOF independent of the actual channel diameter, providedthat the latter is significantly larger than the electric double-layerthickness. 8 The situation is in sharp contrast to the parabolic(Poiseuille) velocity profile encountered in pressure-driven flow,which directly results from the distribution of shear stress in aviscous fluid under laminar flow conditions. Further, the crosssectionalaverage velocity in the (cylindrical) channel heredepends on the square of its diameter.These characteristics have important implications for the eddydispersion contribution to the overall band spreading expectedin CEC and capillary high-performance liquid chromatography(CHPLC). 9 In general, eddy dispersion is caused by any velocityinequality of the flow pattern over the whole column cross section.Due to the anatomy of the available stream paths in the packedbed and local or systematic changes in packing density, fluctuationsin permeability and mobile-phase velocity also exist at(1) Sahimi, M. Applications of Percolation Theory; Taylor & Francis: London,1994.(2) Knox, J. H.; Grant, I. H. Chromatographia 1987, 24, 135-143.(3) Dittmann, M. M.; Wienand, K.; Bek, F.; Rozing, G. P. LC-GC 1995, 13,800-814.(4) Crego, A. L.; González, A.; Marina, M. L. Crit. Rev. Anal. Chem. 1996, 26,261-304.(5) Colón, L. A.; Reynolds, K. J.; Alicea-Maldonado, R.; Fermier, A. M.Electrophoresis 1997, 18, 2162-2174.(6) Rathore, A. S.; Horváth, Cs. J. Chromatogr., A 1997, 781, 185-195.(7) Colón, L. A.; Guo, Y.; Fermier, A. Anal. Chem. 1997, 69, 461A-467A.(8) Rice, C. L.; Whitehead, R. J. Phys. Chem. 1965, 69, 4017-4024.(9) Knox, J. H. Chromatographia 1988, 26, 329-337.2292 Analytical Chemistry, Vol. 72, No. 10, May 15, 2000 10.1021/ac991303i CCC: $19.00 © 2000 American Chemical SocietyPublished on Web 04/12/2000
different length scales in the packing with laminar flow. 10 Inaddition to the convective mechanism of exchange, the time scaleof lateral diffusion between the slow and fast stream paths largelygoverns the actual extent of band spreading. 10,11 Velocity extremeswithin and (on any time and length scale) between differentchannels in the packing may be absolutely minimized withelectroosmotic flow, resulting in a much smaller eddy dispersioncontribution. An improvement in efficiency by a factor of almost2 over CHPLC has been demonstrated experimentally for CECwhen carried out with the same column. 12 It was concluded thatonly axial diffusion constitutes the ultimate limitation to performancein CEC when achieved with nanoparticles.Due to the high efficiencies that may be obtained withelectrokinetically driven fluid flows in open tubes 13 (CE) andpacked capillaries 5 (CEC), any factor influencing fluid dispersionunder these hydrodynamic conditions should be well characterizedand under control. The actual profile of the EOF and itsstability have a large effect in improving the resolution andefficiency and certainly belong to the most important aspectscontrolling reproducibility. 14 Temperature effects may constitutea further source of difficulties.The goal of our work is the development of an experimentalapproach toward the intrinsic fluid dynamics of capillary electroseparationtechniques. In this first article, we report about a qualitativeand quantitative characterization of pressure- and electrokineticallydriven flows through open and packed capillaries. Thediscrimination is based on the respective fluid flow field and axialdispersion behavior which are both directly measured overdiscrete temporal and spatial domains by pulsed field gradientnuclear magnetic resonance (PFG-<strong>NMR</strong>). 15-17 A setup has beendevised that allows measurements in capillary columns to beperformed with a 0.5-T ( 1 H 20.35 MHz) electromagnet. Due to itsopen access, the presented <strong>NMR</strong> configuration offers a mostflexible and convenient implementation of the CE, CHPLC, andCEC equipment, and the approach holds great promise for afundamental study of many hydrodynamic aspects within theseopen tube and packed bed segments.EXPERIMENTAL SECTION<strong>NMR</strong> Hardware Configuration. The schematics of the setupis shown in Figure 1. 1 H 20.35-MHz PFG-<strong>NMR</strong> measurementswere made on a 0.5-T <strong>NMR</strong> spectrometer with open access,consisting of a SMIS console (Surrey Medical Imaging Systems,Guildford, U.K.), an iron core magnet (Bruker, Karlsruhe,Germany), and a 45-mm-i.d. actively shielded gradient system(Doty Scientific, Columbia, OH) capable of producing pulsedmagnetic field gradients of up to 0.5 T/m in the direction of thecolumn axis (y-direction). The solenoidal radio frequency (rf) coil 18(10) Giddings, J. C. Dynamics of Chromatography, Part I: Principles and Theory;Marcel Dekker: New York, 1965.(11) Tallarek, U.; Bayer, E.; Guiochon, G. J. Am. Chem. Soc. 1998, 120, 1494-1505.(12) Knox, J. H.; Grant, I. H. Chromatographia 1991, 32, 317-328.(13) Gaš, B.; Štědrý, M.; Kenndler, E. Electrophoresis 1997, 18, 2123-2133.(14) Rathore, A. S.; Horváth, Cs. Anal. Chem. 1998, 70, 3069-3077.(15) Stilbs, P. Prog. Nucl. Magn. Reson. Spectrosc. 1987, 19, 1-45.(16) Kärger, J.; Pfeifer, H.; Heink, W. Adv. Magn. Reson. 1988, 12, 1-89.(17) Callaghan, P. T. Principles of Nuclear Magnetic Resonance Microscopy;Clarendon Press: Oxford, U.K., 1993.(18) Hoult, D. I.; Richards, R. E. J. Magn. Reson. 1976, 24, 71-85.was directly wound on a 35-mm-long, 1.57-mm-o.d. (381-µm- i.d.)PEEK tubing sleeve, which accommodates the 360-µm-o.d. (openor packed) capillary columns and which can be properly fixedwithin the setup (Figure 1a). For this purpose, a 300-µm-o.d.varnished copper wire was used in combination with a 200-µmdiameterNylon strandsthe latter keeping constant the distancebetween individual turns of the copper wiresto obtain a regular,∼11-mm-long solenoid (22 closely wound turns of the coppernylonpair). The gradient system including the rf coil assemblycan be rotated by 90° (i.e., from the y- into the x-direction, Figure1a). This horizontal configuration was used for all CE experimentsto prevent any pressure-driven flow component in the capillarydue to gravity.PFG-<strong>NMR</strong> Background. With this technique, the quantitativemeasurement of nuclear spin (hence, molecular) displacementsover an adjustable time ∆ relies on motion encoding by a pair ofidentical magnetic field gradients of amplitude (and direction) g. 19These are applied (pulsed) for a short time δ at the beginningand the end of this period ∆, respectively. The PFG-<strong>NMR</strong>time domain may cover a range for ∆ from a few millisecondsup to a few seconds. Thus, several parameters of the involvedfluid dynamics, e.g., dispersion in the axial and transversedirection 20-22 or the stagnant mobile-phase mass transfer, 23 canbe studied in packed beds over any discrete evolution time withinthis range. For a PFG-<strong>NMR</strong> experiment in the narrow gradientpulse approximation (δ , ∆), 24 the echo signal amplitude andphase E ∆ (g) depend on the nuclear spin self-correlation function,P s (r/r 0 ,∆), which is the conditional probability that a spin initiallyat r 0 has migrated to r over time ∆E ∆ (g) ) ∫F(r 0 ) ∫P s (r/r 0 ,∆) exp[iγδg‚(r - r 0 )] dr dr 0(1)Here, F(r 0 ) denotes the normalized density of the initial spinpositions, γ is the magnetogyric ratio of the nucleus considered(e.g., 1 H), and as usual, i 2 )-1. Introducing the concept of thedynamic displacement R (with R ) r - r 0 ) and defining anaveraged propagator P av (R,∆) as the ensemble-averaged probabilitythat any molecule will move a net distance R over time∆, 25 we obtainE ∆ (q) ) ∫P av (R,∆) exp(i2πq‚R) dR (2)The signal is acquired in the q-space (with 2πq ) γδg) which isthe space reciprocal to the dynamic (i.e., net) displacement R. 26The key feature of eq 2 is that it bears a direct Fourier relationbetween the normalized echo signal, E ∆ (q), and the averaged(19) Callaghan, P. T. Aust. J. Phys. 1984, 37, 359-387.(20) Tallarek, U.; Albert, K.; Bayer, E.; Guiochon, G. AIChE J. 1996, 42, 3041-3054.(21) Seymour, J. D.; Callaghan, P. T. AIChE J. 1997, 43, 2096-2111.(22) Stapf, S.; Packer, K. J.; Graham, R. G.; Thovert, J.-F.; Adler, P. M. Phys. Rev.E 1998, 58, 6206-6221.(23) Tallarek, U.; van Dusschoten, D.; Van As, H.; Guiochon, G.; Bayer, E. Angew.Chem., Int. Ed. Engl. 1998, 37, 1882-1885; Angew. Chem. 1998, 110,1983-1986.(24) Stejskal, E. O.; Tanner, J. E. J. Chem. Phys. 1965, 42, 288-292.(25) Kärger, J.; Heink, W. J. Magn. Reson. 1983, 51, 1-7.(26) Callaghan, P. T.; Eccles, C. D.; Xia, Y. J. Phys. E: Sci. Instrum. 1988, 21,820-822.Analytical Chemistry, Vol. 72, No. 10, May 15, 2000 2293
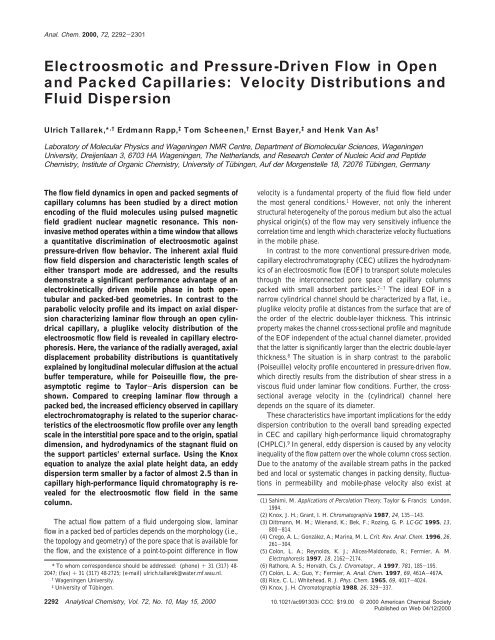
Figure 1. (a) Experimental setup used for the fluid dynamics studies in open and packed capillaries by pulsed field gradient nuclear magneticresonance on a 0.5-T ( 1 H 20.35 MHz) electromagnet. For CE and CEC measurements, the gradient system with the incorporated home-builtrf probe head is rotated into the x-direction and allowed to operate the capillaries in a horizontal orientation. The electrodes can be placed withina few centimeters from either edge of the gradient system and the capillary configuration thus may be as short as 0.4 m. (b) Fritless design ofthe packed column.propagator, P av (R,∆), of the fluid molecules. Thus, the completespectrum of molecular displacements over time ∆ can be obtainedby adequate sampling of q-space and subsequent Fourier transformationof E ∆ (q) with respect to q. For the measurement ofP av (R,∆) using the stimulated echo version of the PFG-<strong>NMR</strong>technique, we typically chose for 32 q-steps equidistant between+q max and -q max , with up to 24 phase-alternated averages at eachvalue of q for a sufficient signal-to-noise ratio (SNR). To minimizeerrors due to data discretization, the E ∆ (q) data were zero-filledto 64 points prior to Fourier transformation. 27 Truncation effectswere here avoided by acquiring E ∆ (q) properly into the noise levelat (q max . For the case that the distribution of molecular displacementsover time ∆ is a Gaussian, the PFG-<strong>NMR</strong> measurement(27) Marshall, A. G.; Verdun, F. R. Fourier Transforms in <strong>NMR</strong>, Optical, andMass Spectrometry; Elsevier: Amsterdam, 1990.(28) Callaghan, P. T.; Stepisnik, J. Adv. Opt. Magn. Reson. 1996, 19, 325-388.2294 Analytical Chemistry, Vol. 72, No. 10, May 15, 2000
yields an echo signal modulated in amplitude and phase by 28E ∆ (q) ) exp(i2πq‚u av ∆ - 4π 2 q 2 D∆)) exp(i2πq‚u av ∆)|E ∆ (q)| (3)The first term in the exponent of eq 3 can then be used to obtainthe column cross-sectional averaged velocity, u av (when q | u av ),while the second term accounts for the contribution due to theincoherent motion of the fluid. Thus, depending on the actualhydrodynamics, D may represent pure molecular diffusion in anopen capillary (D m ) or effective diffusion in the pore space of apacked bed (D eff ), as well as convection-driven apparent dispersion(D ap ).PFG-<strong>NMR</strong> Measurements in the Presence of an ElectricCurrent. With respect to the analytical techniques involving astrong axial electric field and steady electric current (I y )inthecapillary (of radius r c ), i.e., in the y-direction (Figure 1a), it shouldbe noted that (on the basis of the classical physics Biot-Savartlaw) this current produces a uniform radial magnetic field gradient(g x )inthex-direction, i.e., perpendicular to that of the currentgiven by 29|g x | ) ∂B z /∂x ≈ 0.2I y /r c2(4)(29) Holz, M.; Müller, C. J. Magn. Reson. 1980, 40, 595-599.(30) Holz, M.; Lucas, O.; Müller, C. J. Magn. Reson. 1984, 58, 294-305.(31) van de Goor, A. A. A. M.; Wanders, B. J.; Everaerts, F. M. J. Chromatogr.1989, 470, 95-104.This linear field gradient within the capillary does not interferewith the motion-encoding pulsed magnetic field gradients g whenthe latter are applied in the fluid flow direction (i.e., in they-direction such that g ⊥ g x ), because their vector product vanishes.Further, g x can be compensated for with the proper external shimcoil. 30 Electric currents typically involved in the CE and CECmeasurements were below 80 and 30 µA, respectively (r c ) 125µm), and the field gradient associated with this current density(I y /r c2 ) is very small compared to the magnetic field gradientamplitudes |g| ) g that are normally applied during the PFG-<strong>NMR</strong>measurements. Thus, the electric current manifests itself as asmall background gradient perpendicular to the fluid flow direction,without influence on the determination of the (axial) averagedpropagator, P av (R,∆).Implementation of CE, CHPLC, and CEC Equipment. Thepolyimide-coated, fused-silica capillaries were purchased fromPolymicro Technologies (Phoenix, AZ). For the study of electroosmoticflow, they were connected to a modular CE and (pressurizable)CEC system (Grom, Herrenberg, Germany; 0-30 kV,0-0.2 mA). A conventional HPLC pump with splitter (Sykam,Gilching, Germany) was used for measurements involving pressure-drivenflow. Borate buffers were prepared from a 0.01 M stocksolution of sodium tetraborate (Merck, Darmstadt, Germany) andadjusted to pH 9.0 at 26 °C with 2 M HCl. Freshly cut capillaries(between 0.55 and 0.7 m long) were first flushed with 0.1 M NaOHand then with buffer solution and were run for at least 30 min at15 kV/m. 31 Before use, the buffer solutions were filtered througha 0.2-µm syringe filter and then degassed with helium, followedby ultrasonication under vacuum. To ensure steady and reproducibleconditions within the <strong>NMR</strong> setup, e.g., to avoid sample heatingdue to factors other than the Ohmic loss in the capillary itself,forced air convection thermostats the system to 26 ( 0.5 °C(Figure 1a).In general, the electrokinetically or pressure-driven aqueousphase is continuously flowing through the column while thedisplacement probability distribution of water molecules ( 1 H 2 O)is measured over an adjustable observation time (∆) by 1 H PFG-<strong>NMR</strong>. The approach directly focuses on the fluid flow field(including diffusion over time ∆) under either condition. Whenthe inner radius of the open capillary (or typical flow channel ina packed bed) is considerably larger than the electric doublelayerthickness, the linear EOF velocity (u eo ) is given by theHelmholtz-Smoluchowski equation 32u eo ) µ eo E )-ɛ 0 ɛ r (ζ/η)E (5)Here, µ eo denotes the electroosmotic mobility and η the viscosityof the buffer solution, ζ the zeta potential (assumed to be constantover the whole surface), and E the electric field strength. ɛ 0 isthe permittivity of vacuum and ɛ r the relative permittivity of theelectrolyte solution. Typical measurement times of a single axialdisplacement probability distribution, P av (R,∆), are of the orderof 15 min.For dispersion studies in packed beds, specially preparedcapillaries 33 were slurry-packed with spherical-shaped, rehydroxylatedsilica particles (Hewlett-Packard, Newport, DE). The slurrywas prepared in methanol, and the material was consolidated for∼35 min at 250 bar (under ultrasonication). During this packingprocess, the totally porous, high-purity particles (d p ) 40 µm with9-nm average pore size) were retained in the 250-µm-i.d. (360-µm-o.d.) fused-silica columns by a taper (65-µm orifice) througha keystone effect. 34 Afterward, this tapered end served as the inletretainer of the packed capillary, while the tapered end of an opentube segment (150 µm i.d.) was fitted to the packed-bed outlet(Figure 1b). 33 Great care was taken that particles did not settlebefore injecting the slurry via an injection valve and slurryreservoir into the destination capillary. The final bed length ofthis fritless design was 20 cm.RESULTS AND DISCUSSIONFluid Flow Field in Cylindrical Open Tubes. Figure 2 showsrepresentative axial averaged propagator distributions of the buffersolution obtained for pure electroosmotic and pressure-driven flowthrough a 250-µm-i.d. fused-silica capillary. A rather short observationtime (∆ ) 14.2 ms) was chosen for these measurements,and column cross-sectional averaged axial convective displacementsclearly dominated over those due to radial moleculardiffusion, i.e., (2D m ∆) 1/2 , u∆ and r c .Two features become immediately evident: (a) P av (R,∆) forelectroosmotic flow shows a perfect Gaussian shape and all fluidmolecules apparently move at a single velocity (u eo ) with diffusionalbroadening only. (b) In the case of pressure-driven flow,the radially averaged axial displacement profile mostly reveals the(32) Lyklema, J. Fundamentals of Interface and Colloid Science, Vol. II: Solid-Liquid Interfaces; Academic Press: London, 1995.(33) Rapp, E.; Bayer, E. J. Chromatogr., A, in press.(34) Lord, G. A.; Gordon, D. B.; Myers, P.; King, B. W. J. Chromatogr., A 1997,768, 9-16.Analytical Chemistry, Vol. 72, No. 10, May 15, 2000 2295
can be well accounted for by the diffusion coefficient at the actualtemperature of the solution, D m (T). The Gaussian propagatorcharacterizing EOF thus becomesP av (R,∆) ) exp[ 1 -(R - u eo ∆)22πσ 2 2σ](8)2withσ 2 ) 2D m (T)∆ (9)Figure 2. Axial displacement probability distributions, P av(R,∆), ofthe fluid molecules in a 0.65 m × 250 µm i.d. (360 µm o.d.) fusedsilicacapillary. (a) Electroosmotic flow (E ) 23.1 kV/m, I ) 49 µA).(b) Pressure-driven flow. Mobile phase, borate buffer (2 × 10 -3 M,pH 9.0); observation time, ∆ ) 14.2 ms; ambient temperature, 26 (0.5 °C.boxcar shape readily anticipated for the velocity distribution underthese laminar flow conditions. 35 P av (R,∆) is far from a Gaussianand the no-slip boundary condition (i.e., u ) 0 at the capillarysurface), together with the contribution of molecular diffusion overtime ∆ of fluid molecules near the surface, is responsible for thenegative net displacements that are still observed (in sharpcontrast to the electroosmotic displacement profile). The localvelocity is therefore a function of the radial position in the capillary,as expressed by the Hagen-Poiseuille equationu(r) ) 2u av [1 - (r/r c ) 2 ] (6)where u av is the column cross-sectional average linear velocity,with u max ) 2u av (cf. Figure 2). The total variance of this propagatordistribution (including contributions from molecular diffusion andthe Poiseuille flow spread) is given by 35σ 2 ) 2D m ∆ + (u av ∆) 2 /3 (7)At ambient temperature (26 ( 0.5 °C) and in the absence ofany flow, we find the diffusion coefficient of water at D m )2.35 × 10 -5 cm 2 /s. 36,37 Thus, a total variance of ∼1266 µm 2is calculated for the pressure-driven displacement distributionshown in Figure 2. By contrast, a variance of σ 2 ) 2D m ∆ ) 66µm 2 may be predicted for the electroosmotic displacementdistribution when molecular diffusion is considered as the onlysource of axial dispersion. 38 However, from an analysis of the rawdata using eq 3, we calculate a variance of 78 µm 2 ; i.e., puremolecular diffusion at ambient temperature cannot accountquantitatively for the observed width of this Gaussian distribution(Figure 2). As we will demonstrate, the most probable explanationfor this fact is that the buffer temperature has increased due toJoule heating in the capillary and that the variance then obtained(35) Golay, M. J. E.; Atwood, J. G. J. Chromatogr. 1979, 186, 353-370.(36) Mills, R. J. Phys. Chem. 1973, 77, 685-688.(37) Weingärtner, H. Z. Phys. Chem. (N. F.) 1982, 132, 129-149.(38) Jorgenson, J. W.; Lukacs, K. D. J. Chromatogr. 1981, 218, 209-216.The (single) electroosmotic linear flow velocity is obtained fromthe center position of the distribution at R c ) u eo ∆. For example,an analysis of the measurement shown in Figure 2a gives u eo )2.29 mm/s. Note that column cross-sectional average velocitiesdiffer by a factor of 1.85 (Figure 2). Thus, for a velocity u av identicalto that in electroosmotic flow, the variance of the “diffusionweighted”boxcar distribution is expected around 420 µm 2 (eq7), which is still a factor of 5.4 larger than for the electrokineticallydriven fluid flow (and a factor of 6.4 larger than a purely diffusivecontribution at ambient temperature).In calculating the actual buffer temperature under a given setof conditions, we follow the treatment of Knox and McCormack. 39As a starting point, Figure 3 presents the EOF velocity and electriccurrent against the electric field strength (for natural and forcedair convection). With this forced convective cooling that wegenerally apply throughout the measurements, the equipmentactually performs (solid circles) between the limiting cases of aperfect forced cooling (linear behavior) and still air (open circles)regarding a temperature rise of the buffer solution.On the basis of eq 5 and Ohms law, a linear relationship ispredicted for both the EOF velocity and the electric current.However, above ∼10 kV/m, the degree of curvature increases athigher electric field strengths. It is important to note that thedeviation from linearity observed for u eo vs E exactly parallels thatfor I vs E; i.e., a plot of u eo vs I, in turn, is linear over the wholerange of data. 39-41 Figure 4 shows the variance and apparentdispersion coefficient that characterize the Gaussian displacementdistributions obtained with forced air cooling at the respectivefield strength (open circles). At moderate values (below 10 kV/m), the variance can be quantitatively explained by pure moleculardiffusion of water at ambient temperature (measured at 0 kV/m), which certainly is the ultimate limitation to performance inCE. When the EOF velocity starts to deviate from the linearbehavior above ∼10 kV/m (cf. Figure 3), the averaged propagatorstill retains its Gaussian shape, but with an increasing width(Figure 4). These combined results suggest that self-heating ofthe buffer solution is responsible for the curvature observed inFigures 3 and 4, most likely via the temperature dependence ofthe viscosity (u eo and I vs E, Figure 3) and the diffusion coefficient(σ 2 and D ap vs E, Figure 4) of the liquid.To confirm that the apparent dispersion coefficient (D ap )infact represents the molecular diffusion coefficient at the actualbuffer temperature, D m (T), and as such can fully account for the(39) Knox, J. H.; McCormack, K. A. Chromatographia 1994, 38, 207-214.(40) Terabe, S.; Otsuka, K.; Ando, A. Anal. Chem. 1985, 57, 834-841.(41) Tsuda, T.; Nomura, K.; Nakagawa, G. J. Chromatogr. 1983, 264, 385-392.2296 Analytical Chemistry, Vol. 72, No. 10, May 15, 2000
Figure 3. Electroosmotic flow velocity (u eo) and electric current (I) vs the electric field strength. The velocities are calculated from the centerposition of the Gaussian displacement probability distributions, P av(R,∆), found at R c ) u eo∆. Experiments: 250-µm-i.d. (360-µm-o.d.) fusedsilicacapillary, 2 × 10 -3 M sodium tetraborate buffer (pH 9.0); observation time, ∆ ) 60 ms (δ ) 3.5 ms).Figure 4. Displacement distribution variance (σ 2 ) and apparent dispersion coefficient (D ap ) σ 2 /2∆) against the electric field strength (forcedconvective air cooling, experimental conditions as in Figure 3). Both σ 2 and D ap are calculated from the PFG-<strong>NMR</strong> raw data acquired in theq-space using eq 3 (open circles). Solid line: Expected molecular diffusion coefficient of water at temperatures that were calculated from thecorresponding viscosity data, η(T), itself based on eq 5 and the u eo vs E data shown in Figure 3 (solid circles).observed distribution variance, this temperature has to becalculated. It is based on the nonlinearity of the u eo vs E data itself(Figure 3). Considering the temperature dependence of theviscosity and neglecting a variation of ɛ r ζ with temperature, whichmay be justified by the linearity of u eo with I, 39,40 the actual slopedefined by eq 5, i.e., u eo /E )-ɛ 0 ɛ r ζ/η(T) can then account forany deviation from linear behavior by a decrease of the bufferviscosity at the respective level of heat dissipation in the capillary.In the initial linear domain of that curve (Figure 3), the slopeis determined by the viscosity at ambient temperature. For water,this value is readily available 42 (η ) 0.8705 cP) and providesɛ 0 ɛ r ζ/η(26 °C). With this information, η(T) and thus the actualtemperature can be calculated for any u eo -E pair in the nonlinearregion. These temperatures are then used to estimate the trendin molecular diffusivity, D m (T). Both the viscosity 42 and thediffusion coefficient 36,37 of water are very accurately known as afunction of the temperature that facilitates the conversion of u eoat E to T and D m (T) via η(T). Following this procedure, Figure 4(42) Handbook of Chemistry and Physics, 66th ed.; CRC Press: Boca Raton, FL,1986-1987.Analytical Chemistry, Vol. 72, No. 10, May 15, 2000 2297
shows the expected increase of the molecular diffusion coefficientof water (solid line) in comparison with the experimental data.Calculated temperatures cover a range from 26 to 42 °C; i.e., wefind a temperature increase of ∼16 °C above ambient at thehighest power level in the capillary (which is EI ) 2.42 W/m atE ) 31.4 kV/m and I ) 77 µA; Figure 3). The striking feature isthat the measured distribution variance and the apparent dispersioncoefficient can be well accounted for by the temperaturedependence of the molecular diffusivity, and there is no need topropose any contribution of a laminar flow component or effectof a radial temperature gradient in the capillary lumen (at leastwithin the moderate temperature range encountered here). In fact,the experimental data presented in Figures 3 and 4 suggest a plugflowprofile for electroosmosis with axial dispersion only due tomolecular diffusion (as implied by eqs 8 and 9). The results agreewith Raman spectroscopic measurements of temperature gradientsin operating CE capillaries. 43 Those studies have shown that, ifthe average operating temperature is not 25 °C or more aboveambient, radial gradients are small enough that the associatedTaylor dispersion can be neglected.A similar conclusion about the temperature effects in CE wasreached by Knox and McCormack, 39 who showed that theincreased value of the diffusion coefficient (at the actual buffertemperature) can largely explain the reduced number of theoreticalplates obtained for a given separation. They pointed out thatthe differences still observed at higher linear velocities are partlydue to an extra column dispersion caused by injection and detectioneffects. 44,45 Clearly, these factors are absent in the presentPFG-<strong>NMR</strong> study in which the fluid flow field with any (intrinsic)source of dispersion is measured directly, i.e., without introducinga tracer. In this respect, our approach is similar to that of Paul etal., 46 who recently used fluorescence imaging of a photoactivatablerhodamine dye to demonstrate a pure electrokinetic flow behaviorin a 75-µm-i.d. fused-silica capillary (within the resolution of thetechnique). Images collected at a series of time delays after theuncaging event indicate a pluglike velocity profile, and peak widthswere found to have increased only by axial diffusion of the tracer.The caged fluorescent dye is uniformly seeded throughout theactive fluid phase (perfectly mixed) and can be activated at anyposition in the system. Thus, the injection of a dye, a process thatmay affect the initial conditions and dispersion characteristics, 47is circumvented.Starting with the situation in Figure 2 (∆ ) 14.2 ms), it is nowinstructive to follow the time evolution of either displacementdistribution and see the interplay between axial convection andradial diffusion. The (Gaussian) electroosmotic displacementprofiles shown in Figure 5a reveal a constant diffusion coefficient,i.e., D ap ≡ D m (28 °C) ) 2.47 × 10 -5 cm 2 /s at 15.1 kV/m (cf.Figure 4), and the increase in distribution variance scales exactlywith the increase in observation time (eq 9). As demonstrated inFigure 5b, the assumption of a perfect Gaussian shape isreasonable and hardly any symmetric deviation (indicative of aFigure 5. (a) Electroosmotic displacement profiles as a function ofthe observation time (∆ as indicated). E ) 15.1 kV/m, I ) 29 µA(u eo ) 1.34 mm/s). Mobile phase: 2 × 10 -3 M sodium tetraboratebuffer (pH 9.0); 0.7 m × 250 µm i.d. (360 µm o.d.) fused-silicacapillary. (b) P av(R,∆) at∆ ) 90 ms and best Gaussian fit (centerposition, R c ) u eo∆ ) 121 µm).laminar flow component) can be resolved by statistical analysis. 35These observations again indicate a very narrow (if any) velocitydistribution over the whole column cross section (on the inherenttime scale of the measurements), with diffusional broadening atthe actual buffer temperature only.In contrast to the already constant electroosmotic displacementpattern, the influence of radial diffusion in the regime (2D m ∆) 1/2, r c under now laminar flow conditions manifests itself in anexchange between the involved velocity extremes (cf. Figure 2).The Lagrangian correlation length of this flow velocity field ismuch higher than for an ideal EOF profile, and exchange by radialdiffusion proceeds over the whole capillary radius (125 µm), i.e.,on the time scale of a few seconds. Because the velocity gradientchanges with radial position, rather unique axial displacementprofiles are observed at increasing observation times (Figure6). 35,48 In the region of steep velocity gradients near the capillarysurface, for example, an inward diffusion leads to a bump at therear which then grows to consume the former boxcar shape. Dueto the fact that the velocity varies only quadratically with distancefrom the capillary axis (eq 6), the leading edge of the boxcarsubstantially retains its shape in this early stage. Finally, however,the central front also will lose its sharpness and the displacement(43) Liu, K.-L. K.; Davis, K. L.; Morris, M. D. Anal. Chem. 1994, 66, 3744-3750.(44) Sternberg, J. C. Adv. Chromatogr. 1966, 2, 205-270.(45) Huang, X.; Coleman, W. F.; Zare, R. N. J. Chromatogr. 1989, 480, 95-110.(46) Paul, P. H.; Garguilo, M. G.; Rakestraw, D. J. Anal. Chem. 1998, 70, 2459-2467.(47) Tsuda, T.; Ikedo, M.; Jones, G.; Dadoo, R.; Zare, R. N. J. Chromatogr. 1993,632, 201-207. (48) Shankar, A.; Lenhoff, A. M. AIChE J. 1989, 35, 2048-2052.2298 Analytical Chemistry, Vol. 72, No. 10, May 15, 2000
velocity is expected to be independent of the actual pore diameterand shape and this spatial hierarchy of heterogeneity length scaleshas lost (at least substantially) its conceptual impact on fluiddispersion.With the PFG-<strong>NMR</strong> methodology presented in this work, axialdisplacement probability distributions of the fluid molecules aremeasured directly over discrete domains of time (∆) and space(total length of the rf coil; cf. Figure 1a). Consequently, the bulkapparent axial dispersion coefficients (D ap,a ) do not includecontributions from any effects other than due to the intrinsicdispersive nature of the flow field in this particular region of thecolumn packing. They are related to the reduced plate heightsvia the conventional relationship 54Figure 6. Axial displacement probability distributions, P av(R,∆), ofthe fluid molecules in laminar flow as a function of the observationtime (∆ as indicated). Note the higher averaged flow velocitycompared to Figure 2.distribution becomes a skewn Gaussian. 35 These observationsconcerning the underlying fluid flow field demonstrate that the(Gaussian) Taylor-Aris limit 49,50 for the axial dispersion of aninjected tracer pulse is valid only for sufficiently long capillariesor residence times, most conveniently expressed in terms of adimensionless minimum transit time. 51 For a pure electrokineticbehavior, by contrast, the characteristic length scale of velocityfluctuations in the mobile phase is of the order of the electricdouble-layer thickness, which is a few nanometers under the mosttypical conditions. Exchange of fluid molecules over this spatialdomain falls into the nanosecond regime and the total effect ondispersion must be extremely small (Figure 5). However, thecontribution from resistance to mass transfer in the mobile phasemay increase significantly when retention becomes more important,but is expected to be still smaller than in pressure-drivenflow, at any given value of the retention factor. 52,53The velocity distributions reported and characteristic lengthscales indicated for pressure-driven and electroosmotic flowthrough open cylindrical capillaries bear a close resemblence tothe so-called transchannel effect 10 in the interparticulate pore spaceof packed beds. It manifests itself as part of the eddy dispersioncontribution to the overall band spreading, which we considernext.Fluid Dispersion in Packed Capillaries. In laminar flowthrough a fixed bed, not only the transchannel effect betweenparticles, i.e., the distribution of velocities in individual interstitialflow channels with a considerably more complex geometry thancylindrical capillaries, but a fluctuation in packing density andpermeability on any time and length scale over the cross-sectionalarea of the column contributes to velocity extremes in the mobilephase. Although there exists a fairly continuous distribution ofthese scales in the interstitial pore space of the column, Giddings 10further divided them into a short-range and long-range interchanneleffect, as well as a transcolumn contribution. For electrokineticallydriven fluid flow, however, as implied by eq 5, the EOF(49) Taylor, G. I. Proc. R. Soc. (London) A 1953, 219, 186-203.(50) Aris, R. Proc. R. Soc. (London) A 1956, 235, 67-77.(51) Shankar, A.; Lenhoff, A. M. J. Chromatogr. 1991, 556, 235-248.(52) Martin, M.; Guiochon, G.; Walbroehl, Y.; Jorgenson, J. W. Anal. Chem.1985, 57, 559-561.(53) McEldoon, J. P.; Datta, R. Anal. Chem. 1992, 64, 227-230.h a ) (2/ν)(D ap,a /D m ) (10)The corresponding column cross-sectional average flow velocity(u av ) used to calculate the reduced flow velocity (ν) is derivedfrom the center position of the Gaussian propagator distribution(at R c ) u av ∆) in displacement spaceu av ) F v /ɛ T A ) R c /∆ (11)Because the fluid molecules have explored both the intraparticleand interparticle pore space environments, i.e., the associatedexchange is complete over time ∆, the total porosity of the packing(ɛ T ) appears in the denominator of eq 11. F v is the volumetricflow rate and A the cross-sectional area of the column.Kennedy and Knox 55 showed that a simple additive contribution,aν n , to the plate height equation can account for the combinedeffect of the four different scales of velocity extremes in the mobilephase distinguished by Giddings. 10 The exponent n is between0.25 and 0.35, but often taken as 0.33 in the chromatographicliterature. 56 The resulting plate height equation is known as theKnox equationh a ) b/ν + aν 1/3 + cν (12)This totally empirical correlation is in agreement with mostexperimental results, and for the moment we assume that it appliesto both our CHPLC and CEC dispersion data. The silica particleshave rather small pores (∼9 nm in diameter), and together withthe low buffer concentration used (10 -3 M), intraparticle convectionis not expected to be operative in CEC at any measurablelevel. A rough calculation of the electric double-layer thickness(∼10 nm) indicates a complete double-layer overlap. 4 Thus, anelectroosmotic perfusion 57,58 is considered as being inactive underthese conditions and any differences in plate height can then betraced back to velocity extremes that may exist in the interparticlemobile phase under pressure-driven and electroosmotic flowconditions. The results from a systematic study of the axialreduced plate height versus the reduced flow velocity in CEC and(54) Giddings, J. C. J. Chem. Phys. 1959, 31, 1462-1467.(55) Kennedy, G. J.; Knox, J. H. J. Chromatogr. Sci. 1972, 10, 549-556.(56) Knox, J. H. J. Chromatogr. Sci. 1977, 15, 352-364.(57) Li, D.; Remcho, V. T. J. Microcolumn Sep. 1997, 9, 389-397.(58) Venema, E.; Kraak, J. C.; Poppe, H.; Tijssen, R. J. Chromatogr., A 1999,837, 3-15.Analytical Chemistry, Vol. 72, No. 10, May 15, 2000 2299
Figure 7. Reduced axial plate height (h a ) H a/d p) versus thereduced flow velocity (ν ) d pu av/D m) for the CHPLC and CEC modes;solid line, eq 12. CHPLC (r 2 ) 0.997): a ) 0.14, b ) 1.25, c ) 0.07,h min ) 0.83, ν min ) 3.6. CEC (r 2 ) 0.996): a ) 0.06, b ) 1.26, c )0.04, h min ) 0.55, ν min ) 5.3. Capillary column: 250-µm-i.d. (360-µm-o.d.) fused silica. Packing: 40 µm rehydroxylated, sphericalshapedsilica particles. Aspect ratio, d c/d p ) 6.25. Buffer solution,10 -3 M sodium tetraborate (pH 9.13); observation time, ∆ ) 120 ms(δ ) 3.5 ms).CHPLC with the same column are shown in Figure 7, togetherwith the best fit of these data to the Knox equation. Theobservation time (∆ ) 120 ms) has been chosen high enough toinclude the total contribution of stagnant (diffusion-limited)intraparticle and interparticle (boundary layer) mobile-phase masstransfer in the variance of both propagator distributions. Theseare then adequately represented as being single Gaussians. 59Although the minimum plate height (h min ) in CHPLC, at a reducedflow velocity (ν min ) of 3.6, is already as small as 0.83, therebydemonstrating how efficient the fluid flow field is actually performingunder these conditions, the value achieved by CEC (at ν min )5.3) is still 1.6 times smaller. Starting with the eddy dispersionterm (aν 1/3 ), which accounts for a combination of transversediffusion and tortuous flow, 60 the interparticle charateristics of theEOF (in view of eq 5 and its validity), i.e., the temporal and spatialdomain of velocity extremes in the mobile phase, can explain themuch smaller a-term for electrokinetically driven fluid flow. Notsurprisingly, the b-term, which represents an obstructed axialmolecular diffusion, is identical for both separation modes. Thisparameter is related to the tortuosity factor of the interconnectedpore space in the column (τ) byb2 ) γ ) 1 τ ) D effD mwith D eff )∑D n ∆ nn(13)∑∆ nnIn the present case (no retention), the effective diffusion coefficient,D eff , is the time-weighted average of diffusion coefficientsin the intra- and interparticle pore space environments. 61 It should(59) Tallarek, U.; Vergeldt, F. J.; Van As, H. J. Phys. Chem. B 1999, 103, 7654-7664.(60) Knox, J. H. J. Chromatogr., A 1999, 831, 3-15.(61) Knox, J. H.; Scott, H. P. J. Chromatogr. 1983, 282, 297-313.be noted that the tortuosity factor is the squared of the tortuosityand the inverse of the obstruction factor, γ, which is oftenused in the chromatographic literature. 10 The value of γ ) 0.63(obtained under both conditions) is very typical for randomlypacked beds. 60 It is in an excellent agreement with the effectivediffusivity measured separately in the absence of any flow,D eff ) 1.43 × 10 -5 cm 2 /s, which gives γ ) 0.61 (D m ) 2.35 ×10 -5 cm 2 /s). The c-term remaining in the Knox equation mainlyincludes mass-transfer resistance from stagnant fluid entrainedin the deep tortuous pools of the intraparticle pore network.However, in creeping laminar flow through a packed bed (withnegligible turbulence), the stagnant fluid on the particles’ externalsurface and in the cusp regions between particles provides anadditional mass-transfer resistance and it makes particles effectivelyslightly larger. In this surrounding liquid film, moleculardiffusion normal to the surface is at least the dominating transportmechanism. 62 This contribution manifests itself in the stagnantmobile-phase mass-transfer kinetics and may actually explain itsflow rate dependence. 59,63 What, however, happens to the conceptof the stagnant boundary layer and associated interparticle fluidsideresistance to mass transfer in electroosmotic flow? Here, thespatial dimension of this diffusion-limited mass transfer externalto the particles is largely reduced and practically all the fluidexternal to the hard-sphere boundaries of the particles is flowing,except close to contact points between particles where the electricdouble layers may overlap completely. In laminar flow, a substantialfraction of the interparticle fluid can be regarded as beingstagnant and is an inverse function of the flow rate. This basicdifference in the hydrodynamically effective particle diameter or,vice versa, in the effective external porosity that is available forfluid flow, may explain differences in the c-term also underconditions that do not favor electroosmotic perfusion.The results concerning the parameters in the Knox equationare in qualitative agreement with data recently published by Wenet al. 64 Comparing the efficiency in CHPLC and CEC for anunretained neutral marker (acrylamide) in a 50-µm-i.d. columnpacked with 6-µm Zorbax ODS particles having 8-nm pores (aspectratio, 8.3), they reported a decrease in the a-term by a factor of2.5 for the CEC mode and a c-term 1.3 times smaller than inCHPLC. For the same material, but with 30-nm pores, thecorresponding decrease in a- and c-terms was by a factor of 3.0and 1.6, respectively. In their study, Wen et al. 64 used particleswith average pore diameter up to 100 nm (10 -2 M phosphatebuffer) and concluded that electroosmotic perfusion then contributessignificantly to the increased performance in CEC, documentedby a further decrease in the c-term as compared toCHPLC. We are currently performing PFG-<strong>NMR</strong> studies onintraparticle-forced electroosmotic flow in columns packed withlarge-pore materials, where the experimental approach presentedhere will be extremely helpful in revealing a perfusive electroosmoticfluid flow field at work.CONCLUSIONSThe open-tubular work indicates that superimposed onto aflat (i.e., pluglike) velocity profile over the column cross section,(62) King, C. V. J. Am. Chem. Soc. 1935, 57, 828-831.(63) Boyd, G. E.; Adamson, A. W.; Myers, L. S., Jr. J. Am. Chem. Soc. 1947, 69,2836-2848.(64) Wen, E.; Asiaie, R.; Horváth, Cs. J. Chromatogr., A 1999, 855, 349-366.2300 Analytical Chemistry, Vol. 72, No. 10, May 15, 2000
axial molecular diffusion presents the ultimate limitation toperformance in CE (for an unretained solute), and the plate heightbecomesh a ) 2D m (T)/d c u eo (14)Temperature effects were quantitatively characterized and canexplain, via the temperature dependence of the molecular diffusioncoefficient, the increasing variance of the Gaussian axial displacementprobability distributions recorded at higher electroosmoticflow velocities (and associated levels of heat dissipation in thecapillary).The low values of reduced plate height observed with boththe CHPLC and CEC modality (h a < 1) demonstrate the excellentperformance of the underlying fluid flow field in the packed bedregion, even with an aspect ratio of only 6.25. Compared to thepressure-driven mobile phase (h min ) 0.83), however, the electroosmoticflow shows a still superior efficiency (h min ) 0.55). It isattributed to the improved flow uniformity on any time and lengthscale over the whole column cross section and to the differencein the hydrodynamically effective particle diameter concerning thetotal fraction of stagnant fluid in the column and associated,diffusion-limited mass transfer. These effects, which affect thea- and c-terms in the Knox equation but leave unchanged theb-term, also explain the shift of the minimum of the CEC plateheight curve to higher reduced flow velocities.ACKNOWLEDGMENTU.T. gratefully acknowledges the award of a Marie CurieFellowship under the Training and Mobility of Researchers (TMR)Program from the European Union (Contract ERBFMBI-CT98-3437). This research was further supported by the EuropeanCommunity activity Large-Scale Facility <strong>Wageningen</strong> <strong>NMR</strong> <strong>Centre</strong>(Contract ERBCHGE-CT95-0066) and by the Technology FoundationSTW (Project WBI.3493), Applied Science Division of theDutch Science Foundation NWO.Received for review November 15, 1999. AcceptedFebruary 22, 2000.AC991303IAnalytical Chemistry, Vol. 72, No. 10, May 15, 2000 2301