(Activity Sheets)(PDF)
(Activity Sheets)(PDF)
(Activity Sheets)(PDF)

Create successful ePaper yourself
Turn your PDF publications into a flip-book with our unique Google optimized e-Paper software.
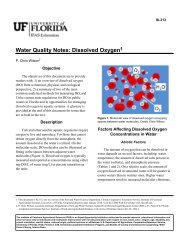
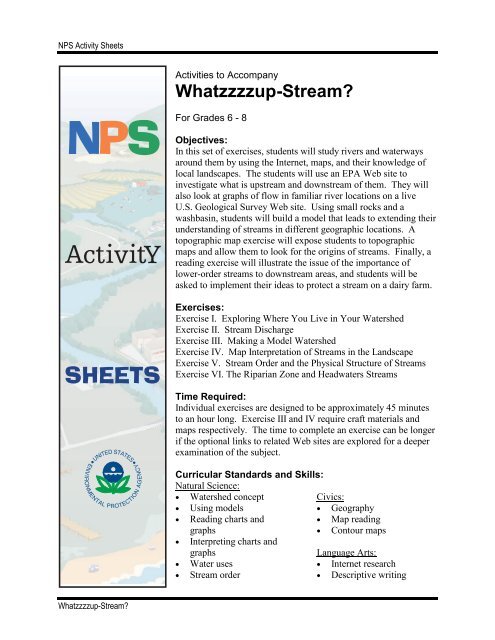
NPS <strong>Activity</strong> <strong>Sheets</strong>Exercise I.Exploring Where You Live in YourWatershedEveryone Lives in aWatershed!No matter where you live in theUnited States, or even in theworld, you live in a watershed.The rainwater that falls on yourbackyard drains to a stream,then into a river, and eventuallyinto the ocean. Some peoplelive very close to the coast andwater travels only a shortdistance before it reaches theocean. Others live fartherinland, and rainwater will haveto travel hundreds of milesbefore it reaches the ocean. Inthis exercise, you will look atwhere you live in yourwatershed. Are you near theheadwaters where yourwatershed originates, or are youfarther downstream? VisitEPA’s Surf Your WatershedWeb site(http://cfpub.epa.gov/surf/locate/index.cfm). Take some time toexplore the different things thisWeb site can tell you. Below,list three things you can find outfrom this Web site.1.Looking at the MapUnder the “Locate by Geographic Unit” heading on the web site,use the space provided to enter your ZIP code and then click on“Submit.” Then click on the 8-digit number for the watershedwhere you live.1. What is the name of your watershed?2. Compare the outline of the watershed to the map of your cityor county. Does it follow the same boundaries? If not, why not?What’s Upstream?Determine whether your watershed is aheadwaters watershed or whether otherwatersheds are present upstream of yourwatershed. To do this, scroll down to nearthe bottom of the Web page. Look in theleft column for “Other WatershedsUpstream.” Click on the name listed belowthis title. (If you see more than one name,just pick one of them.)3. What is the name of the watershedupstream from yours?Headwaters —What Are They?The headwaters of ariver are its source--the place where theriver first startsflowing.2.3.4. What would it mean if the word “none” was listed under the“Other Watersheds Upstream” title?Whatzzzzup-Stream?Exercise I
NPS <strong>Activity</strong> <strong>Sheets</strong>number into the box provided. Usually a graph can be provided for information collected for theprevious 31 days.Check out the option to download a presentation-quality graphPrint out a presentation-quality graph from the Web site.1. Does the graph have any sharp increases or decreases? What might these mean?2. Does the graph have gradual increases or decreases? What might these mean?Part BRepeat the steps in part A but this time choose agage location upstream or downstream (on the sameriver) from the first gage location. Print out apresentation-quality graph for this gage also.Compare the two graphs.3. Do you see any relationship between increasesand decreases in water flow on the two graphs?Part CIdentify a small stream that leads to your river (oridentify a larger river that is downstream of you).Print out a discharge volume graph for this river andcompare it with your graph from part A.Floods and droughts both have majoreconomic effects on the areas theyaffect.4. Which graph shows a larger discharge?Whatzzzzup-Stream?Exercise II
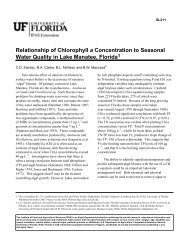
NPS <strong>Activity</strong> <strong>Sheets</strong>5. Can you find anything on your graph that might indicate that a drought or a flood has takenplace?Part DReturn to the “Surf Your Watershed”page for your watershed. Just belowthe Stream Flow link is a Water Uselink. Click on this link to see alisting of water withdrawals andreturns from various sources.Uses of Fresh Surface Water in the United StatesDomestic1%Commercial1%IndustryLivestock 6%1% Public Uses9%6. In your watershed, what water usewithdraws most of the water?Power49%Irrigation33%7. In your watershed, what water uses return water that could possibly contain pollutants?8. Look at the water use data for watersheds upstream and downstream from where you live.How do water uses upstream and downstream of the river differ?Whatzzzzup-Stream?Exercise II
NPS <strong>Activity</strong> <strong>Sheets</strong>9. How can water use upstream affect water use downstream?The United States uses100 billion gallons of water perday to irrigate crops.The average person in theUnited States uses 70 gallonsof water per day. Usually2.5 quarts of that water is fordrinking.Whatzzzzup-Stream?Exercise II
NPS <strong>Activity</strong> <strong>Sheets</strong>Exercise III.Making a ModelWatershed(Adapted from National GeographicWeb education modules athttp://magma.nationalgeographic.com/education/gaw/frwater/frwater_912_teacher.html#top)Materials NeededEach group of students will need:• Bucket• Blue marker• Aluminum foil• Water in a sprinkling can or spray bottle• Shallow washbasin or dishpan• Large and small rocks, chunks of wood, and/or boxesProcedureIn the shallow basin, arrange rocks, wood, or boxes higher on one end of thebasin than on the other. Cover the rocks with aluminum foil, pressing thefoil against the rocks to create a miniature landscape within the washbasin.Make sure the edges of the foil remain inside the tub—or you’ll create awaterfall! Your model should look like you filled a basin to the rim withlumpy mashed potatoes, then shoved half the potatoes to one end into alumpy mountain. Make different folds, routes, ridges, and valleys to forcethe “rainwater” to flow down different paths. Use a blue marker to draw theplace where you believe the main rivers will flow.Once your teacher gives you the word, use the spray bottle to make it “rain”over the land. Observe what happens when it rains. Once you have writtendown your observations, remove the foil from the rocks, remove the rocksfrom the tub, and empty the “rainwater” into a bucket.ObservationsWhat happens to the water as it begins to rain?Whatzzzzup-Stream?Exercise III
NPS <strong>Activity</strong> <strong>Sheets</strong>How do streams form?Fun Facts aboutWaterHow many streams form?Where do they form?In a 100-year period, awater molecule spends98 years in the ocean,20 months as ice, about2 weeks in lakes andrivers, and less than 1week in the atmosphere.Where does all the water end up after the rainstorm?All the freshwaterflowing in rivers and heldin lakes is only 1 percentof the water on Earth.AnalysisWhere do streams form?There is the same amountof water on Earth asthere was when Earthwas formed. The waterfrom your faucet couldcontain molecules thatdinosaurs drank.How many watersheds drained into your main river?The bathroom is theroom in the house wherethe most water is used.Whatzzzzup-Stream?Exercise III
NPS <strong>Activity</strong> <strong>Sheets</strong>What caused the water to flow in a certain direction?Where were the first-order streams located in your watershed?What happened to your main river as other streams joined it?If this were a real watershed, where would all the water end up at the conclusion of theexperiment?ConclusionsWrite a brief paragraph about how watercollects in a watershed.Whatzzzzup-Stream?Exercise III
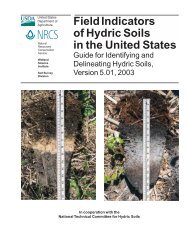
NPS <strong>Activity</strong> <strong>Sheets</strong>Example IV.Map Interpretation of Streams in theLandscapeWhat are all these linesanyway?Contour line: A line on a map that connectspoints on the land’s surface that have the sameelevation. If you were to walk along a contourline, you would not go uphill or downhill at all.Transect: A line that runs perpendicular to acontour line. If you were to walk on a transectline, you would walk either straight up or straightdown a slope.Understanding Contour Lines and LandformsAs a class, discuss how the following landformswould be indicated by contour lines on atopographic map.A cliffA flat meadowA mountainA riverGetting Started With the MapGet acquainted with your map. Find the map legend. What part of the country is represented byyour map?Find the scale on the map. What distance is represented by an inch?Locate a cliff, a mountain or hill, a river, and a meadow on your map. If you do not believe oneof the these landforms appears on your map, explain why.Locate as many first-order streams on your map as you can. How can you tell whether a streamis a first-order stream?Whatzzzzup-Stream?Exercise III
NPS <strong>Activity</strong> <strong>Sheets</strong>Are the streams you located intermittent or perennial? Showhow each is represented on the map.Types of StreamsIntermittent streams: Streams thatflow only during wet periods.Thinking It ThroughWhere do you find first-order streams on your maps?Perennial streams: Streams thatcontain water year-round.What are possible sources of water for first-order streams in mountains, low-lying swamp areas,desert areas, and areas close to the lower reaches of a river?Going a Bit FurtherCan you find places where water could flow as if in a stream, if it rained, but no stream has beenindicated? These are the places where contours indicate a fold or a dip between slopes.Why do you think no streams have been marked?Whatzzzzup-Stream?Exercise IV
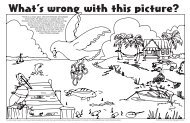
NPS <strong>Activity</strong> <strong>Sheets</strong>Example V.Stream Order and the Physical Structureof StreamsStream OrderVisit the Exploring the Environment Web page on Water Quality(http://www.cotf.edu/ete/modules/waterq/wqphysmethods.html) and answer the followingquestions.1. What is stream order?2. Determine the order ofstreams on the streamnetwork picture to the right.Indicate stream order bywriting a 1, 2, 3, 4, or 5.3. Look at the pictures of a first-, second-, third-, and fourth- order stream at the bottom of theWeb page. Fill out the chart comparing the stream types.Comparing Stream OrderStream Order First-Order Second-Order Third-Order Fourth-OrderShade(full, partial, orno shade)Width(narrow, very narrow,wide, very wide)Shape(straight, curvy)Whatzzzzup-Stream?Exercise V
NPS <strong>Activity</strong> <strong>Sheets</strong>Physical StructureLook at the chart you filled out above. This chart looks at some ways streams change as theycombine and form larger and larger rivers. Visit the Minnesota Shoreline Management Webpage (http://www.shorelandmanagement.org/depth/rivers/02.html) and read about how astream’s structure changes as it flows from its headwaters to its outlet.After reading the article, take some time to look at the graph “Three Longitudinal Zones andChannel Characteristics.” Answer the questions about how a stream changes as it flows down itscourse.Three Longitudinal Zones and Channel CharacteristicsBed material grain size: The size of the rocks,sand, and dirt that make up the bottom of thestream.Channel depth: A measure of how deep the streamis.Channel width: A measure of how wide the streamis.Drainage area: The amount of land from which astream gets its water.Mean flow velocity: The average speed at whichwater moves in a stream.Slope: How steep the land is where the stream isflowing.Stream discharge: The amount of water in astream.Whatzzzzup-Stream?Exercise V
NPS <strong>Activity</strong> <strong>Sheets</strong>1. What are the three river zones represented on the graph?2. In what zone would you probably find a first-order stream? What about a second-, third-, andfourth order stream?3. On the horizontal axis, label where you think each order of stream is most likely to be found.4. As stream order increases, what happens to the drainage area of the stream?5. As stream order increases, what happens to the slope of the stream?6. As stream order increases, what happens to the speed at which water flows in a stream?7. As stream order increases, what happens to the width of the stream?8. As stream order increases, what happens to the amount of water in a stream?9. As stream order increases, what happens to the stream’s channel depth?Whatzzzzup-Stream?Exercise V
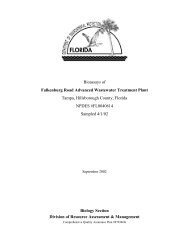
NPS <strong>Activity</strong> <strong>Sheets</strong>Example VI.The Riparian Zone and HeadwatersStreamsRiparian ZonesRiparian zones are the areas that border streams, rivers,lakes, and wetlands. They can be floodplains,streamside forests, or just plain streambanks. They areusually different from surrounding lands because theyhave unique soil and vegetation characteristics and arestrongly influenced by water. Riparian zones arebasically the interface between the water and the land,and they serve many functions, that make themvaluable to people.The riparian zone in this photo can beeasily identified by the trees growing in it.What Riparian Zones DoWater storage. Riparian zones are able to hold water during a flood when the water rises outand over the banks of the stream. This function prevents further flooding downstream and alsotraps sediments and nutrients, making the riparian area a very fertile place.Sediment retention. Sediment from upland erosion can be trapped and retained in the riparianzone, preventing it from reaching local waterways, where it is detrimental to stream habitat, fish,and downstream drinking water supplies.Nonpoint source pollution buffer. Although riparian buffers can’t absorb unlimited pollutionrunoff, they are effective at removing or storing a large amount of nutrients (nitrogen andphosphorus) and other contaminants. Riparian zones in agricultural areas have been shown to beextremely effective at reducing the amount of nutrients that reach local streams.Streambank stabilization. The root mass of trees, grasses, and shrubs helps to stabilizestreambanks and prevent them from eroding.Habitat. Riparian areas are often more diverse than the adjacent upstream areas because thisunique environment represents a gradient in vegetation, moisture, and soils that creates a numberof habitats. Twigs, branches, and leaves falling from the riparian vegetation into the water alsoprovide important in-stream habitat for aquatic organisms like insects and fish. This vegetationalso provides a food or energy source that is important to the entire aquatic food web.Riparian zones affect biota and the health of a lower-order or a headwaters stream toa great extent. We’ll explore this relationship more in the following section.Whatzzzzup-Stream?Exercise VI
NPS <strong>Activity</strong> <strong>Sheets</strong>First-orderStreams and TheirSurroundingsRestoring a First-Order Stream: The Soque RiverStreams that are out of balance with their surroundings can berestored. The Soque River is a good example. Changes in landuse resulted in an unhealthy stream that was washing awayfarmland at an alarming rate. An article on the Soque Riverrestoration is provided athttp://www.epa.gov/region04/water/wetlands/projects/soque.htmlPictures of the stages of restoration are athttp://www.epa.gov/region04/water/wetlands/projects/soqueepa.htmlWhat happened in the riparian zone of the Soque River that causedit to become unhealthy?First-order streams have avery strong relationship withtheir riparian zones.Because headwaters streamsare narrower in general thanhigher-order streams, theirbanks influence the quality ofthe stream water and theamount of sunlight in thewater. This in turn affects thebiotic community in the water,which determines the healthof the stream as it goes downits course.Rapidly Expanding Cities Affect StreamsIf you live in a headwaters watershed and your city is expanding rapidly—paving over fields andopen spaces for new developments like roads, malls, residences, housing estates—how do youthink the expansion will affect:The volume of water flowing into the headwaters streams?The quality of water flowing into the headwaters streams?The fish and other organisms currently living in headwaters streams?The temperature of the headwaters streams?What does that mean?The level of sediment in the headwaters streams?Use this Web site to look up any wordson river structure that you don’t know:www.amrivers.org/glossary/default.htm.Whatzzzzup-Stream?Exercise VI