flood plain information south creek, north creek, catfish - Sarasota ...
flood plain information south creek, north creek, catfish - Sarasota ...
flood plain information south creek, north creek, catfish - Sarasota ...

Create successful ePaper yourself
Turn your PDF publications into a flip-book with our unique Google optimized e-Paper software.
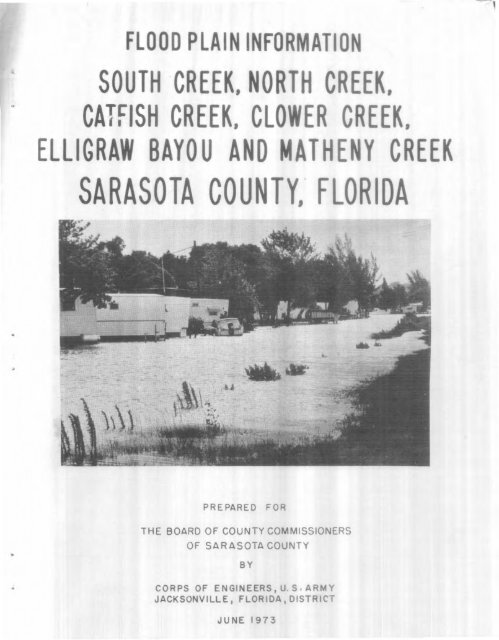
1FLOOD PLAIN INFORMATIONSOUTH CREEK, NORTH CREEK,CATFISH CREEK, CLOWER CREEK,ELLIGRAW BAYOU AND MATHENY CREEKSARASOTA COUNTY, FLORIDAPR E PARE DFORTHE BOARD OF COUNTY COMMISSIONERSOF SARASOTA COUNTYBYCORPS OF ENGINEERS,U.S,ARMYJACKSONVILLE I FLORIDA I DISTRICTJUNE 1973
FLOODSINSARASOTACOUNTYThis folder is an announcement of and supplementto the Flood Plain Information(FPI) Report for South Creek, North Creek,Catfish Creek, Clower Creek, ElligrawBayou, and Matheny Creek in <strong>Sarasota</strong>County, Florida. The purpose of the reportis to present the facts on <strong>flood</strong> potentialand <strong>flood</strong> hazards on those six <strong>creek</strong>s. Thiswi II provide a sound basis for land useplanning and for management decisionsconcerning <strong>flood</strong> <strong>plain</strong> utilization. Thelower portions of the six <strong>creek</strong>s are alsosubject to tidal <strong>flood</strong>ing. See the FPI Reportfor <strong>Sarasota</strong> County Coastal Areasdated May 1973 for tidal <strong>flood</strong> elevatiansin the lower portions of South Creek,North Creek, Catfish Creek, C lower Creek,Elligraw Bayou, and Matheny Creek.AI though the residents along the six <strong>creek</strong>shave suffered damage from moj or <strong>flood</strong>s inthe past, studies indicate that even larger<strong>flood</strong>s con occur in the future. Emphasis isgiven to future <strong>flood</strong>s in the FPI Report.Maps, profiles, and cross sections hovebeen included to il lustrate the possible e>
CONTENTSPREFACE-----------------------------------------------BACKGROUND INFORMATION--------------------------------Settlement----------------------------------------The Study Area------------------------------------ IDevelopments in the Flood Plain------------------- 3FLOOD SITUATION--------------------------------------- 4Sources of Data and Records----------------------- 4Flood Season and Flood Characteristics------------ 5Factors Affecting Flooding and its Impact--------- 5Obstructions to <strong>flood</strong>flows---------------------- 5Flood damage reduction measures----------------- 6Flood fighting and emergency evacuation plans--- 7Material storage on the <strong>flood</strong> <strong>plain</strong>------------- 7PAST FLOODS------------------------------------------- I 1Summary of Hi stor ica I F1oods---------------------- I IFlood Records------------------------------------- I IFlood Descriptions-------------------------------- 12FUTURE FLOODS----------------------------------------- 17Intermediate Regional Flood----------------------- 17Standard Project Flood---------------------------- 18Frequency----------------------------------------- 20Hazards of Large Upland Floods-------------------- 21Flooded areas and <strong>flood</strong> damages----------------- 21Obstructions------------------------------------ 23Velocities of flow------------------------------ 25Rates of rise and duration of <strong>flood</strong>ing---------- 25Photographs, Future Flood Heights------------------ 26GLOSSARY---------------------------------------------- 30
CONTENTS(Continued)TABLESTable23456Drainage Areas-------------------------------- 2Peak Flows for Intermediate Regional andStandard Project Floods---------------------Flood Elevations------------------------------Extent of Flooding----------------------------Elevation Data of Structures------------------19202324Rates of Rise and Duration (South Creekat U.S. 41 Bridge)--------------------------- 26PI atePLATESGeneral Map------------------------2 Flooded Area - Index Map3 Fiooded Area - South Creek4 Flooded Areas - Clower, Catfish,and North Creeks5 Flooded Areas - Matheny Creekand EI Ii graw Bayou6 High Water Profi les - Catfish,North and South Creeks7 High Water Profi les - Clower CreekEI ligraw Bayou and Matheny Creek8 Selected Cross Sections - Catfish,North and South Creeks9 Selected Cross Sections - Clowerand Matheny Creeks, EI I igrawBayou10 Flood Hydrographs - South CreekOpposite PageAt end of report
ICONTENTS(Continued)FiGURESFl gurePageU. S. Highway 41 Bridge Over South Creek------ 82 \./." S. Highway 41 Bridge Over North Creek------ 83 U, S. Highway 41 Br i dge Over Catt ish Creek---- 94 U. S. Highway 41 Box Culvert at Clower Creek-- 95 U. S. Highway 4i Box Culvert at Eiii g raw Bayou 106 U. S. Highway 41 Box Cu Ivert at Matheny Creek- 107 Flood of 1972--------------------------------- 168 Flood of 1972--------------------------------- 169 U. S. Highway 41 Bridge Over South Creek------ 2710 U. S. Highway 41 Bridge Over North Creek------ 27i I U. S. Highway 41 Bridge Over Catfish Creek---- 2812 U. S. Highway 41 Box Culvert at Clower Creek-- 2813 U. S. Highway 41 Box Culvert at EI I igraw Bayou 2914 U. S. Highway 41 Box Cu Ivert at Matheny Creek- 29
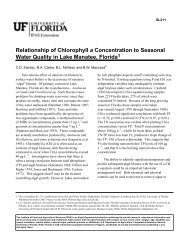
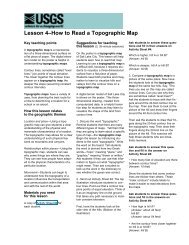
NRinglingNew PassSt Armand Key ~~~o..--LO CAT ION MAPllCALE IN UILESo ""LEGENDs ...-K~YWEllT___-... _ BASIN BOUNDARY--Causeway ~tt-="Casey KeyDEPARTMENT DF THE ARMYJACKSONVILLE DISTRICT, CORPS OF ENGINEEJACKSONVILLE,FLORIDAGENERAL MAPFLOOD PLAIN INFORMATIONSARASOTA COUNTY, FLORID,SCALE IN MILESo ·1 2 3 4JUNE 1973PLATE
PREFACEThe polLtion 06 SaJta..6o:m County c.ovVted by ;thi/, JtepoJt:t (6eep£.a:te 1) .u 6ubjed ;to 6loocUng 6/tOm Sou.:th CJteek, NoJt:th CJteek, Cat6.u hCJteek, ClowVt CJteek, E~gJtaw Bayou, and Matheny CJteek. The lowVtpolLtiOYl6 06 ;th06e 6:tJteam6 Me mo 6ubjed ;to udal 6loocUng 6JtOm ;theGui6 06 Mex-tc.o. See ;the FPI RepoJt:t 60Jt SaJta..6o:m CouYl:ty COM:tal AJteMdated May 1973 60Jt udal 6lood elevatioYl6 -tn ;the loweJt polLtiOYl6 06 ;the6:tJteam6 6:tu.cUed -tn ;thi/, JtepoJt:t. The pJtopVtUu along ;theu 6:tJteam6Me p~y Jtu-tde~, aglt-t~al, and c.oYmlVtUal and have beenmodVta:tely damaged by;the 6lood6 06 1960, 1962, 1971, and 1972. Theopen 6pac.u -tn ;the 6lood p~ wh-tc.h may c.ome undeJt pJtu6Me 60Jt6u.:tu.Jte development Me ex;teYl6-tve. AUhough £.aAge Mood6 have oc.c.u.Med-tn ;the pM;t, 6;tud-tu -tnd-tc.ate ;that: even wgeJt 6lood6 Me pOM-tble.Thi/, JtepoJt:t hM been pJtepMed bec.aMe a knowledge 06 6loodpo;te~ and 6lood haZMd6 .u -i-mpoJt:tant -tn land Me plann-tng and 60Jtmanagement dew-toYl6 c.onc.eJtn-tng 6lood plUn u.:t-tUzation. It: -tnc.fudua hi/,;tOlty 06 MoocUng -tn ;the Mea and -tdentin-tu ;th06e MeM ;that Me6ubjed ;to pOM-tble 6u.:tMe Mood6. Speual emphM.u .u g-tven ;to ;thue6lood6 ;thJtough map6, pho;togJtapM, p/t06ilu, and c.JtOM UC.UOYl6. TheJtepoJt:t dou no;t p/tOv-tde 6O~0Yl6 ;to Mood pJtoblem6; howeveJt, d dou6Mwh a 6u.dable bM.u 601t ;the adopuon 06 land Me c.oYl:t!tol6 ;to gu.-tde6lood plUn development and ;thelteby pIleveYl:t -tnteYl6-t6-tc.ation 06 ;the l066pIlob.iem6. It: will mo affi -tn -tdeYltin-tc.aUon 06 o:thelt 6lood damage Jteduc.tion;tec.hn-tquu wh-tc.h m-tght: be emboued -tn an oveJtall Flood PlunManagement (FPM) PJtOgJtam. O:thelt FPM pJtogJtam 6;tud-tu--;th06e 06 env-tltonmental~bu.:tu and ;the c.u.Ment and 6u.:tu.Jte land Me Jtole 06 ;the MoodplUn M pM;(: 06 d6 6u.MouncUng6--wouid mo pJt06d 6Jtom ;thi/, -tn60JtmaUon.At: ;the Jtequu;t 06 ;the SaJta..6o:m County BOMd 06 COYml-U6-toneJt6and ;the endoMement 06 ;the Flolt-tda VepM:tment 06 Na:tu.Jtal RUOMC.U, ;thi/,JtepoJt:t WM pIlepMed by Gee & JeYl6on, COYl6u.U-tng Eng-tneeJt6, Inc.., 06 Wu;tPalm Beac.h, Flolt-tda, 601t ;the Jac.k6onville V.u:tJt-td COItp6 06 Eng-tneeJt6undelt eoYltinu.-tng au.:tholtdy pIlov-tded -tn Sec.tion 206 06 ;the 1960 FloodCoYl:t!tol Ad, M amended.A66.u:mnc.e and c.oopeJtation 06 ;the U.S. Geolog-tc.al SUJtvey, U.S.National Oc.ean-tc. and A-tm06pheJUc. Adm-tn.u:tJr.aUon, SMMO:m Soil COYl6eJtvationV.u:tJt-td, U.S. Soil COYl6eJtvation SeJtv-tc.e, SaJta..6o:m County Eng-tneVt,SaJta..6ota Cou.Ylt:y rlann-tng and Zon-i-ng 066-tee, Valt-tOu.6 Mehitee:t-eng-tneeJt6-tJtm6, SMMO:ta ChambVt 06 COYmlVtc.e, SMMo:ta Building and Zon-i-ng Ve/OMt:meYlt:, SaJuL60ta H.i6,tolt-teal CoYml-UJ.Jion, SaJuL60ta HeJtald Tlt-tbu.ne and SalU16O:m JOMnal, ;the SeaboMd COM;t L-tne RailJtoad, S;ta;(:e 06 Flo«da VepMt:men;(: 06 TJtaYl6poJt;(:aUon, and plt-tva:te UUzeYl6 -tn 6upply-tng Me6u.l da:ta andpno;togJUl.pM 60Jt ;the pJtepMation 06 ;thi/, JtepoJt:t Me appJteUated.Ad~onal c.op-tu 06 ;thi/, JtepoJt:t c.an be obtUned 6Jtom ;the SaJUl.M:ta County BoMd 06 COYml-U6-toneJt6. The Jac.k6onville V.u:tJt-tc.:t COJtp6 06Eng-tneeJt6, upon Jtequu;t, will pJtov-tde ;teeWeal M6.u:mnc.e ;to plann-tngag enuu -tn ;the -tYl:teJtpJte.;(:a;Uon and u.6 e a6 ;the data pJtu eYl:ted M well Mplann-tng gu-tdanc.e and 6u.Jt:thu.Jt M6.u;tanee, -tnc.fuung ;the development 06adcUUonal ;tec.hn-tc.al -tn60Jtmation.
BACKGROUNDINFORMATIONSETILEMENTFlorida was first discovered by Ponce de Leon on EasterDay in 1512. Twenty-seven years later De Soto landed on the westcoast of the peninsula in the vicinity of what is now <strong>Sarasota</strong>.From that date unti I the middle of the nineteenth century explorersendeavored to colonize the state. Their efforts were opposed bythe Indians, mainly the Seminoles. Florida was purchased from Spainin 1821 and the Seminole War ended shortly thereafter. <strong>Sarasota</strong>County was formed from a section of Manatee County in 1921 and derivedits name from an old Indian legend which referred to a prominent part of the county's shore line known as "The Po int of Rocks."Through the years <strong>Sarasota</strong> County has grown steadi Iy.Tourism is the backbone of the county's economy. AI I types ofrecreational rental accommodations have been constructed alongU. S. Highway 41, many of which cater to tourists who enjoy watersports. Many retired persons, attracted to the area by the delightfulyear-round cl imate and the beautiful waterfront scenery,have become permanent residents. Because of man's desire to benear the water, development in the county is taking place in the<strong>flood</strong> <strong>plain</strong>.THESTUDY AREA<strong>Sarasota</strong> County is located on the west coast of Floridanear the middle of the peninsula and just <strong>south</strong> of Tampa Bay. Thisreport covers six relatively sma I I streams; known as South Creek,
North Creek, Catfish Creek, Clower Creek, 1I1 igraw Bayou, andM~theRY Creek. The study area is about seven mi les long andtwo to three mil es wide, Iy i n9 genera I Iy was I of the SeaboardCoast Line Rai Iroad tracks. The total draineJge area of the<strong>creek</strong>s studied in this report is aboui 35 square mi les and thedrainage area of each <strong>creek</strong> is shown in table I.TABLEIDRAINAGEARC:ASStreamDrain3ce AreaSquare Mi IeSouth Creek-----------------------------------North Creek------------------------------------Catfish Creek---------------------------------Clower Creek----------------------------------EI Ii graw 6ayou--------------------------------Matheny Creek----------------------------------18.63.86.61.01.82.7The <strong>creek</strong>s studied in this report originate in swampyareas at elevations ranging from 13- to 26-feet above mean sealevel. The <strong>creek</strong>s generally flow in westerly and <strong>south</strong>westerlydirections for varying short distances before d1scharging intoDryman Bay and Little <strong>Sarasota</strong> Bay. These bays separate themainland of the study area from Casey Key and Siesta Key, whoseland areas ~ouch the Gulf of Mexico. ~!ost of the study area isswampy and covered by a dense growth of water grass and mangrovewith occasional cypress heads.2
The climate of <strong>Sarasota</strong> County is sUbtropical. Theaverage annual temperature is about 74 degrees Fahrenheit.Summer temperatures are moderately high, but rarely reach maximumsof 95 degrees. Pleasant days and cool nights are usualduring the winter months, although minimums of 32 degrees orbelow occasionally occur during the months of November throughFebruary. The annual precipitation over the study area hasranged from a minimum of about 36 inches in 1944 to a maximumof about 76 inches in 1943, with an average annual rainfal I ofabout 53 inches. About 65 percent of the annual rainfal I occursin the four-month period June through September.DEVELOPMENTS IN THE FLOOD PLAINThe <strong>flood</strong> <strong>plain</strong> of the study area is sparsely developed.Residential and commercial development occurs along U. S. Highway41 and State Road 72. Located on the high ground are various typesof agricultural activities including truck farms, a few cattleranches, and some smal I citrus groves. Because of the rapid growthbeing experienced in <strong>Sarasota</strong> County, the development in the <strong>flood</strong><strong>plain</strong> of this study is expected to increase in the future.According to the United States census, the 1970 permanentpopulation of <strong>Sarasota</strong> County was 120,413, an increase of 56.6percent from the 1960 population of 76,895. There are no incorporatedcities in the study area. The projected future populationof <strong>Sarasota</strong> County is estimated at 215,000 in the year 2000 and300,000 in the year 2020.3.- -_._----------------------------_.
FLOODSITUATIONSOURCES OF DATA AND RECORDSThere are no stream gages on South Creek, North Creek,Catfish Creek, Clower Creek, EI I igraw Bayou, or Matheny Creek.The U. S. Geological Survey has a crest-stage indicator gage atthe Bah i a Vista Street br idge across Ph i I I i pp i Creek in Sa rasota.The gage has been in operation since 1960. Rainfal I records areavai lable for the study area from U. S. Weather Bureau Ci imatologicalData. Those records are based on rainfall gages thathave been in operation at various locations in <strong>Sarasota</strong> Countysin 'March 1930. Streamflow data in this report was based onprevious hydrologic studies conducted for Phi II ippi Creek andother simi lar streams.Newspaper fi les, historical documents, and the Phi II ippiCreek Survey Report prepared by the Corps of Engineers were searched,and local citizens were interviewed, for <strong>information</strong> concerning past<strong>flood</strong>s. These records have developed a knowledge of <strong>flood</strong>s whichhave occurred in the study area.Maps prepared for this report were based cn U. S.Geological Survey quadrangle sheets titled "Laurel, Florida,"dated 1943; "Bird Keys, Florida," dated 1944; "<strong>Sarasota</strong>, Florida,"dated 1944 and "Bee Ridge, Florida," dated 1947. Since thosequads do not show the current developmental and topographicchanges that have taken place, they have been updated from recenl(December 1971) aerial photographs of the area. Spot groundelevations in the study area were obtained from the <strong>Sarasota</strong>4
County Engineer to supplement the ground contours shown onthe quad sheets. Structural data on bridges and culvertswere obtained by field surveys in January 1973.FLOOD SEASON AND FLOOD CHARACTERISTICSMajor <strong>flood</strong>s in the study area usually result fromrainfal Is of varying durations associated with storms, or asequence of storms. Storms may occur at any time during theyear but are most frequent during the five summer months,June through October. The area is also subject to occurrencesof tropical hurricanes during the rainy season. Floodflows,ges can rise from normal f low to extreme <strong>flood</strong> peaks in arelatively short period of time with high velocities in themain channel of the streams.FACTORS AFFECTING FLOODING AND ITS IMPACTObstructions to <strong>flood</strong>flows - Natural obstructions to<strong>flood</strong>flows include smal I trees, brush and other vegetation growingalong the stream banks in <strong>flood</strong>way areas. Man-made encroachmentson or over the streams such as bridges and culverts canalso create more extensive <strong>flood</strong>ing than would otherwise occur.Representative obstructions to <strong>flood</strong>flows are shown in figures Ithrough 6.During <strong>flood</strong>s, smal I trees, brush and other vegetationgrowing in <strong>flood</strong>ways impede <strong>flood</strong>flows, thus creating backwaterand increased <strong>flood</strong> heights. Trees and other debris may be washed5
away and carried downstream to collect on bridges and otherobstructions to flow. As <strong>flood</strong>flow increases, masses of debrisbreak loose and a wall of water and debris surc)e~; cownstreamunti I another obstruction is encountered. Debris may collectagainst a bridge unti I the load exceeds its structural capacityand the bridge is destroyed. The I imited capacity of obstructivebridges or CUlverts, debris plugs at the culvert mouth ora combination of these factors retard <strong>flood</strong>flows and result in<strong>flood</strong>ing upstream, erosion around the culvert entrance and bridgeapproach embankments and possible damage to the overlying roadbed.In general, obstructions restrict <strong>flood</strong>flows and resultin overbank flows and unpredictable areas of <strong>flood</strong>ing, destructionof or damage to bridges and culverts and, an increased velocityof f low i mmed iate Iy downstream. It is i mposs i b Ie to pred ict thedegree or location of the accumUlation of debris; therefore, forthe purpose of this report, it was necessary to assume that therewould be no accumulation of debris to clog any of the bridge orculvert openings in the development of the <strong>flood</strong> profi les. SouthCreek, North Creek, Catfish Creek, Clower Creek, Ell igraw Bayou,and Matheny Creek are spanned 28 times by bridges and culverts.Pertinent <strong>information</strong> on U. S. Highway 41 bridges and culvertscan be found in table 5 on page 24. Some of these structuresare obstructive to <strong>flood</strong>flows.Flood damage reduction measures - There are no <strong>flood</strong>control works completed or planned by the Corps of Engineers inthe stUdy area. It is possible that certain works described inthe report titled "Work Plan for <strong>Sarasota</strong> West Coast Watershed"prepared by the <strong>Sarasota</strong> Soi I Conservation District for the6--_.-
<strong>Sarasota</strong> County Board of Commissioners, dated March 1961, andaffecting the <strong>flood</strong> <strong>plain</strong>s of South Creek, North Creek, andCatfish Creek may be completed in the near future.There are existing city and county zoning ordinances,bui Iding codes, and other regulatory measures designed specificallyfor the reduction of <strong>flood</strong> damages. This study has beenrequested so that it may be used as a basis for the developmentof additional <strong>flood</strong> <strong>plain</strong> management regulatory measures.Flood fighting and emergency evacuation plans - Althoughthere are not formal <strong>flood</strong> fighting or emergency evacuation plansfor the study area, provisions for alerting area residents andcoordinating operations of city and county publ ic service agenciesin time of emergency are accompl ished through the <strong>Sarasota</strong> CountyCivi I Defense Office. This office maintains communication withthe State Civi I Defense Headquaters National Weather Service atits control center and establ ishes a "f lood watch" during theearl iest stages of a <strong>flood</strong> threat. Subsequent <strong>flood</strong> fighting,evacuation, and rescue activities are coordinated on a county-widebasis with local pUbl ic agencies.Material storage on the <strong>flood</strong> <strong>plain</strong> - Since the primarydevelopment in the study area is agricultural and residential,there is not an appreciable amount of floatable materials storedon the <strong>flood</strong> <strong>plain</strong> lands. If floatable materials are stored on<strong>flood</strong> <strong>plain</strong> lands in the future, they may be carried away duringtime of <strong>flood</strong>s and cause serious damage to structures and couldclog bridge openings creating more hazardous <strong>flood</strong> problems.7
Figure 1U. S. Highway 41 Bridge Over South CreekFigure 2U. S. Highway 41 Bridge over North Creek8
Figure 3U. S. Highway 41 Bridge Over Catfish CreekFigure 4U. S. Highway 41 Box Culvert at Clower Creek9
Figure 5 U. S. Highway 41 Box Culvert at Elligraw BayouFigure 6 U. S. Highway 41 Box Culvert at Matheny Creek10
PAST FLOODSSUMMARY OF HISTORICAL FLOODSVery Iittle <strong>information</strong> is avai lable concerning large<strong>flood</strong>s that have occurred on South Creek, North Creek, CatfishCreek, Clower Creek, EI I igraw Bayou, and Matheny Creek. Inrecent years, <strong>flood</strong>s causing significant damage in Phi I lippiCreek are described to have occurred in 1960, 1962, 1971, and1972. The Ph ill i pp i Creek dra i nage bas in is located adjacentto the <strong>north</strong>ern boundary of the study area drainage basic.September 1962 <strong>flood</strong> was the most damaging of record in thePhi I I ippi Creek basin.TheFLOOD RECORDSInformation on historical <strong>flood</strong>s in the Phi IlippiCreek basin was obtained from a crest stage indicator gage maintainedby the U. S. Geological Survey on Phi II ippi Creek. Thereare no stream flow records for the <strong>creek</strong>s studied in this report.The stream gage located on Phi I I ippi Creek has been in existencesince 1960. Residents along the streams in the study area wereinterviewed and newspaper fi les and historical documents weresearched for <strong>information</strong> concerning past <strong>flood</strong>s. Informationfrom those sources was meager. However, the Phi I I ippi CreekSurvey Report provided <strong>information</strong> on <strong>flood</strong>ing in the <strong>Sarasota</strong>County area.II
FLOOD DESCRIPTIONSThe fol lowing are descriptions of known large <strong>flood</strong>sthat have occurred in the Phi i I ippi Creek basin, which is adjacentto the study area of this report.September 1960The summer of 1960 was one of the wettest of record inpeninsular Florida. The IO-week (July 21 to September 30) rainfali amounts for Phi I I ippi Creek basin averaged about 39 inches.The most intense rainfal I was associated with hurricane "Donna,"which passed over central Florida on September 10 and I I. Theheu.j rains during the latter part of July caused widespread<strong>flood</strong>ing throughout the area. Those <strong>flood</strong>waters had carely subsidedbefore the intense rainfall accompanying hurricane "Donna"sUbjected the area to major <strong>flood</strong>ing for the second time within60 days. Vi rtua I IY a I I the agr icu Itura I lands in the bas in wereinundated from I to 7 days. Extensive damages were sustained byurban developments. Many homes were <strong>flood</strong>ed and roads, bridges,and other pUbl ic faci I ities suffered heavy damages. Total estimateddamages from the <strong>flood</strong> in Phi I lippi Creek basin exceeded$1 mi II ion.Septembe r 1962This <strong>flood</strong> was the most damaging of record in thePhi I I ippi Creek basin. A low-pressure eel I which moved in fromthe Gulf of Mexico caused extremely heavy rainfal lover thecoastal area from Tampa to Naples on September 19-21. PhillippiCreek basin was in the area of the heaviest rainfal I. Over 16inches fell during a 4B-hour period. The highest stages and12
discharges of known record were recorded in the Phi I lippiCreek basin. The resultant <strong>flood</strong>ing was widespread anddisastrous throughout the basin. The County Sheriff'sDepartment, assisted by the County Publ ic Works Departmentand volunteer Civi I Defense units, conducted rescue operationsthroughout the area. Several hundred fami lies weremoved by those departments from their <strong>flood</strong>ed homes toareas of safety. Flood durations ranged from I to 3 daysIn areas adjacent to streams and drainage canals up toseveral weeks in some crop and pasture lands. Practicallyal! crop and pasture lands were Inundated to depths of 3feet or more. About 500 homes sustained minor to major<strong>flood</strong>ing. Many of those homes and a number of commercialinstal lations were <strong>flood</strong>ed to depths of 3 to 7 feet. VirtualIy al I streets and roads in and around <strong>Sarasota</strong> wereunder water. Several feet of water stood over main highwaybridges crossing Phi II ippl Creek and drainage canals. Estimateddamages to agriculture, private property, and pUbl icproperties totaled about $2.3 mi I lion.September 1971EXCERPT FROM THE SARASOTA HERALD TRIBUNE, 12 SEPTEMBER 1971"Ph i I I I pp 1 Cut-Through At US 41 Is Cred itedWith Preventing Serious Flooding As In '62""N i ne years ago th is month Sa rasota County areaswere under water after what waS termed 'the <strong>flood</strong> of thecentury.' Flooding conditions in some areas once more werereported after Friday's heavy downpour.13
"The worst <strong>flood</strong>ing in 1962 occurred at the oxbow bendwhere Phi II ippi Creek curved I ike a horseshoe around U. S. 41<strong>south</strong> of <strong>Sarasota</strong>. Since that time, the channel has beenstraightened and new bridges span the <strong>creek</strong>."By noon Fr iday, the current in Ph i II i pp i Creek wasterrific, but the new cut took it al I away. Brag al I you canabout that cut-through. Without it, The Landing would havebeen under water along with all the houses around it."Flood damage caused by Friday's downpour has not beenestimated yet, but it is expected to be minimal."The only section of road known to be closed becauseof <strong>flood</strong>ing are Rim Road east of East Road, Central Avenue<strong>north</strong> of Myrtle, and Ashton Road east of Mcintosh."A few culverts blew, but no bridges went out. Onething though - all the barricades in the county are in use nowat various places."One of the lessons learned from the 1962 <strong>flood</strong> is thenecessity for keeping the <strong>creek</strong>s and ditches open and free ofdebris. A crew of 10 prisoners from the <strong>Sarasota</strong> County jai Iworked around-the-clock Friday night and Saturday to removedebris and vegetation clogging sewers and drains in the Phi 11 ippiCreek area."The heavy rains this time brought a new kind of 'f reak<strong>flood</strong>ing' that left some of the low lying areas high and dry butinvaded other homes on high ground. Many homes and apartmentswere reported to be <strong>flood</strong>ed because of clogged drainage ditches. "14
June 1972EXCERPT FROM THE SARASOTA HERALD TRIBUNE, 20 JUNE 1972"HURR ICANE AGNES SMACKS PANHANDLE;FLOODING HEAVY IN SARASOTA, MANATEE.LOCAL DAMAGE HEAVY.""Whi ie the center of Hurricane Agnes, following a<strong>north</strong>erly course, passed approximately i50 mi les west of thecoastl ine of the <strong>south</strong> Florida peninsula, it created abnormaltides of from five to six feet high and caused intensifiedrainfal I. The National Oceanic and Atmospheric Administrationof the U. S. Department of Commerce records from three to seveninches of rainfai I in the state with almost five inches fal lingat <strong>Sarasota</strong> several days prior to and during Hurricane Agnes."~ .....- ..._._---15
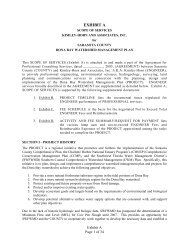
.•:::=;...Figure 7 Flood of 1972___5 -,---.-Figure 8 Flood of 197216
FUTUREFLOODSFloods of the same or larger magnitude as those thathave occurred in the past could occur in the future. Larger<strong>flood</strong>s have been experienced in the past on streams with simi largeographical and physiographical characteristics as those foundin the study area. Simi lar combinations of rainfall and runoffwhich caused these <strong>flood</strong>s could occur in the <strong>Sarasota</strong> County area.Therefore, to determine the <strong>flood</strong>ing potential of the study area,was necessary to consider storms and <strong>flood</strong>s that have occurredin regions of I ike topography, watershed cover and physical characteristics.Discussion of the future <strong>flood</strong>s in this report isI imited to those that have been designated as the IntermediateRegional Flood and the Standard Project Flood. The StandardProject Flood represents a reasonable upper I imit of expected<strong>flood</strong>ing in the study area. The Intermediate Regional Floodmay reasonably be expected to occur more frequently although itwi I I not be as severe as the infrequent Standard Project Flood.INTERMEDIATE REGIONAL FLOODThe Intermediate Regional Flood is defined as one thatcould occur once in 100 years on the average, although it couldoccur in any year. The peak flow of this <strong>flood</strong> was developedfrom analysis of streamflow and precipitation records and runoffcharacteristics of streams in the general area. Peak flows thusdeveloped for the Intermediate Regional Flood at selected locationsin the study area are shown in table 2. The <strong>flood</strong> hydrographfor South Creek is shown on plate 10.17
STA.NDARDPROJ en FLOODThe Standard Project Flood is defined as a major <strong>flood</strong>that can be expected to occur from a severe combination of meteorologicaland hydrological conditions that is considered reasonablycharacter·istic of the geographical area in which the studyarea is located, excluding extremely rare combinations. The Corpsof Engineers, in cooperation with the NOAA Weather Service, hasmade comprehensive studies and investigations based on the pastrecore; of experienced storms and <strong>flood</strong>s and has developed generali'dd procedures for estimating the <strong>flood</strong> potential of streams.Peak discharges for the Standard Project Flood at selected locationsin the study area are shown in tabie 2. The <strong>flood</strong> hydrographfor South Creek is shown on plate iO. The relative watersurface elevations for the Intermediate Regional Flood and theStandard Project Flood are shown on plates 6 and 7.18._ ..__._----------------
TABLE 2PEAK FLOWS FOR INTERMEDIATE REGIONALAND STANDARD PROJECT FLOODSLocationIntermed Iate StandardRiver Dra Inage Reglona I Flood Project FloodMi Ie Area Discharge Dischargesq. mi. cfs cfsSouth CreekAt Mouth 0 18.6 I ,560 2,040At Ra I Iroad 2.0 14.7 I ,250 I ,630North CreekAt Mouth 0 3.8 370 490Catfish CreekAt Mouth 0 6.6 600 800At Ra i Iroad 2.7 4.2 410 550Clower CreekAt Mouth 0 1.0 140 190EI I Igraw BayouAt Mouth 0 1.8 220 300MaTheny CreekAt Mouth 0 2.7 300 40019
Table 3 shows a <strong>flood</strong> elevation comparison betweenthe Intermdiate Reqional and Standard Project Floods at theupstream and downstream side of the U. S. Highway 41 bridgesand culverts over the six <strong>creek</strong>s studied in this report.TABLE 3FLOODELEVATIONSLocationIntermediateRegional Flood(al Standard Project Flood(alDownstream Upstream Downstream UpstreamSouth Creek Bridge 2.7 5. I 3.3 6.1North Creek Bridge 2.6 2.7 3.0 3. ICatfish Creek Bridge 6.9 7. I 8.6 8.7Clower Creek Culvert 8.7 8.8 9.2 9.3EI Ii graw Bayou Culvert 1.3 1.6 1.3 I .9Matheny Creek Culvert 2.4 2.5 3.0 3. I(a 1 Feet, mean sea level datumFREOUE~ICYIT is not practical to assign frequencies to a StandardProject Flood. A <strong>flood</strong> of this magnitude would be rare; the combinationof forces necessary for occurrence would be extremely infrequent.A <strong>flood</strong> of this magnitude, however, could happen at anytime. A <strong>flood</strong> larger than the Standard Project Flood is also possible,but the combination of factors necessary to produce such a<strong>flood</strong> would be extremely rare.20
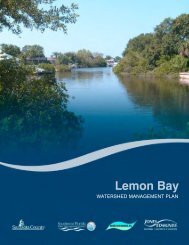
HAZARDS OF LARGE UPLAND FLOODSThe extent of damage caused by any <strong>flood</strong> depends on thetopography of the area <strong>flood</strong>ed, depth and duration of <strong>flood</strong>ing,velocity of flow, rate of rise and developments in the <strong>flood</strong> <strong>plain</strong>.An Intermediate Regional or Standard Project Flood on South Creek,North Creek, Catfish Creek, Clower Creek, EI ligraw Bayou, and MathenyCreek would result in inundation of residential, commercial, andagricultural sections in the study area. Deep <strong>flood</strong>water flowingat high velocity and carrying floating debris would create conditionshazardous to persons and vehicles attempting to cross <strong>flood</strong>edareas. In genera I, <strong>flood</strong>water three or more feet deep and f low i ngat a velocity of three or more feet per second could easi Iy sweepan ,'cult person off his feet, thus creating definite danger of injuryor drowning. Rapidly rising and swiftly flowing <strong>flood</strong>watermay trap persons in homes that are ultimately destroyed, or invehicles that are ultimately submerged or floated. Waterlinescan be ruptured by deposits of debris and the force of <strong>flood</strong>waters,thus creating the possibi I Ity of contaminated domestic water suppiies. Damaged sanitary sewer I ines could result in the pollutionof <strong>flood</strong>waters, creating health hazards. Isolation of areas by<strong>flood</strong>water could create hazards in terms of medical, fire, or lawenforcement emergencies.Flooded areas and <strong>flood</strong> damages - The areas in <strong>Sarasota</strong>County covered by this report that would be <strong>flood</strong>ed by the StandardProject Flood are shown on plate 2, which is also an index map toplates 3, 4, and 5. Areas that would be <strong>flood</strong>ed by the IntermediateRegional and Standard Project Floods are shown in detai I on plates 3through 5. The actual I imits of these overflow areas may vary somewhatfrom those shown on the maps because the contour interval andscale of the maps do not permit precise plotting of the <strong>flood</strong>ed21- . ..._ .. 00.''._. _
area tJOUneJdl il" 'I~I(' ,jr('dS that w'c1uld t,p t 'Iocderj by the Intermedi;lte1'~('oicH, ,~,!nl;:=,rd tlro.ject fln
Table 4 shows the approximate number ot acres andstructures <strong>flood</strong>ed within the study I imits by the IntermediateRegional and Standard Project Floods. These figures do notreflect those <strong>flood</strong>ed areas and structures which are outsidethe study limits.TABLE 4EXTENT OFFLOODINGFloodNumber ofStructures FloodedFlooded Area(Acres)Flu i It-up Area(Acres)Intermediate Regional989042Standard Project121,33060Obstructions - During <strong>flood</strong>s, debris collecting at bridgesand culverts could decrease their carrying capacity and cause greaterwater depths (backwater effect) upstream of these structures. Sincethe occurrence and amount of debris are indeterminate factors, onlythe physical characteristics of the structures were considered inpreparing profi les of the Intermediate Regional and Standard ProjectFloods. Simi larly, the maps of <strong>flood</strong>ed areas show the backwatereffect on obstructive bridges and culverts, but do not reflect increasedwater surface elevation that could be causee by debris coi-Iect ing aga i nst the structures, or by depos it i on of s i It in thestream channel under structures. Of the 28 bridges and culvertscrossing the streams in the study area, most of them are obstructiveto the Intermediate Regional Flood and even more obstructive to theStandard Project Flood. Table 5 I ists water surface elevations atselected bridges and culverts that may be restrictive during <strong>flood</strong>flows.23
TABLE 5ELEVATION DATA OF STRUCTURESCulverts and Bridges Across South Creek, North Creek,Catfish Creek, Clower Creek, EI ligraw Bayou, and Matheny CreekWater Surface Elevation (a)Mi leage Under- (a) Low Bridge (a) Intermed i ate StandardIdentification Above Clearance Approach Regional ProjectMouth Elevation Elevation Flood FloodS'cth Creek BridgeU. S. Highway 41 0.6 9.0 11.0 5. I 6. INorth Creek Bri~L. S. Highway 41 0.9 7.2 10.0 2.7 3. ICatfish Creek BridgeU. S. Highway 41 0.7 9.4 10.5 7. I 8.7Clower Creek Cu IvertU. S. Hi ghway 41 0.5 11.8 15.8 8.8 9.3EI I i graw Bayou CulvertlI. S. Highway 41 0.3 6.6 10.5 1.6 1.9MCltheny Creek Cu Ivertu. S. Highway 41 0.4 7.3 14.5 2.5 3. I(a) Feet, mean sea level datum24
Velocities of flow - Water velocities during <strong>flood</strong>sdepend largely on the size and shape of the cross sections,conditions of the stream and the bed slope, al I of which varyon different streams and at different locations on the samestream. During an Intermediate Regional Flood, velocities ofmain channel flow in the upper reaches of the streams in thestudy area would be 3 to 4 feet per second. In the lowerreaches, the velocities would be somewhat higher averaging 2to 12 feet per second. It is expected that velocity of flowduring a Standard Project Flood would be sl ightly higher thanduring an Intermediate Regional Flood. Overbank flow in thestudy area would be less than 5 feet per second and averageabout foot per second. Water flowing at 2 feet per secondor less would deposit debris and si It.Rates of rise and duration of <strong>flood</strong>ing - Intenserainfal Is that accompany hurricanes and other severe stormfronts usually produce the <strong>flood</strong>s occurring in <strong>Sarasota</strong> County.Thus, with each hurricane that effects the study area, two typesof <strong>flood</strong>ing occur, rainfall and tidal. Rainfal I type <strong>flood</strong>sgenerally rise slowly and stay out of banks for long periodsof time; whereas tidal type <strong>flood</strong>s generally rise quickly andrecede quickly. For the Intermediate Regional and StandardProject Floods at South Creek, table 6 gives the maximum rateof rise, height of rise (from critical stage level to maximum,<strong>flood</strong>flow levell, time of rise (time period corresponding toheight of rise), and duration of critical stage (period of time<strong>flood</strong>ing is above critical stage level l.25.....•....-_._--------------------------
TABLE 6RATES OF RISE AND DURATION(South Creek at U.S. 41Bridge)MaximumHeightTimeDurationFloodRate ofRiseofRiseofRi seofCritical Stageft/hrtthrshrsIntermediate RegionalFlood0.22.628103Standa-d Project Flood0.23.830120PHOTOGRAPHS, FUTURE FLOOD HEIGHTSThe levels that the Intermediate Regional and StandardProject Floods are expected to reach at various locations in thestudy area are indicated on the tol lowing photographs.26---------------------------
U. S. Highway 41 Bridge Uver South CreekFigure 10 U. S. Highway 41 Bridge Over North Creek27
Figure 9 U. S. Highway 41 Bridge Uver South CreekFigure 10 U. S. Highway 41 Bridge Over North Creek27
Figure 13U. S. Highway 41 Box Culvert at Elligraw BayouFigure 14 U. S. Highway 41 Box Culvert at Matheny Creek29
GLOSSARYBackwater. The resulting high water surface in agiven stream due to a downstream obstruction or high stagesin an intersecting stream.i nf Iuence.Estuary. An inlet or arm of the sea subject to tidalFlood. An overflow of lands not normally coveredby water and that are used or usable by man. Floods have twoessential characteristics: The inundation of land is temporary;and the land is adjacent to and inundated by overflow from ariver, stream, ocean, lake, or other body of standing water.Normally a "<strong>flood</strong>" is considered as any temporaryrise in stream flow or stage, but not the ponding of surfacewater, that results in significant adverse effects in thevicinity. Adverse effects may include damages from overflowof land areas, temporary backwater effects in sewers andlocal drainage channels, creation of unsanitary conditionsor other unfavorable situations by deposition of materialsin stream channels during <strong>flood</strong> recessions, rise of groundwatercoincident with increased stream flow, and otherproblems.Flood Crest.The maximum stage or elevation reachedby the waters of a <strong>flood</strong> at a given location.Flood Peak. The maximum instantaneous discharge ofa <strong>flood</strong> at a given location. It usually occurs at or near thetime of the <strong>flood</strong> crest.30
Figure 13 U. S. Highway 41 Box Culvert at Elligraw BayouFigure l4 U. S. Highway 41 Box Culvert at Matheny Creek29
GLOSSARYBackwater. The resulting high water surface in agiven stream due to a downstream obstruction or high stagesin an intersecting stream.influence.Estuary. An inlet or arm of the sea subject to tidalFlood. An overflow of lands not normally coveredby water and that are used or usable by man. Floods have twoessential characteristics: The inundation of land is temporary;and the Iand is adjacent to and inundated by overf Iow f rom ariver, stream, ocean, lake, or other body of standing water.Normally a "<strong>flood</strong>" is considered as any temporaryrise in stream flow or stage, but not the ponding of surfacewater, that results in significant adverse effects in thevicinity. Adverse effects may include damages from overflowof land areas, temporary backwater effects in sewers andlocal drainage channels, creation of unsanitary conditionsor other unfavorable situations by deposition of materialsin stream channels during <strong>flood</strong> recessions, rise of groundwatercoincident with increased stream flow, and otherproblems.Flood Crest.The maximum stage or elevation reachedby the waters of a <strong>flood</strong> at a given location.Flood Peak. The maximum instantaneous discharge ofa <strong>flood</strong> at a given location. It usually occurs at or near thetime of the <strong>flood</strong> crest.30
Flood Plain. The areas adjoining a river, stream,waterccurse, ocean, lake, or other body of standing waterthat hove been or may be covered by <strong>flood</strong>water.Fiood Profi Ie. A graph showing the relationship ofwater surface elevation to location, the latter generally expressedas distance above mouth for a stream of water flowingin an open channel. It is generally drawn to show surface elevation for the crest of a specif ic <strong>flood</strong>, but may be p,-epa redfor conditions at a given time or stage.Flood Stage. The stage or elevation at which overflowof the natural banks of a stream or body of water beginsin Ihe reach or area in which the elevation is measured.Hurricane. An intense cyclonic windstorm of tropicalorigin in which winds tend to spirai inward in a counterclockwisedirection toward a core of low pressure, with maximum surfacewind velocities that equai or exceed 75 mi les per hour (65 knots)for several minutes or longer at some points. Tropical stormis the term appl ied if maximum winds are less than 75 mi lesper hour.Hydrograph. A graph showing flow values against timeat a given point, usually measured in cubic feet per second.The area under the curve indicates total volume of flow.Intermediate Regional Flood. A <strong>flood</strong> having an averagefrequency of occurrence in the order of once in 100 years althoughthe <strong>flood</strong> may occur in any year. It is based on statistical analysesof stream flow records avai lable for the watershed and analysesof rainfal I and runoff characteristics in the general regionof the watershed.31- ----,._._----------------------------
Left Bank. The bank on the left side of a river, stream,or watercourse, looking downstream.Right Bank. The bank on the right side of a river,stream, or watercourse, looking downstream.Standard Project Flood. The <strong>flood</strong> that may be expectedfrom the most severe combination of meteorological and hydrologicalconditions that are considered reasonably characteristic of thegeographical area in which the drainage basin is located, excludingextremely rate combinations. Peak discharges for these <strong>flood</strong>s aregenerally about 40 - 60 percent of the Probable Maximum Floods forth8 same basins. As used by the Corps of Engineers, Standard ProjectFloods are intended as practicable expressions of the degreeof protection that should be sought in the design of <strong>flood</strong> controlworks, the fai lure of which might be disastrous.Underclearance Elevation. The elevation at the top ofthe opening of a culvert, or other structure through which watermay flow along a watercourse.32
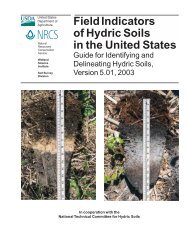
Sarasoto 0NRinglingNew PassSt Armand Key ....~~f:: ...1Z:$Q......LEGEND___ FLOODED AREA-Midnight--- ./ QPLATE 5 c:::>DEPARTMENT OF THE ARMYJACKSONVILLE DISTRICT, CORPS OF ENGINEERSJ4CKSONVILLE,FLORIDAFLOOD PLAIN INFORMATIONFLOODED AREA-INDEX MAPElliGRAW BAYOU; CATFISH CREEKNORTH CREEK A NO SOUTH CREEKSfJ,Ri\SOTACOUNTY, FLORIDASCALE IN 1111LESo 2 3 c. 5JUNE 1973 PLATE 2
"•c • ••~- .I - -.'.~. .""I"-.~".~ .. ",,,,~"'.~!J,., "LEGENDOVERFLOWREGIONALc:::J{'NTERMEDIATEFLOODLIMITSSTANDARDPROJECTFLOODBee Ridge, l,"~'. 1~ ..""I- ~."""",'"M +1MILES ABOVF MOUTHCROSS SECTION, SEE PLATES 8 AND 9.,.- 2 0- GROUND ELEVATION CONTOUR iN FEET M. S. L.,.II:vi, , ,,,- , . ,'''_.1' ..,1• , ... : ,1.. ,-,',-'{•. ,,,.- ,, ," ,,+~-,•-t·,, I,--'I." (tl"_"'~...LIM) T ,OF,-,.'"""~,M;,(,r..J,. , ",\• ,.STUDYI",•,,"p..........._--...---R"",-,....)•...~.~..,-"'...~'~...._..:::::..~~--"'"-=· ','i' ", , \ ,'; I r \.' ,"1 j'~ : or I t_i l I _'" I, - - _ ' I \ ...../ ,I,) 0• (.,' I'., "-", ~ ... I,' I J... t"', " .......,I r.....::- '.' ': _./ ~ /1' ..... - ,. _ '. J.I 0c' ""::, I • ,_. ,. .. ofb ......... , .r..r '~ L_L....l...._...:_~ _MATCH LINE PLATE 4JtNC,'... · ~ " ~~~ ~. JI• •.'., ,. .'I _ , ...., N~~~~~::i;;;iiii~i.=-}"~[
., ...ll'~
..'e0:I.;J tli'}1--------------~----6-----~~ ~~ r');' ~~'.• " I1-~IIII.:>' r" I I IIIIIII'.------=.-.::=...-.-:-.--..-LEGENDOVERFLOWLIMITSREGIONALCj{'NTERMEOIATE, FLOOD-~M + IMilES ABOVE ,-,cumSTA~OAROPROJECTFLOODl11ICROSS SECTION, SEE PLATES 8 A1\O 9JiII--------...
- "--,,-5.C.L.. "R.R. /CONFLUENCE WITHU. S. 'HIGHWAY 41 NORTH CREEKBOX CULVERT .20 20 25=b,:+.".
25...JVI::::Ii.2015~ 10lL.IZ50-l-e:(> 0W...JW-5-----LEGENDSTANDARD PROJECT FLOODINTERMEDIATE REGIONALFLOODA TOP OF LOW BANK2520iT··ceoITOP OF BRIDGE RAILINGBRIDGE FLOORUNDERCLEARANCEVI 15c,-J .~ .~--+- -- ...: 10 , ..'f-:•.lL.IZole:(>Ẉ..JW5o- 5DEPARTMENT OF THE ARMYJACKSONVILLE DISTRICT, CORPS OF ENGINEERSJACKSONVILLE,FLORIDAFLOOD PLAIN INFORMATIONHIGH WATER PROFILES-10o.51.5MILES ABOVE MOUTHELLIGRAW BAYOU22.5. MATHENY CREEK. ELLIGRAWBAYOU. AND SOUTH CREEKSARASOTA COUNTY, FLORIDASCALES AS SHOWNJUNE 1973 PLATE 7
...J .(f)~-10...,: 5lL.,-1ct_1J-,-1- +- r, .-l \.- H- .--1:- t:-:~ --':~:-l--:.±= c=,-4-__-I, 5_ T - -+t=':'"- - +, - - ~:.-=-- - 520 40 60CROSS SECTION NO.2MILE T 0.25== --:-. t- t::T-lo...J(f)...J(f)- -~ ~t-= ...,:lL.lL.IZZ0 0- -l- I-wW...JW...JW-:t- ,,~}10...J(f)~5 ~-lL.ILEGEND:--- STANDARD PROJECT FLOOD----- INTERMED lATE REGIONAL FLOODNOTES:...J5 (f)0~...,:lL.-1. SECTIONS TAKEN LOOKING UPSTREAM.2. SECTIONS NOT SHOWN ARE AVAILABLEAT JACKSONVILLE DISTRICT OF~ICE.HORIZONTAL DISTANCE IN FEET.DEPARTMENT OF THEARMYJACKSONVILLE DISTRICT, CORPS OF ENGfNEERSJACKSONVILLE, FLORIDAFLOOD PLAIN I NFORMATlONSELECTEDCROSS SECTIONSCLOWER CREEK, CATFISH CREEK,AND NORTH CREEKSARASOTA COUNTY, FLORIDASCALES AS SHOWNJUNE 1973 PLATE 8
•t-=ILIZoI~>UJ...JUJCROSS SECTIONMILE + 0.75NO.4lEGEND:--- STANDARD PROJECT FLOOD----- INTERMED lATE REG IONAl FLOODHORIZONTAL DISTANCE IN FEET...Jiii::E•l-lL15~ rI ii'1 "- i~ c;:c~: ~=to _~~ .I~. '1, n :=1'~~ 'i.~ ~ I" iii 15L '. j It j, t:, ii':'~ =t .··.·1:: i i ... -;"-1. _ ~.t 1__~"'" : i ic:.::tj_c:l·~ " i[ .: L' . _ j +ot~1EEl_~::::~ __=-t.I,]-H.I·..,- ~:n:~,*i.r.l::r=:J ~. ~ 1'. c., iI 'T ri-\ICt- ~:.t10' r _. Li~lC : ':.~:~: , .z ~ -~ =±' ,. ~:._ .• ~.~IOO- ~i ~t;hj:l;~ J":!;i '::. ~ ~~~~~'t= ~ ~ .. J1 1 t1+ rf1i~ 51i:iliio'-IiiIili.l.iiiiWilo·U'~_EuriiUi-+Iii+-iii.· Uii.'u~... ~.u.:~....~ 1.~ '·~·u~.,U,j"~"~..I.·t..•• ' .:..I.t.....·.Fioii.ii~·iIo~'iII: 5o 20 40 60 80CROSS SECTION NO. \IMILE + 0.92...Jl/l...Jl/l20::E ::E 15t-=t-=~.ILILIZZ0 0-I-l-~~> >UJ...JUJUJ...JUJ10NOTES:1. SECTIONS TAKEN lOOKING UPSTREAM.2. SECTIONS NOT SHOWN ARE AVAI lABlEAT JACKSONVillE DISTRICT OFFICE.DEPARTMENT OF THE ARMYJACKSONVILLE DISTRICT, CORPS OF ENGINEERSJACKSONVILLE,FLORIDAFLOOD PLAIN 1NFORMATIONSELECTEDCROSS SECTIONSSOUTH CREEK, MATHENY CREEKAND ELLIGRAW BAYOUSARASOTA COUNTY, FLORIDASCALES AS SHOWNJUNE 1973 PLATE 9
-j-. t,. t-M-+- ;,enII: 1500u .Z1&.1C)a:: 1000c:x:en0u .,50::E'"0r~-lITIoo o I 2DRAINAGE AREA-18.S Sq.MI3 4TIME IN DAYS5 • T •DEPARTMENT OF THE ARMYJACKSONVILLE DISTRICT, CORPS OF ENGINEERSJACKSONVILLE, FLORIDAFLOOD PLAIN INFORMATIONSOUTH CREEK AT MOUTH000 HYDR GR PHS