

Putnam Multi-Cap Value Fund - Putnam Investments
Putnam Multi-Cap Value Fund - Putnam Investments
Putnam Multi-Cap Value Fund - Putnam Investments

You also want an ePaper? Increase the reach of your titles
YUMPU automatically turns print PDFs into web optimized ePapers that Google loves.
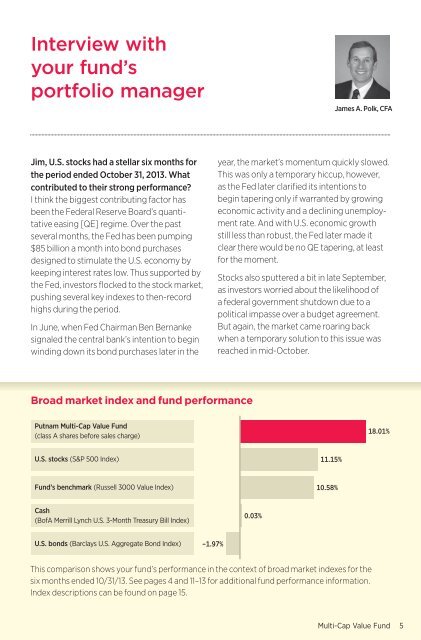
Interview withyour fund’sportfolio managerJames A. Polk, CFAJim, U.S. stocks had a stellar six months forthe period ended October 31, 2013. Whatcontributed to their strong performance?I think the biggest contributing factor hasbeen the Federal Reserve Board’s quantitativeeasing [QE] regime. Over the pastseveral months, the Fed has been pumping$85 billion a month into bond purchasesdesigned to stimulate the U.S. economy bykeeping interest rates low. Thus supported bythe Fed, investors flocked to the stock market,pushing several key indexes to then-recordhighs during the period.In June, when Fed Chairman Ben Bernankesignaled the central bank’s intention to beginwinding down its bond purchases later in theyear, the market’s momentum quickly slowed.This was only a temporary hiccup, however,as the Fed later clarified its intentions tobegin tapering only if warranted by growingeconomic activity and a declining unemploymentrate. And with U.S. economic growthstill less than robust, the Fed later made itclear there would be no QE tapering, at leastfor the moment.Stocks also sputtered a bit in late September,as investors worried about the likelihood ofa federal government shutdown due to apolitical impasse over a budget agreement.But again, the market came roaring backwhen a temporary solution to this issue wasreached in mid-October.Broad market index and fund performance<strong>Putnam</strong> <strong>Multi</strong>-<strong>Cap</strong> <strong>Value</strong> <strong>Fund</strong>(class A shares before sales charge)18.01%U.S. stocks (S&P 500 Index)11.15%<strong>Fund</strong>’s benchmark (Russell 3000 <strong>Value</strong> Index)10.58%Cash(BofA Merrill Lynch U.S. 3-Month Treasury Bill Index)0.03%U.S. bonds (Barclays U.S. Aggregate Bond Index)–1.97%This comparison shows your fund’s performance in the context of broad market indexes for thesix months ended 10/31/13. See pages 4 and 11–13 for additional fund performance information.Index descriptions can be found on page 15.<strong>Multi</strong>-<strong>Cap</strong> <strong>Value</strong> <strong>Fund</strong> 5


