

Putnam Multi-Cap Value Fund - Putnam Investments
Putnam Multi-Cap Value Fund - Putnam Investments
Putnam Multi-Cap Value Fund - Putnam Investments

You also want an ePaper? Increase the reach of your titles
YUMPU automatically turns print PDFs into web optimized ePapers that Google loves.
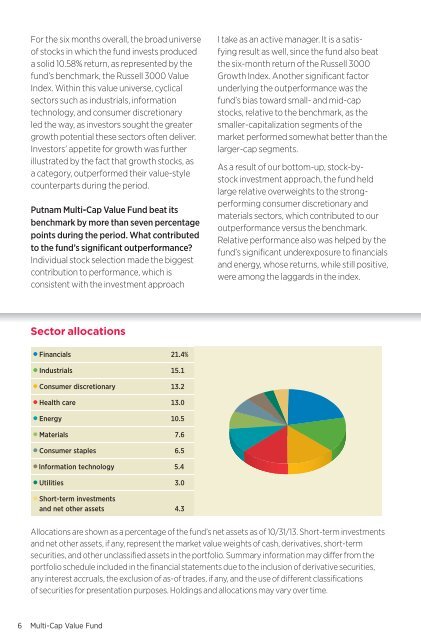
For the six months overall, the broad universeof stocks in which the fund invests produceda solid 10.58% return, as represented by thefund’s benchmark, the Russell 3000 <strong>Value</strong>Index. Within this value universe, cyclicalsectors such as industrials, informationtechnology, and consumer discretionaryled the way, as investors sought the greatergrowth potential these sectors often deliver.Investors’ appetite for growth was furtherillustrated by the fact that growth stocks, asa category, outperformed their value-stylecounterparts during the period.<strong>Putnam</strong> <strong>Multi</strong>-<strong>Cap</strong> <strong>Value</strong> <strong>Fund</strong> beat itsbenchmark by more than seven percentagepoints during the period. What contributedto the fund’s significant outperformance?Individual stock selection made the biggestcontribution to performance, which isconsistent with the investment approachI take as an active manager. It is a satisfyingresult as well, since the fund also beatthe six-month return of the Russell 3000Growth Index. Another significant factorunderlying the outperformance was thefund’s bias toward small- and mid-capstocks, relative to the benchmark, as thesmaller-capitalization segments of themarket performed somewhat better than thelarger-cap segments.As a result of our bottom-up, stock-bystockinvestment approach, the fund heldlarge relative overweights to the strongperformingconsumer discretionary andmaterials sectors, which contributed to ouroutperformance versus the benchmark.Relative performance also was helped by thefund’s significant underexposure to financialsand energy, whose returns, while still positive,were among the laggards in the index.Sector allocationsFinancials 21.4%Industrials 15.1Consumer discretionary 13.2Health care 13.0Energy 10.5Materials 7.6Consumer staples 6.5Information technology 5.4Utilities 3.0Short-term investmentsand net other assets 4.3Allocations are shown as a percentage of the fund’s net assets as of 10/31/13. Short-term investmentsand net other assets, if any, represent the market value weights of cash, derivatives, short-termsecurities, and other unclassified assets in the portfolio. Summary information may differ from theportfolio schedule included in the financial statements due to the inclusion of derivative securities,any interest accruals, the exclusion of as-of trades, if any, and the use of different classificationsof securities for presentation purposes. Holdings and allocations may vary over time.6 <strong>Multi</strong>-<strong>Cap</strong> <strong>Value</strong> <strong>Fund</strong>


