Student Handout
Student Handout
Student Handout

You also want an ePaper? Increase the reach of your titles
YUMPU automatically turns print PDFs into web optimized ePapers that Google loves.
The Making of the Fittest:Natural Selection in HumansHANDS-ON ACTIVITYSTUDENT HANDOUTTable 1.2. First Generation of OffspringGenotypeTally Marks forOffspringNumber ofIndividualsTotalNumber ofIndividualsin the FirstOffspringPopulationGenotypeFrequencyAlleleNumberofAllelesTotalNumber ofAlleles intheOffspringPopulationAlleleFrequencyAAAASSSSn. The Hardy-Weinberg principle predicts that the genotype frequencies of the offspring will be the same as thoseof the parent population if the population is not evolving. Were the allele and genotype frequencies that youcalculated in the parent population and in the first generation of offspring the same? _____ (yes or no)i. If yes, then the population is said to be at ___________________________________, and all five conditionswere followed.ii.If no, then at least one of the conditions of the Hardy-Weinberg principle was violated. In this simulation,which condition or conditions were violated?____________________________________________________________________________________________________________________________________________________________________________If a million more offspring were produced from this parent population, predict how the genotype and allelefrequencies would compare with the frequencies calculated in Table 1.1.____________________________________________________________________________________________________________________________________________________________________________5. Perform simulation 2 to examine a 100% negative selection pressure.a. In the parent population container, establish the same population that you used in simulation 1, Table 1.1.b. For this simulation, assume that the SS genotype represents individuals who have sickle cell disease. Sickle celldisease is a lethal disease caused by a genetic mutation. In East Africa, children born with sickle cell disease oftendie. In this simulation, we assume that sickle cell disease is 100% selected against. This means that all childrenborn with this disease die before reproductive age and do not pass their genes on to the next generation.c. Using the same mixing and selecting procedure as in simulation 1, produce offspring from this population byrandomly picking two alleles to represent an individual offspring. If the offspring is AA or AS, place a tally mark inTable 2.1 in the appropriate genotype row. Return the alleles to the population and mix. If the offspring is SS, donot place a tally mark in the table. Simply return the alleles to the population and mix. This procedure simulates100% lethality of sickle cell disease in this population. To keep the population size consistent from generation togeneration, you must repeat Step 5c until 60 viable offspring have been produced (the tally marks should total60).Population Genetics, Selection, and Evolutionwww.BioInteractive.org Page 4 of 12
The Making of the Fittest:Natural Selection in HumansHANDS-ON ACTIVITYSTUDENT HANDOUTGenotyped. Calculate the genotype frequencies for this first population of offspring directly from the number of individualsyou recorded in Steps 5b and 5c. Record the calculations in Table 2.1. If you need help, refer back to simulation 1.e. Calculate the number of alleles and the allele frequencies. Remember, to calculate the number of alleles, youneed to count each allele (bead) in the population. Refer to calculations provided in simulation 1 if needed.Record the calculations in Table 2.1.Table 2.1. First Generation of OffspringTally Marks forOffspringNumber ofIndividualsTotalNumber ofIndividualsin the FirstOffspringPopulationGenotypeFrequencyAlleleNumberofAllelesTotalNumber ofAlleles intheOffspringPopulationAlleleFrequencyAAAASSSSGenotypef. In order to produce the next generation of offspring, change the number of beads in the parent container toreflect the gene pool of the first generation of offspring (Table 2.1). In other words, the number of alleles (beads)in the parent container should match the numbers calculated in Table 2.1 (“number of alleles”). For example, ifthe number of alleles in Table 2.1 were A = 76 and S = 44, place 76 beads of allele A and 44 beads of allele S intothe container. You may need to obtain more beads from the stock population.g. Repeat Steps 5b and 5c above to produce the second generation of 60 offspring. Tally the results and fill in Table2.2.Table 2.2. Second Generation of OffspringTally Marks forOffspringNumber ofIndividualsTotalNumber ofIndividualsin the FirstOffspringPopulationGenotypeFrequencyAlleleNumberofAllelesTotalNumber ofAlleles intheOffspringPopulationAlleleFrequencyAAAASSSSPopulation Genetics, Selection, and Evolutionwww.BioInteractive.org Page 5 of 12
The Making of the Fittest:Natural Selection in HumansHANDS-ON ACTIVITYSTUDENT HANDOUTh. You began simulation 2 with the same parent population as in simulation 1. What were the frequencies of the Aand S alleles of the parent population in simulation 1?A = _______S = ________In simulation 2, what happened to the frequency of the sickle cell allele (S) with each successive generation ofoffspring? Explain your observation.____________________________________________________________________________________________________________________________________________________________________________________i. In simulation 2, was the change in frequency of the sickle cell allele (S) from the parent generation to the firstgeneration of offspring similar to the change from the first generation to the second generation of offspring?Explain your answer.____________________________________________________________________________________________________________________________________________________________________________________j. Do the genotype frequencies of the parent population equal the genotype frequencies calculated in Table 2.2?___________ (yes or no)k. Is this population at Hardy-Weinberg (genetic) equilibrium? ___________ (yes or no) Explain your response.____________________________________________________________________________________________________________________________________________________________________________________l. If this population is not at Hardy-Weinberg equilibrium, which Hardy-Weinberg condition or conditions wereviolated in simulation 2?_________________________________________________________________________________________________________________________________________________________________________________________________________________________________________________________________________________6. Perform simulation 3, which examines heterozygous advantage.a. Establish the same parent population that you used in simulation 1.b. Using the same mixing and selecting procedure as in simulation 1, produce offspring from this population byrandomly picking two alleles to represent an individual offspring. Follow the instructions below.i. If the offspring is AS, place a tally mark in Table 3.1, return the alleles to the population, and mix. Individualswho are AS have two genetic advantages: they do not have sickle cell disease and they are resistant tomalaria infection. Therefore, in this simulation, sickle cell trait (the heterozygous state) is selected for, andindividuals with the AS genotype survive 100% of the time.ii.iii.If the offspring is AA, place a tally mark every other time one of these individuals is selected. You will need todevelop a system to keep track of this 50:50 chance of survival. Individuals with the AA genotype do nothave sickle cell disease but are more susceptible to malaria. This simulation models a 50% selection againstthis trait: people with the AA genotype have a 50% chance of surviving and passing on their genes to thenext generation of offspring.If the offspring is SS, do not place a tally mark in the table; simply return the alleles to the population andmix as you did in simulation 2. The SS genotype represents individuals who have sickle cell disease. Sicklecell disease is a lethal disease caused by a genetic mutation. In East Africa, children born with sickle celldisease often die. We assume that sickle cell disease is 100% selected against. This means that all childrenborn with this disease die before reproductive age.Make sure that you return the alleles to the population and mix each time before drawing another two beads.Population Genetics, Selection, and Evolutionwww.BioInteractive.org Page 6 of 12
The Making of the Fittest:Natural Selection in HumansHANDS-ON ACTIVITYSTUDENT HANDOUTc. In order to keep the population size consistent from generation to generation, you must repeat Step 6b until 60viable offspring have been produced (the tally marks should total 60). Record the tallies and calculate thefrequencies in Table 3.1.Table 3.1. First Generation of OffspringGenotypeTally Marks forOffspringNumber ofIndividualsTotalNumber ofIndividualsin the FirstOffspringPopulationGenotypeFrequencyAlleleNumberofAllelesTotalNumber ofAlleles intheOffspringPopulationAlleleFrequencyAAAASSSSGenotyped. In order to produce the next generation, change the number of beads in the parent container to reflect the genepool of the first generation of offspring, as you did in simulation 2. In other words, the number of alleles (beads)in the parent container should match the number calculated in Table 3.1 (“number of alleles”). Again, you canobtain more alleles from the stock population if you need them.e. Repeat Steps 6b and 6c to produce the second generation of 60 offspring. Record the tallies and calculate thefrequencies in Table 3.2.Table 3.2. Second Generation of OffspringTally Marks forOffspringNumber ofIndividualsTotalNumber ofIndividualsin the FirstOffspringPopulationGenotypeFrequencyAlleleNumberofAllelesTotalNumber ofAlleles intheOffspringPopulationAlleleFrequencyAAAASSSSPopulation Genetics, Selection, and Evolutionwww.BioInteractive.org Page 7 of 12
The Making of the Fittest:Natural Selection in HumansHANDS-ON ACTIVITYSTUDENT HANDOUTf. What happened to the frequency of the sickle cell allele (S) with each successive generation? Remember to referto the parent population established in simulation 1 when interpreting your data.________________________________________________________________________________________________________________________________________________________________________________g. Was the change in the frequency of the sickle cell allele (S) from the parent population to the first generation ofoffspring the same as the change from the first to the second generation of offspring? Explain your answer.________________________________________________________________________________________________________________________________________________________________________________h. Do the genotype frequencies of the parent population equal the genotype frequencies calculated in Tables 3.1and 3.2? ___________ (yes or no)i. Is this population at Hardy-Weinberg equilibrium? ____________ (yes or no) Explain your answer.________________________________________________________________________________________________________________________________________________________________________________j. If this population is not at equilibrium, which Hardy-Weinberg condition or conditions were violated in thissimulation?_________________________________________________________________________________________QUESTIONS_________________________________________________________________________________________From the simulations, it is easy to see that natural selection can alter the frequency distribution of heritable traits. Usingthe information and data from the simulations, along with your knowledge from the film, complete the following analysisquestions.1. From the tables in all three simulations, record the calculated genotype frequencies in Table 4.1 below.Table 4.1. Genotype Frequencies for All SimulationsSimulation StageSimulation 1: Parent populationSimulation 1: First-generation offspringSimulation 2: Parent populationSimulation 2: First-generation offspringSimulation 2: Second-generation offspringSimulation 3: Parent populationSimulation 3: First-generation offspringSimulation 3: Second-generation offspringAA GenotypeFrequency (p 2 )AS GenotypeFrequency(2pq)SS GenotypeFrequency(q 2 )Population Genetics, Selection, and Evolutionwww.BioInteractive.org Page 8 of 12
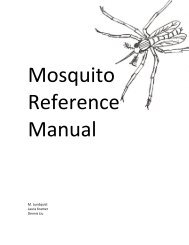
The Making of the Fittest:Natural Selection in HumansHANDS-ON ACTIVITYSTUDENT HANDOUT2. Using colored pencils and the graphing grids provided below, sketch a bar graph representing genotype frequenciesin each generation for all three simulations. Clearly and neatly label the axes and the bars with their respective variables.You may want to sketch practice graphs on another piece of paper, or on graph paper if your teacher provides it, beforedrawing your final graphs here.3. You collected data from simulation 2 over five generations. The frequency of the S allele over time is graphed below.The graph shows a rapid decrease in the sickle cell allele frequency in the first generation but a slower decrease in latergenerations. By the fifth generation, the allele is not completely eliminated from the population.Frequency of the S Allele over TimePopulation Genetics, Selection, and Evolutionwww.BioInteractive.org Page 9 of 12
The Making of the Fittest:Natural Selection in HumansHANDS-ON ACTIVITYSTUDENT HANDOUTProvide two explanations for why the S allele persists after five generations.____________________________________________________________________________________________________________________________________________________________________________________________________________________________________________________________________________________4. If you continued both simulation 2 and simulation 3 for three more generations (up to five generations), do youpredict that the frequency of the S allele in simulation 2 would be greater, less than, or equal to the S allele frequencyin simulation 3? Explain your answer.________________________________________________________________________________________________________________________________________________________________________________________________________________________________________________________________________________________________________________________________________________________________________________5. Which simulation might represent a population of people who live in the moist lowlands of East Africa? Use data toexplain why you chose this simulation.________________________________________________________________________________________________________________________________________________________________________________________________________________________________________________________________________________________________________________________________________________________________________________6. Which simulation might represent a population of people living in a remote village in the dry highlands of Africa?Use data to explain why you chose this simulation.________________________________________________________________________________________________________________________________________________________________________________________________________________________________________________________________________________________________________________________________________________________________________________7. Design a simulation that models equal selection for the two homozygous genotypes and selection against theheterozygous genotype. Start with the original parent population as established in Table 1.1. Design your simulation tohave 60 parents and 60 offspring in each successive generation. Feel free to vary the survival percentage of particulargenotypes, as in simulation 3; however, be sure to incorporate selection for the two homozygous genotypes andselection against the heterozygous genotype. Explain your simulation in the space provided.Design________________________________________________________________________________________________________________________________________________________________________________________________________________________________________________________________________________________________________________________________________________________________________________________________________________________________________________________________________________________________________________________________________________________________________________________________________________________________________________________________________________________________________________________________________________________________________________________________________Population Genetics, Selection, and Evolutionwww.BioInteractive.org Page 10 of 12
The Making of the Fittest:Natural Selection in HumansHANDS-ON ACTIVITYSTUDENT HANDOUTPredicted DataBased on 60 offspring in each generation, predict the number of offspring of each genotype in each generation ofthe simulation you designed. Use the table below to record your predictions.Predicted of Number of Offspring Per Genotype Per GenerationGenotypeInitial Number ofIndividuals in theParent PopulationAA 15AS 30SS 15Predicted Number ofFirst-GenerationOffspringPredicted Number ofSecond-GenerationOffspringPredicted Number ofThird-GenerationOffspringUsing the predicted genotype numbers above, count the number of each allele found in each generation.Example: parent population A allele calculation = (AA × 2) + AS = (15 × 2) + 30 = 60 A allelesNumber of Alleles in Each GenerationAlleleInitial Number ofAlleles in the ParentPopulationA 60S 60Predicted Number ofAlleles in the FirstGeneration ofOffspringPredicted Number ofAlleles in the SecondGeneration ofOffspringPredicted Number ofAlleles in the ThirdGeneration ofOffspringCalculated FrequenciesUsing the predicted numbers above, calculate the genotype and allele frequencies to illustrate how the frequencieswill change over the three generations of offspring.Genotype and Allele Frequency Changes over Three GenerationsGenotypeInitial ParentPopulationFrequenciesAA 0.25AS 0.50SS 0.25AlleleA 0.50S 0.50Predicted First-GenerationFrequenciesPredicted Second-GenerationFrequenciesPredicted Third-GenerationFrequenciesPopulation Genetics, Selection, and Evolutionwww.BioInteractive.org Page 11 of 12
The Making of the Fittest:Natural Selection in HumansHANDS-ON ACTIVITYSTUDENT HANDOUTExplanationa. How do the genotype frequencies change over time? Be sure to address all three genotypes.___________________________________________________________________________________________________________________________________________________________________________________________________________________________________________________________________________________________________b. How do the allele frequencies change over time? Address both alleles.___________________________________________________________________________________________________________________________________________________________________________________________________________________________________________________________________________________________________c. Based on how you designed this simulation, explain why these changes in allele and genotype frequencies makesense in terms of selection and evolution.______________________________________________________________________________________________________________________________________________________________________________________________________________________________________________________________________________________________________________________________________________________________________________________________________________________________________________________________________________________________________________________________________________________________________________________________________AUTHORAnn Brokaw, Rocky River High School, OhioPopulation Genetics, Selection, and Evolutionwww.BioInteractive.org Page 12 of 12