Student Handout
Student Handout
Student Handout
Create successful ePaper yourself
Turn your PDF publications into a flip-book with our unique Google optimized e-Paper software.
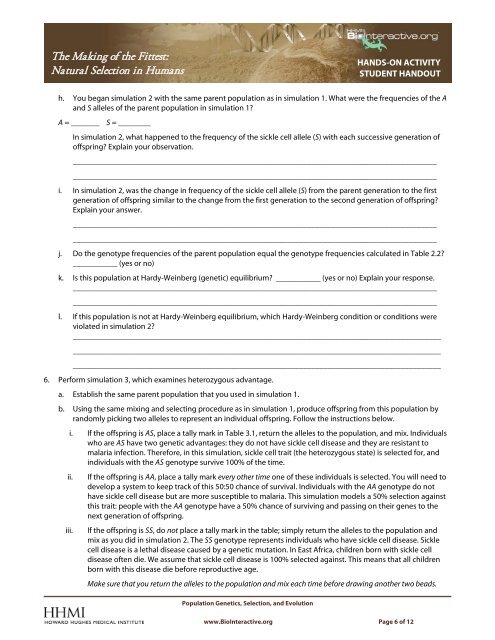
The Making of the Fittest:Natural Selection in HumansHANDS-ON ACTIVITYSTUDENT HANDOUTh. You began simulation 2 with the same parent population as in simulation 1. What were the frequencies of the Aand S alleles of the parent population in simulation 1?A = _______S = ________In simulation 2, what happened to the frequency of the sickle cell allele (S) with each successive generation ofoffspring? Explain your observation.____________________________________________________________________________________________________________________________________________________________________________________i. In simulation 2, was the change in frequency of the sickle cell allele (S) from the parent generation to the firstgeneration of offspring similar to the change from the first generation to the second generation of offspring?Explain your answer.____________________________________________________________________________________________________________________________________________________________________________________j. Do the genotype frequencies of the parent population equal the genotype frequencies calculated in Table 2.2?___________ (yes or no)k. Is this population at Hardy-Weinberg (genetic) equilibrium? ___________ (yes or no) Explain your response.____________________________________________________________________________________________________________________________________________________________________________________l. If this population is not at Hardy-Weinberg equilibrium, which Hardy-Weinberg condition or conditions wereviolated in simulation 2?_________________________________________________________________________________________________________________________________________________________________________________________________________________________________________________________________________________6. Perform simulation 3, which examines heterozygous advantage.a. Establish the same parent population that you used in simulation 1.b. Using the same mixing and selecting procedure as in simulation 1, produce offspring from this population byrandomly picking two alleles to represent an individual offspring. Follow the instructions below.i. If the offspring is AS, place a tally mark in Table 3.1, return the alleles to the population, and mix. Individualswho are AS have two genetic advantages: they do not have sickle cell disease and they are resistant tomalaria infection. Therefore, in this simulation, sickle cell trait (the heterozygous state) is selected for, andindividuals with the AS genotype survive 100% of the time.ii.iii.If the offspring is AA, place a tally mark every other time one of these individuals is selected. You will need todevelop a system to keep track of this 50:50 chance of survival. Individuals with the AA genotype do nothave sickle cell disease but are more susceptible to malaria. This simulation models a 50% selection againstthis trait: people with the AA genotype have a 50% chance of surviving and passing on their genes to thenext generation of offspring.If the offspring is SS, do not place a tally mark in the table; simply return the alleles to the population andmix as you did in simulation 2. The SS genotype represents individuals who have sickle cell disease. Sicklecell disease is a lethal disease caused by a genetic mutation. In East Africa, children born with sickle celldisease often die. We assume that sickle cell disease is 100% selected against. This means that all childrenborn with this disease die before reproductive age.Make sure that you return the alleles to the population and mix each time before drawing another two beads.Population Genetics, Selection, and Evolutionwww.BioInteractive.org Page 6 of 12


