Student Handout
Student Handout
Student Handout

You also want an ePaper? Increase the reach of your titles
YUMPU automatically turns print PDFs into web optimized ePapers that Google loves.
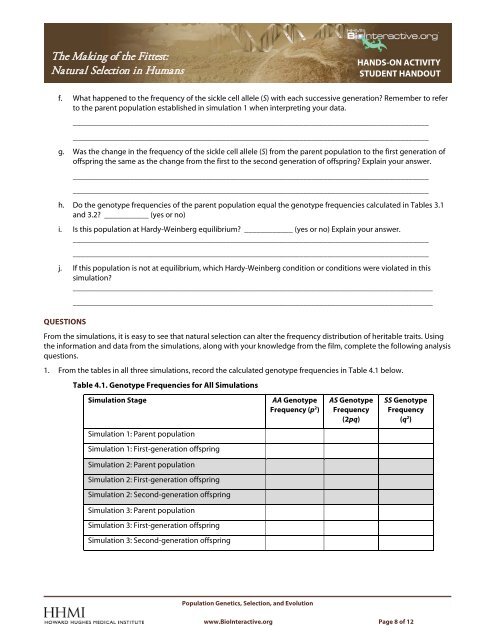
The Making of the Fittest:Natural Selection in HumansHANDS-ON ACTIVITYSTUDENT HANDOUTf. What happened to the frequency of the sickle cell allele (S) with each successive generation? Remember to referto the parent population established in simulation 1 when interpreting your data.________________________________________________________________________________________________________________________________________________________________________________g. Was the change in the frequency of the sickle cell allele (S) from the parent population to the first generation ofoffspring the same as the change from the first to the second generation of offspring? Explain your answer.________________________________________________________________________________________________________________________________________________________________________________h. Do the genotype frequencies of the parent population equal the genotype frequencies calculated in Tables 3.1and 3.2? ___________ (yes or no)i. Is this population at Hardy-Weinberg equilibrium? ____________ (yes or no) Explain your answer.________________________________________________________________________________________________________________________________________________________________________________j. If this population is not at equilibrium, which Hardy-Weinberg condition or conditions were violated in thissimulation?_________________________________________________________________________________________QUESTIONS_________________________________________________________________________________________From the simulations, it is easy to see that natural selection can alter the frequency distribution of heritable traits. Usingthe information and data from the simulations, along with your knowledge from the film, complete the following analysisquestions.1. From the tables in all three simulations, record the calculated genotype frequencies in Table 4.1 below.Table 4.1. Genotype Frequencies for All SimulationsSimulation StageSimulation 1: Parent populationSimulation 1: First-generation offspringSimulation 2: Parent populationSimulation 2: First-generation offspringSimulation 2: Second-generation offspringSimulation 3: Parent populationSimulation 3: First-generation offspringSimulation 3: Second-generation offspringAA GenotypeFrequency (p 2 )AS GenotypeFrequency(2pq)SS GenotypeFrequency(q 2 )Population Genetics, Selection, and Evolutionwww.BioInteractive.org Page 8 of 12