Student Handout
Student Handout
Student Handout

Create successful ePaper yourself
Turn your PDF publications into a flip-book with our unique Google optimized e-Paper software.
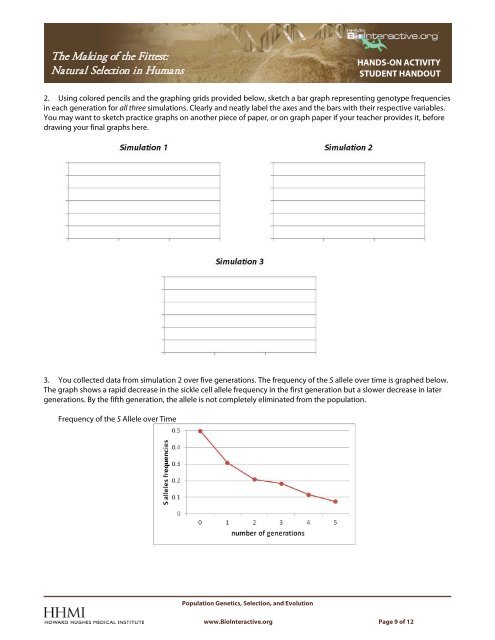
The Making of the Fittest:Natural Selection in HumansHANDS-ON ACTIVITYSTUDENT HANDOUT2. Using colored pencils and the graphing grids provided below, sketch a bar graph representing genotype frequenciesin each generation for all three simulations. Clearly and neatly label the axes and the bars with their respective variables.You may want to sketch practice graphs on another piece of paper, or on graph paper if your teacher provides it, beforedrawing your final graphs here.3. You collected data from simulation 2 over five generations. The frequency of the S allele over time is graphed below.The graph shows a rapid decrease in the sickle cell allele frequency in the first generation but a slower decrease in latergenerations. By the fifth generation, the allele is not completely eliminated from the population.Frequency of the S Allele over TimePopulation Genetics, Selection, and Evolutionwww.BioInteractive.org Page 9 of 12