food & beverage services - Statistics Singapore
food & beverage services - Statistics Singapore
food & beverage services - Statistics Singapore

You also want an ePaper? Increase the reach of your titles
YUMPU automatically turns print PDFs into web optimized ePapers that Google loves.
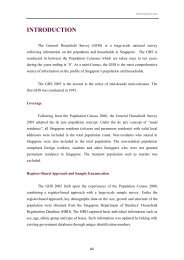
Introduction<br />
The <strong>Singapore</strong> Department of <strong>Statistics</strong> conducts an annual survey on the <strong>services</strong> industries<br />
to collect a wide range of data for studies and analyses. The first survey on the <strong>services</strong><br />
industries was conducted in 1968 for the reference year 1967 and subsequently at regular<br />
intervals. Since 1984, the inquiry was carried out on an annual basis.<br />
The latest survey was carried out in 2012 for reference year 2011. The reports will focus on<br />
several <strong>services</strong> industries of importance to the <strong>Singapore</strong> economy. This report on Food &<br />
Beverage Services is the Department’s second issue in the series for reference year 2011. A<br />
final consolidated report on The Services Sector will provide a performance overview of the<br />
<strong>services</strong> sector.<br />
28 November 2012<br />
ECONOMIC SURVEYS SERIES<br />
Reference Year 2011
FOOD & BEVERAGE SERVICES<br />
Key Indicators of Food & Beverage Services<br />
% Change 2010 2011<br />
Establishments (No.) � 4.5 % 6,174 6,453<br />
Employment (No.) � 9.9 % 92,425 101,581<br />
Operating Receipts � 12.1 % $6,341 mil $7,109 mil<br />
Operating Expenditure � 12.5 % $6,025 mil $6,780 mil<br />
Operating Surplus � 6.0 % $500 mil $530 mil<br />
Value Added � 11.7 % $2,227 mil $2,488 mil<br />
In 2011, there were about 6,500 establishments in the <strong>food</strong> & <strong>beverage</strong> (F&B) <strong>services</strong><br />
industry, employing around 101,600 workers. This represented an average of about 16<br />
workers per establishment.<br />
I . ECONOMIC PERFORMANCE<br />
Total operating receipts generated by the F&B <strong>services</strong> industry was $7,109 million in<br />
2011, a rise of 12.1 per cent over the previous year. On a per establishment basis, operating<br />
receipts also increased 7.3 per cent to $1.1 million in 2011.<br />
Total operating expenditure incurred amounted to $6,780 million in 2011, 12.5 per cent<br />
higher than the total of $6,025 million in 2010. Operating expenditure per establishment also<br />
rose 7.7 per cent to $1.1 million in 2011.<br />
Total operating surplus of the F&B <strong>services</strong> industry stood at $530 million in 2011, a<br />
growth of 6.0 per cent compared to 2010. On a per establishment basis, operating surplus<br />
went up 1.5 per cent to $82,200 in 2011.<br />
Total value added recorded by the industry increased 11.7 per cent to $2,488 million in<br />
2011. Value added per establishment rose 6.9 per cent to $385,500 in 2011.<br />
2
FOOD & BEVERAGE SERVICES<br />
II . MAIN ACTIVITIES IN FOOD & BEVERAGE SERVICES<br />
Restaurants constituted 35.9 per cent of the total number of establishments in the F&B<br />
<strong>services</strong> industry in 2011 (Chart 1). They employed the largest number of workers (43,500)<br />
in 2011, or an average of 19 workers per establishment. On a per establishment basis, fast<br />
<strong>food</strong> outlets had the largest average employment size of 34 workers, of which 25 were parttime<br />
employees.<br />
3,000<br />
Chart 1 - Establishments & Employment, 2011<br />
Operating receipts and value added of restaurants amounted to $2,655 million and $1,008<br />
million respectively in 2011 (Chart 2). They contributed 37.4 per cent of total operating<br />
receipts and 40.5 per cent of total value added of the F&B <strong>services</strong> industry. Fast <strong>food</strong> outlets<br />
and <strong>food</strong> caterers registered growth in turnover of 10.6 per cent and 12.1 per cent respectively<br />
over the previous year. The value added of the two groups also increased by 11.1 per cent and<br />
9.7 per cent respectively in 2011.<br />
3,000<br />
Establishments Employment<br />
2,000<br />
2,317<br />
400<br />
328<br />
1,000<br />
3,408<br />
0<br />
Restaurants<br />
Fast Food Outlets<br />
Food Caterers<br />
Others<br />
43,483<br />
13,684<br />
38,221<br />
6,193<br />
Number Number<br />
0 10,000 20,000 30,000 40,000<br />
Chart 2 - Operating Receipts & Value Added, 2011<br />
Operating Receipts<br />
2,000<br />
1,000<br />
$ Million<br />
2,655<br />
895<br />
791<br />
2,767<br />
0<br />
Restaurants<br />
Fast Food Outlets<br />
Food Caterers<br />
Others<br />
Value Added<br />
1,008<br />
273<br />
329<br />
877<br />
0 200 400 600 800 1,000<br />
$ Million<br />
3
FOOD & BEVERAGE SERVICES<br />
Purchases of <strong>food</strong> & <strong>beverage</strong>s and remuneration remained as the top two business cost items<br />
for all F&B <strong>services</strong> groups in 2011 (Table 1). Together, these two expenses accounted for<br />
between 51 per cent and 65 per cent of total operating expenses within the respective F&B<br />
<strong>services</strong> groups. Rental expenditure was the third largest expense item for most F&B <strong>services</strong><br />
groups.<br />
F&B Services<br />
Restaurants<br />
Fast Food Outlets<br />
Food Caterers<br />
Others<br />
Table 1 : Main Business Costs, 2011<br />
Cost Type and % Share<br />
1 st 2 nd 3 rd 4 th 5 th<br />
Rem Pur Rental Utilities Dep<br />
32.4 31.9 13.9 3.7 2.9<br />
Pur Rem Rental Royalties Utilities<br />
27.1 24.5 20.2 7.3 4.3<br />
Pur Rem Royalties Subcon Rental<br />
34.8 26.6 10.1 5.2 4.9<br />
Pur Rem Rental Utilities Dep<br />
34.6 24.8 20.0 4.1 3.0<br />
Notation<br />
Dep: Depreciation Royalties: Royalties / franchise & management fees<br />
Pur: Purchases of <strong>food</strong> & <strong>beverage</strong>s for sale Subcon: Subcontract charges / work given out<br />
Rem: Remuneration Utilities: Utilities charges<br />
Rental: Renting of offices, shops & other premises<br />
III . KEY PERFORMANCE RATIOS<br />
Profitability Ratio 1 for overall F&B <strong>services</strong> stood at 7.5 per cent in 2011, lower than the<br />
7.9 per cent registered in 2010. The drop in profitability ratio was seen in all F&B <strong>services</strong><br />
groups. Within the industry, <strong>food</strong> caterers recorded the highest profitability ratio of 19.2 per<br />
cent in 2011, as compared to restaurants (5.0 per cent) and fast <strong>food</strong> outlets (6.4 per cent)<br />
(Chart 3).<br />
1 Defined as the ratio of operating surplus to operating receipts<br />
4
FOOD & BEVERAGE SERVICES<br />
Chart 3 – Profitability Ratio, 2010 & 2011<br />
Profitability Ratio (%)<br />
25<br />
20<br />
15<br />
10<br />
Earnings-Expenditure Ratio 2 for overall F&B <strong>services</strong> was 7.8 per cent in 2011. Among all<br />
F&B <strong>services</strong> groups, <strong>food</strong> caterers recorded the highest earnings-expenditure ratio of 23.1<br />
per cent in 2011 (Chart 4). The ratios ranged between 5.1 per cent and 7.1 per cent for the<br />
other F&B <strong>services</strong> groups. All groups registered lower earnings-expenditure ratio compared<br />
to 2010.<br />
Chart 4 - Earnings-Expenditure Ratio, 2010 & 2011<br />
Average Annual Remuneration per Employee recorded by the F&B <strong>services</strong> industry was<br />
$19,000 in 2011. The average annual remuneration per employee was the highest for <strong>food</strong><br />
caterers at $29,900 in 2011 (Table 2). Fast <strong>food</strong> outlets, which hired a large number of parttime<br />
employees, had an average annual remuneration of $15,600 in 2011. This represented<br />
the largest growth of 7.6 per cent within the industry.<br />
2 Defined as the ratio of operating surplus to operating expenditure<br />
5<br />
0<br />
Restaurants Fast Food<br />
Outlets<br />
Earnings-Expenditure Ratio (%)<br />
25<br />
20<br />
15<br />
10<br />
5<br />
0<br />
Restaurants Fast Food<br />
Outlets<br />
Year 2010<br />
Year 2011<br />
Food Caterers Others<br />
Year 2010<br />
Year 2011<br />
Food Caterers Others<br />
5
FOOD & BEVERAGE SERVICES<br />
Table 2 : Average Annual Remuneration per Employee, 2010 & 2011<br />
F&B Services<br />
2010 2011 Change<br />
($’000) ($’000) (%)<br />
Restaurants 19.7 19.6 -0.5<br />
Fast Food Outlets 14.5 15.6 7.6<br />
Food Caterers 29.4 29.9 1.7<br />
Others 17.3 18.0 4.0<br />
Value Added per Worker was $24,500 for the F&B <strong>services</strong> industry in 2011, 1.7 per cent<br />
higher compared to 2010. Within the industry, <strong>food</strong> caterers continued to generate the highest<br />
value added per worker of $53,200 in 2011 (Chart 5). The other three F&B groups recorded<br />
value added per worker of between $20,000 and $23,200.<br />
IV . PERFORMANCE BY FIRM SIZE<br />
Chart 5 - Value Added per Worker, 2010 & 2011<br />
In 2011, about 99 per cent of F&B establishments were firms which employed less than 100<br />
workers (Table 3). These firms accounted for 77.2 per cent and 74.7 per cent of the industry’s<br />
total operating receipts and value added respectively.<br />
Table 3 : Establishments, Operating Receipts &Value Added by Employment Size, 2011<br />
Employment<br />
Size<br />
Value Added per Worker ($'000)<br />
70<br />
60<br />
50<br />
40<br />
30<br />
20<br />
10<br />
0<br />
Restaurants Fast Food<br />
Outlets<br />
Establishments<br />
(Number)<br />
Operating<br />
Receipts<br />
($ Million)<br />
Year 2010<br />
Year 2011<br />
Food Caterers Others<br />
Value<br />
Added<br />
($ Million)<br />
Less than 10 2,805 1,029 272<br />
10 – 99 3,566 4,459 1,587<br />
100 & above 82 1,622 629<br />
The publication on “Food & Beverage Services” containing more detailed statistical tables will be released in 4 th Quarter<br />
2012.<br />
6
FOOD & BEVERAGE SERVICES<br />
Summary Tables<br />
Key Indicators of Food & Beverage Services, 2009-2011<br />
Establishments<br />
Employment<br />
Operating Receipts<br />
F&B Services<br />
(Number)<br />
(Number)<br />
($ Million)<br />
2009 2010 2011 2009 2010 2011 2009 2010 2011<br />
Total F&B Services 5,969 6,174 6,453 89,572 92,425 101,581 5,641 6,341 7,109<br />
Restaurants 2,091 2,272 2,317 36,910 37,603 43,483 2,082 2,383 2,655<br />
Fast Food Outlets 335 374 400 12,930 13,139 13,684 723 810 895<br />
Food Caterers 289 299 328 5,186 5,728 6,193 629 706 791<br />
Others 3,254 3,229 3,408 34,546 35,955 38,221 2,207 2,443 2,767<br />
Operating Expenditure<br />
Operating Surplus<br />
Value Added<br />
F&B Services<br />
($ Million)<br />
($ Million)<br />
($ Million)<br />
2009 2010 2011 2009 2010 2011 2009 2010 2011<br />
Total F&B Services 5,372 6,025 6,780 446 500 530 1,985 2,227 2,488<br />
Restaurants 2,029 2,325 2,599 123 137 132 786 885 1,008<br />
Fast Food Outlets 692 781 868 56 54 58 223 246 273<br />
Food Caterers 536 586 655 108 136 152 275 300 329<br />
Others 2,115 2,333 2,659 159 172 189 702 796 877<br />
Key Indicators of Food & Beverage Services by Employment Size of Firm, 2011<br />
Employment Size<br />
Establishments<br />
(Number)<br />
Employment<br />
(Number)<br />
Operating Receipts<br />
($ Million)<br />
All Categories 6,453 101,581 7,109<br />
Less than 10 persons 2,805 13,442 1,029<br />
10 to 99 persons 3,566 71,697 4,459<br />
100 persons & above 82 16,441 1,622<br />
Employment Size<br />
Operating Expenditure<br />
($ Million )<br />
Operating Surplus<br />
($ Million )<br />
Value Added<br />
($ Million)<br />
All Categories 6,780 530 2,488<br />
Less than 10 persons 943 93 272<br />
10 to 99 persons 4,306 265 1,587<br />
100 persons & above 1,531 172 629<br />
7
FOOD & BEVERAGE SERVICES<br />
Key Indicators of Food & Beverage Services by Size of Operating Receipts of Firm, 2011<br />
Size of Operating Receipts<br />
Establishments<br />
(Number)<br />
Employment<br />
(Number)<br />
Operating Receipts<br />
($ Million)<br />
All Categories 6,453 101,581 7,109<br />
Less than $200,000 1,602 9,667 203<br />
$200,000 to $999,999 3,316 33,911 1,870<br />
$1,000,000 to $1,999,999 830 16,734 1,139<br />
$2,000,000 to $4,999,999 547 21,402 1,667<br />
$5,000,000 & above 157 19,867 2,229<br />
Size of Operating Receipts<br />
Operating Expenditure<br />
($ Million )<br />
Operating Surplus<br />
($ Million)<br />
Value Added<br />
($ Million)<br />
All Categories 6,780 530 2,488<br />
Less than $200,000 247 -41 41<br />
$200,000 to $999,999 1,882 14 594<br />
$1,000,000 to $1,999,999 1,104 68 379<br />
$2,000,000 to $4,999,999 1,515 199 628<br />
$5,000,000 & above 2,032 291 846<br />
Note:<br />
1. Data for 2011 are preliminary.<br />
2. Industries are classified according to the <strong>Singapore</strong> Standard Industrial Classification (SSIC) 2010.<br />
3. Figures may not add up to the totals due to rounding.<br />
8
FOOD & BEVERAGE SERVICES<br />
Explanatory Note<br />
Objective<br />
The data presented in this report are compiled from the results of the Annual Survey of Services<br />
2011. The objective of the survey is to gather information on the <strong>services</strong> sector for studying the<br />
structure and performance of the various activities in the sector. The data are also used for the<br />
compilation of national accounts, input-output tables and other related studies. In addition, the<br />
results are used by policy makers, economic planners, academicians, the business community<br />
and other interested users in their work.<br />
Scope & Coverage<br />
Food & <strong>beverage</strong> <strong>services</strong> comprise establishments engaged in the sale of prepared <strong>food</strong> and<br />
drinks for immediate consumption. The various types of <strong>food</strong> and <strong>beverage</strong> <strong>services</strong> are:<br />
Restaurants<br />
Fast <strong>food</strong> restaurants<br />
Food caterers<br />
Others<br />
Cafes, coffee houses and snack bars<br />
Food courts, coffee shops and eating houses (with mainly <strong>food</strong> & <strong>beverage</strong> income)<br />
Pubs (including bars)<br />
Other restaurants, cafes and bars<br />
Canteens<br />
Hawkers and stall-holders which are not registered with the Accounting & Corporate Regulatory<br />
Authority (ACRA) are excluded. Also excluded from the group are eating and drinking places<br />
which operate in connection with the provision of lodging.<br />
9
FOOD & BEVERAGE SERVICES<br />
Definition of Terms<br />
Establishment Defined as a business or organisation unit engaged in one activity and operating in a<br />
single location.<br />
Employment Refers to paid employees, working directors, working proprietors/partners and unpaid<br />
family workers. It includes those temporarily away on medical or casual leave.<br />
Employees Employment excluding working proprietors and partners.<br />
Operating Receipts Includes those arising from <strong>services</strong> rendered, commission charges, sale of goods and<br />
rental of premises, machinery and equipment.<br />
Operating Expenditure Refers to all current expenses connected to the business operations such as purchases<br />
of goods and <strong>services</strong>, remuneration, utilities and professional <strong>services</strong>. It includes<br />
depreciation and adjustment for changes in inventory.<br />
Operating Surplus Refers to the amount of operating receipts less operating expenditure plus depreciation of<br />
fixed assets.<br />
Value Added<br />
(At Basic Price)<br />
Comprises operating surplus, remuneration and taxes (less subsidies) on production.<br />
Remuneration Comprises wages and salaries, employers’ contribution to Central Provident<br />
Fund/pension funds and other benefits of all employees as well as fees paid to nonworking<br />
directors.<br />
Depreciation The value, at current replacement cost, of reproducible fixed assets such as buildings,<br />
plants and machinery used during a period of time as a result of normal wear and tear,<br />
foreseen obsolescence and the normal rate of accidental damage.<br />
Profitability Ratio Defined as the ratio of operating surplus to operating receipts. It shows the proportion<br />
of operating receipts that is converted to profits.<br />
Earnings-Expenditure<br />
Ratio<br />
Defined as the ratio of operating surplus to operating expenditure.<br />
10