Phase High-Performance Liquid Chromatography - IS3NA
Phase High-Performance Liquid Chromatography - IS3NA
Phase High-Performance Liquid Chromatography - IS3NA

Create successful ePaper yourself
Turn your PDF publications into a flip-book with our unique Google optimized e-Paper software.
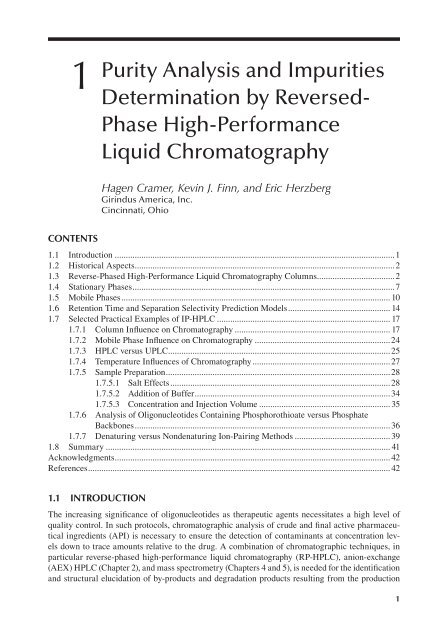
1Purity Analysis and ImpuritiesDetermination by Reversed-<strong>Phase</strong> <strong>High</strong>-<strong>Performance</strong><strong>Liquid</strong> <strong>Chromatography</strong>Hagen Cramer, Kevin J. Finn, and Eric HerzbergGirindus America, Inc.Cincinnati, OhioContents1.1 Introduction...............................................................................................................................11.2 Historical Aspects.....................................................................................................................21.3 Reverse-<strong>Phase</strong>d <strong>High</strong>-<strong>Performance</strong> <strong>Liquid</strong> <strong>Chromatography</strong> Columns...................................21.4 Stationary <strong>Phase</strong>s......................................................................................................................71.5 Mobile <strong>Phase</strong>s......................................................................................................................... 101.6 Retention Time and Separation Selectivity Prediction Models.............................................. 141.7 Selected Practical Examples of IP-HPLC............................................................................... 171.7.1 Column Influence on <strong>Chromatography</strong>....................................................................... 171.7.2 Mobile <strong>Phase</strong> Influence on <strong>Chromatography</strong>..............................................................241.7.3 HPLC versus UPLC....................................................................................................251.7.4 Temperature Influences of <strong>Chromatography</strong>...............................................................271.7.5 Sample Preparation.....................................................................................................281.7.5.1 Salt Effects....................................................................................................281.7.5.2 Addition of Buffer........................................................................................341.7.5.3 Concentration and Injection Volume............................................................ 351.7.6 Analysis of Oligonucleotides Containing Phosphorothioate versus PhosphateBackbones...................................................................................................................361.7.7 Denaturing versus Nondenaturing Ion-Pairing Methods............................................391.8 Summary................................................................................................................................. 41Acknowledgments............................................................................................................................ 42References........................................................................................................................................ 421.1 IntroductionThe increasing significance of oligonucleotides as therapeutic agents necessitates a high level ofquality control. In such protocols, chromatographic analysis of crude and final active pharmaceuticalingredients (API) is necessary to ensure the detection of contaminants at concentration levelsdown to trace amounts relative to the drug. A combination of chromatographic techniques, inparticular reverse-phased high-performance liquid chromatography (RP-HPLC), anion-exchange(AEX) HPLC (Chapter 2), and mass spectrometry (Chapters 4 and 5), is needed for the identificationand structural elucidation of by-products and degradation products resulting from the production1K11050_C001.indd 111/15/2010 6:28:54 PM
2 Handbook of Analysis of Oligonucleotides and Related Productsprocess. In clinical studies employing oligonucleotides, high sensitivity and low sample requirementfor analytical methods are requisite for the identification of metabolites (Chapter 8).1.2 Historical AspectsReversed-phase HPLC (RP-HPLC) is one of the most important techniques for the characterizationof oligonucleotides. Over the years, the ability to resolve impurities from the main productpeak has increased dramatically by introduction of smaller chromatographic particle sizes. Anotheradvantage of RP-HPLC is that mobile phases that work well for separating impurities and at thesame time are compatible with electrospray ionization mass spectrometry (ESI-MS) are available(see Chapter 4).Just 10–15 years ago, the typical particle size used for analytical reversed-phase columns was5 μm. To achieve good separations on 5 μm particle-size columns, fairly long columns were needed(up to 250 mm), resulting in long run times. Typically, these columns had a diameter of 4.6 mm. Inthe late nineties, the first columns with 3.5-μm particle size useful for oligonucleotide analysis cameto market. With the smaller particle-size beads, it now was possible to achieve better separations withshorter columns, reducing typical column length to 50 mm (up to 150 mm maximum). This resultedin shorter run times as well. In addition, more accurate HPLC pumps allowed reduction of the columndiameter to 2.1 mm, thereby further decreasing buffer consumption. Modern HPLC systems couldalso tolerate the attendant increased pressure associated with media having smaller particle sizes.Recently, even smaller particle sizes were introduced with the smallest ones useful for oligonucleotideanalysis being 1.7 μm. Particle sizes of below 1.7 μm, while useful for small moleculeanalytes, result in degradation of the oligonucleotide during analysis owing to the increased shearingforces present at these high back pressures. As it is, 1.7 μm particle-size sorbents generate backpressures of over 400 bar (ca. 6000 psi), making them incompatible with traditional HPLC systems.To achieve similar column plates without increasing back pressures, fused-core (also called coreshell)particle technology was introduced by Joseph J. Kirkland in 2007 1,2 based on his earlier workwith poroshell silicas. 3,4 Thereby, the all-porous particle typically used is replaced with a nonporouscore surrounded by a porous shell.While polystyrene-based columns have proven successful on the preparative scale owing to theirincreased chemical stability, the analytical reversed-phase HPLC market is dominated by silica gelor silica-based resins.1.3 Reverse-<strong>Phase</strong>d <strong>High</strong>-<strong>Performance</strong> <strong>Liquid</strong><strong>Chromatography</strong> ColumnsThere are multiple companies that offer reversed-phase HPLC columns. Table 1.1 lists commerciallyavailable silica-based reversed-phase HPLC columns. Columns most widely used in oligonucleotideseparations are available from Agilent (Zorbax), Phenomenex (Clarity), and Waters(X-Terra®, X-Bridge, Acquity BEH).Typical particle sizes for columns from all manufacturers used to be 5 μm for many years untilabout 10–15 years ago. In the mid to late 1990s, smaller particle-size columns were introduced andrecently sub-2 μm particles have started gaining in popularity. However, not all column manufacturersmade the switch to sub-2 μm particle-size resins. The use of sub-2 μm particle sizes allowsthe use of much shorter columns without losing separation power because theoretical plates can bemaintained. 5,6 A reduction of the particle diameter by 50% results approximately in a doubling ofthe plate count. Therefore, fast and efficient separations can be achieved because separation timeis proportional to column length. A shorter column run at the same velocity as a longer columnalso uses less solvent. However, the small particle sizes result in high back pressure a traditionalHPLC system cannot withstand. New ultra-high pressure systems had to be developed. These newsystems are called U-HPLCs or UPLCs and at this time only a handful of companies are offeringK11050_C001.indd 211/15/2010 6:28:54 PM
Purity Analysis and Impurities Determination 3TABLE 1.1HPLC Column ManufacturersManufacturer Brand Name Sub-2 μm ParticlesAdvanced <strong>Chromatography</strong> Technologies ACE No (3 μm minimum)Agilent Zorbax Eclipse Plus & Extend YesAzko-Nobel Kromasil No (2.5 μm minimum)Bischoff ProntoPEARL YesGrace/Alltech Alltime, Vydac, VisionHT YesBeckman-Coulter Ultrasphere ODS No (5 μm minimum)EMD/Merck LiChrospher No (5 μm minimum)GL Sciences Intersil No (2 μm minimum)Interchim Uptisphere No (5 μm minimum)Macherey-Nagel Nucleosil, Nucleodur YesPhenomenex Gemini, Luna & Clarity No (3 μm minimum)Resek Allure, Ultra, Pinnacle YesSepax GP series YesShimadzu/Shant Pathfinder YesSupelco Ascentis No (3 μm minimum)Thermo Hypersil Gold YesWaters X-Terra, X-Bridge & Acquity BEH YesYMC Several Yessuch systems, which are listed in Table 1.2. Systems are being improved continuously becauserequirements on components due to the increased pressure are much more rigorous in comparisonto traditional HPLC systems.Silica-based bead chemistry has traditionally been the state of the art because of its goodmechanical strength, spherical shape and high chromatographic efficiency, and compatibility with ahost of organic solvents. Two chief problems associated with the use of silica-based cores are resolutionof basic analytes and stability of the bonded phase toward low- and particularly high-pH mobilephases. Several modifications to the silica-bonded phase have been implemented in order to addressthese issues, 7 including incorporation of polar functional groups, 8 sterically hindered silanes, bidentate,or hybrid organic–inorganic stationary phases. 9The XTerra column, first introduced in 1999 by Waters (Milford, MA), uses patented hybrid particletechnology (HPT) to overcome traditional silica’s instability to high pH. The core bead is composedof a methylpolyethoxysilane (MPEOS) monomer synthesized by condensation of tetraethoxysilane(TEOS) and methyltriethoxysilane (MTEOS). XTerra’s stationary phase demonstrates equivalentefficiency to state of the art silica-based C18 columns while addressing the problem of pH instability.Hybrid particle technology, so named because it combines inorganic (silica) with organic (polymeric)bead chemistry, describes the replacement of one of every three silyl groups with a methyl group.TABLE 1.2UPLC SystemsManufacturer Name of System Pressure Limit, BarAgilent1200 Series1290 Infinity LC6001200Hitachi LaChrom ULTRA L-2160U 600Thermo Accela 1000Waters Acquity 1000K11050_C001.indd 311/15/2010 6:28:54 PM
4 Handbook of Analysis of Oligonucleotides and Related ProductsThe substitution of the methyl for the more polar silanol dramatically increases the hydrophobicityof the core structure of the particle backbone. The introduction of the hybrid particle offers increasedrobustness and improved resolution of basic compounds. In 2005, Waters launched a second generationhybrid column called XBridge with bridged ethyl hybrid (BEH) technology. The polyethoxysilanecore marketed as BEH technology relies on cross-linking TEOS with bis(triethoxysilyl)ethane(BTEE). The result was a material of much greater mechanical stability owing to the increased levelof crosslinking while maintaining the superior pH stability of hybrid columns. Those features makethe BEH technology also very attractive for ultra performance liquid chromatography instrument(UPLC) applications, where the increased pressures necessitate increased stability of the beads. BEHcolumns are available in a variety of particle sizes from 1.7 to 10 µm, which allows the BEH technologyto be adapted to both HPLC and UPLC applications. BEH technology based UPLC columns arecalled Acquity UPLC columns and were introduced shortly after the XBridge HPLC columns. Therecommended operating pH range for BEH-based columns is from 1 to 12.Column lifetime is dramatically impacted by pH, leading to partial hydrolysis of the bondedphase, and resulting in variable retention times and inconsistent performance. The prevailing useof BEH-based columns is mainly due to its robustness toward wide range of pH, stability towarddimethyl sulfoxide (DMSO) (important for analysis of crude RNA), and high mass loading capacity.The separation quality is comparable to capillary gel electrophoresis without compromisingyield. The BEH-based columns are advantageous for the analysis of dye or lipidoyl labeled oligosbecause the added hydrophobicity increases separation efficiency. The BEH-based columns areavailable in variety of phases (C18, C8, Phenyl, and Shield RP18) and also boast long column lifetime(>1000 injections) at elevated temperatures (60°C).Zorbax Eclipse Plus columns were introduced by Agilent (Santa Clara, CA) in 2006 and areoffered at particle sizes of 1.8, 3, and 5 μm to accommodate a wide range of analytical HPLC applications.Eclipse Plus columns are available at multiple selectivity choices (C18, C8, and Phenyl)for optimized resolution of all sample types and provide high resolution and excellent peak shapeof all types of compounds at pH 2–9. Eclipse Plus columns achieve superior performance throughextra dense bonding and a precise double-endcapping process. Agilent also offers columns especiallydeveloped for low- and high-pH applications. Zorbax SB (StableBond) columns are madeusing bulky, unique silanes that sterically protect the siloxane bond not including any acid-labileendcapping. The result is vastly improved column life and extraordinary chemical and temperaturestability in the pH 1–6 range for a wide variety of phases (SB-C3, SB-CN, SB-Phenyl, SB-C8, andSB-C18). Zorbax Extend-C18 columns incorporate a unique bidentate ring structure, having a propylenebridge in combination with the bulky C18 group, thereby shielding the silica support fromdissolution. Such bonded silanes, combined with a double-endcapping process, protect the silicafrom dissolution at high pH—up to pH 11.5.Porous outer layer0.35 μmSolid core1.9 μm 2.6 μm0.35 μmFIGURE 1.1 Fused-core/core-shell particle technology (Kinetex 2.6-μm column dimensions as an example).K11050_C001.indd 411/15/2010 6:28:54 PM
Purity Analysis and Impurities Determination 5TABLE 1.3Fused-Core/Shell-Core HPLC ColumnsManufacturer Brand Name Particle Size (Core/Outer Layer), μmAgilent Poroshell 120 2.7 (1.7/2 × 0.5)MAC-MOD Analytical Halo 2.7 (1.7/2 × 0.5)Phenomenex Kinetex 2.6 (1.9/2 × 0.35)1.7 (1.25/2 × 0.23)Supelco Ascentis Express 2.7 (1.7/2 × 0.5)Silica-based sorbents of RP-HPLC column used for oligonucleotide analysis typically have poresizes of about 100 Å. For the three examples given above, the pore sizes are 120 Å for the XTerra,135 Å for the XBridge, and 95 Å for the Zorbax Eclipse Plus. However, for larger oligonucleotides,for example aptamers, 300 Å pore size columns tend to yield better results.Fused-core or shell-core technology provides an elegant way around the pressure limits of traditionalHPLC-systems. Particles with a solid core and porous shell behave in regards to pressure likean equivalently sized fully porous particle while theoretical plate numbers are similar to a sub-2μm particle column (see Figure 1.1). Originally developed by F. F. Kirkland (Advanced MaterialsTechnology, Wilmington, DE), 1,2,10 such columns are now available from several different companies(see Table 1.3) and are comparable in performance to sub-2 μm columns. 11 Kinetix columns areavailable as C 18 and pentafluorophenyl (PFP) for a variety of separation applications.The key feature of the fused-core technology is a spherical porous shell grown on the surfaceof a solid silica-based bead. It addresses two of the most critical effects of column performance—the eddy diffusion (also known as the multipath effect) and resistance to mass transfer. 12 Shown inFigure 1.2 is a Van Deemter plot 13 —a graphical description of the three parameters that most contributeto band broadening: (1) the eddy diffusion or “A term,” governed by the particle size, (2) thelongitudinal diffusion or “B term,” and finally (3) the “C term,” which is related to the kinetics ofresistance to mass transfer. By controlling the particle-size distribution, the band broadening effectof eddy diffusion is dramatically diminished. The A term, in accordance with the Van Deempterplot, is independent of mobile phase velocity and is related solely to average diameter of the particle.The C term is also dependent on particle size.The distribution of analyte molecules in the stationary phase and the mobile phase is governedby the kinetics of diffusion between the two phases for the analyte. By introducing a semi-porous(rather than fully porous shell), the analyte spends less time diffusing in and out of pore on theH = A · d particle+ B/μ + C · d e2· μPlate height (H)BCMobile phase velocity (μ)AFIGURE 1.2 Van Deempter plot and equation of plate height (H) vs. mobile phase velocity (μ); A: eddydiffusion; B: longitudinal diffusion; C: kinetics of resistance to mass transfer; d particle : particle diameter; d e :effective particle size. d e represents the effective particle size and is equal to the particle diameter in the caseof fully porous particles.K11050_C001.indd 511/15/2010 6:28:54 PM
6 Handbook of Analysis of Oligonucleotides and Related ProductsPlate height (H)Minimum HBCAOptimumvelocityMobile phase velocity (μ)FIGURE 1.3 Typical Van Deempter plot of plate height (H) vs. mobile phase velocity (μ).stationary phase, thus reducing the dispersive effect known as resistance to mass transfer. Figure1.3 depicts a typical Van Deempter plot. The resistance to mass transfer, or C term, is carried by thesquare of the effective particle size and varies sharply at high flow rates.By minimizing the particle size, the Eddy diffusion A term and mass transfer C terms are minimizedand the result is an ability to carry out separation at higher mobile phase flow rates withoutsacrificing plate height. Figure 1.4 represents a more optimized Van Deempter plot resulting fromthe use of smaller particle size.Silica-based resins have dominated the analytical HPLC market of microparticulate sorbentssince the inception of HPLC almost 40 years ago. While polystyrene-based particles are widelyused in larger-scale purifications, there are only a few reports on their use in analytical HPLC.The PRP-1 column from Hamilton, NV, was introduced in the early 1980s and has since then beenemployed for preparative, 14–16 as well as analytical oligonucleotide separations. 17,18 The PRP columnsare polymeric reversed-phase column and are composed out of a copolymers of styrene anddivinylbenzene (PS-DVB) and are available at particle sizes of 5–20 μm and at pore sizes of 100(PRP-1) and 300 Å (PRP-3). The ruggedness of the PS-DVB particles make such columns an attractivechoice for high-pH applications or when the analyte or crude sample is contaminated with otheraggressive chemicals not compatible with silica (e.g., RNA purifications).Over the years others have reported the use of PS-DVB columns for the analysis and purificationof oligonucleotides as well. Huber et al. reported good resolution of phosphorylated from dephosphorylatedoligonucleotides when using columns filled with PS-DVB acquired from Riedel-de Haën(Seelze, Germany) and adding poly(vinyl alcohol) during polymerization. 19,20 Gelhaus et al. wasPlate height (H)Minimum HBCAOptimumvelocityMobile phase velocity (μ)FIGURE 1.4 The effect of smaller particle size on the Van Deempter plot.K11050_C001.indd 611/15/2010 6:28:55 PM
Purity Analysis and Impurities Determination 7able to achieve separation of 18-mers of the same base sequence but with differing alkyl modificationswith a OligoSep column (Transgenomics, Omaha, NE) comprised of nonporous, C18 modifiedpolystyrene-divinylbenzene (PS-DVB). 21Lloyd et al. reported good resolution for long oligonucleotides and double-stranded DNA laddersusing PLRP-S columns (Polymer Laboratories, UK). These columns are based on rigid macroporousreversed-phase poly(styrene–divinylbenzene)–based sorbents and come at many different poresizes of 100 to 4000 Å. 22For more than 40 years, columns packed with microparticulate sorbents have been successfullyused in high-performance liquid chromatography (HPLC). Despite many advantages, HPLC columnspacked with microparticulate, porous stationary phases have some limitations, such as therelatively large void volume between the packed particles and the slow diffusional mass transfer ofsolutes into and out of the stagnant mobile phase present in the pores of the separation medium. 23One approach to diminish the problem of restricted mass transfer and interparticle void volume isthe use of monolithic chromatographic beds, in which the separation medium consists of a continuousrod of a rigid, porous polymer that has no interstitial volume but only internal porosity. Becauseof the absence of interparticle volume, all of the mobile phase is forced to flow through the pores ofthe separation medium. 24 According to theory, mass transport is enhanced by such convection andenhances chromatographic efficiency. 25 Monolithic chromatographic beds are usually prepared bypolymerization of suitable monomers and porogens in a stainless steel or fused silica tube that actsas a mold. 26 The porous structure is achieved as a result of the phase separation that occurs duringthe polymerization of a monomer or a mixture of both a cross-linking monomer and a porogenicsolvent. 27Huber and coworkers have demonstrated that the chromatographic separation performance ofcross-linked, norbornene-based, monolithic capillary columns prepared via ring-opening metathesispolymerization (ROMP) indicates good separation capabilities for single- and double-strandednucleic acids. 28 Such monolithic columns were able to separate diastereoisomers of short phosphorothioateoligonucleotides. Longer PS oligomers coalesced into a single peak, where peak widthsdecreased with increasing length of the oligonucleotides. Four homologous oligodeoxynucleotides,ranging in length from 24 to 27 nucleotides, could be baseline separated within 7 min using a triethylammoniumacetate buffer and an acetonitrile gradient. Over the years, Huber and others havepublished extensively on the analysis of oligonucleotide and nucleic acids using monolithic capillarycolumns. 29–42Further, Huber and coworkers proposed a new model for predicting the retention time ofoligonucleotides. 43,44 Their model is based on support vector regression using features derived frombase sequence and predicted secondary structure of oligonucleotides. Because of the secondarystructure information, their model is applicable even at relatively low temperatures where the secondarystructure is not suppressed by thermal denaturing.1.4 Stationary <strong>Phase</strong>sThe most commonly used stationary phase in reversed-phase HPLC is based on octadecylsilane(ODS) or C18 groups. There are several reasons for this, but one of the strongest is tradition. Earlycolumn packings were based on C18 because C18-based silanes were readily available at that timeand reasonable in cost. Another reason for the popularity of C18 is the relatively high organic contentthat can be reacted onto silica supports. In addition the long-chain C18 ligand shows greaterstability at both low and higher pH, compared to shorter chain ligands resulting in better separationreproducibility. However, there are some disadvantages to C18 bonded phases packings. Columnpackings with shorter functional groups can reequilibrate more rapidly after a gradient elutionseparation. Densely bonded C18 packings can also exhibit phase collapse when mobile phasescontain a high aqueous content. 45 Often, the starting concentration of organic modifier must be lessthan 5% for adequate separation of very polar compounds. When exposed to high concentration ofK11050_C001.indd 711/15/2010 6:28:55 PM
8 Handbook of Analysis of Oligonucleotides and Related Productsaqueous buffer, the densely packed C18 hydrophobic phase tends to minimize its surface area byself-association with attendant dewetting, a phenomenon known as phase collapse (see Figure 1.5).The folding of the stationary phase on itself results in inability of the surface to come into contactwith the mobile phase, and the consequence is poor chromatography marked by increased tailingand retention time variability. The phenomenon is much less common when shorter bonded phasesare used.Reversed-phase column packings with aliphatic C18 groups are predominantly used for the analysisof oligonucleotides. While historically ion-pair RP-HPLC was well suited for the separation ofphosphodiester oligonucleotides (PO-ONs), initial separation of phosphorothioate oligodeoxynucleotides(PS-ODNs) failed. 46 The difference in retention time between phosphodiester and phosphorothioateoligonucleotides is drastic. The replacement of PO with PS linkages between bases oftendoubles the retention time owing to the highly lipophilic nature of the phosphorothioate bond. Thecreation of a chiral center on the phosphorous center upon incorporation of the sulfur atom changesthe physical and chemical properties of the modified molecule and leads to the formation of a setof 2 n diastereoisomers, where n is the number of chiral internucleotide linkages. The substitution ofPO for PS in the internucleosidic backbone results in substantial peak broadening. 47,48 However, thislimitation has changed dramatically over the years, and today the resolving power of RP-HPLC iswell suited for PS oligos as well and comparable to the separation efficiency of capillary gel electrophoresis(CGE) (see Figure 1.6). However, HPLC is a much more robust technique than CGE andtherefore has replaced CGE in many applications.The relative differences in the length (hydrophobicity) or charge of N and N–1 oligonucleotidesare small. HPLC separation is difficult and becomes more challenging as N increases. In addition,slow mass transfer (diffusion) of high molecular weight analytes within sorbent pores further complicatesthe separation owing to peak broadening. For that reason, historically, the best resolutionof oligonucleotides has been achieved with nonporous 49 or superficially porous chromatographicsorbents (core-shell technology, see Section 1.3). 1,2,10 However, owing to the low mass load capacityof nonporous sorbents, today only porous or superficially porous sorbents are being applied tooligo nucleotide analysis. Smaller particle size of the packing material decreases the diffusion pathof molecules and provides for high chromatographic performance. In combination with high temperatures,relatively slow flow rates, and shallow gradients, a separation of N from N–1 for up to60-mer oligonucleotides is achievable. 50C18 columns tend to be too lipophilic for the analysis of certain modified oligonucleotides.Therefore, in the case of cholesterol or other lipid conjugates, C8 or sometimes C4 columns arepreferred over C18 columns. Recently, however, there has been an increase of stationary phaseswith other functionalities for use in reversed-phase HPLC. Such stationary phases provide differentseparation selectivity than traditional C18 or C8 stationary phases and are especially useful whenthe chromatographer is restricted to using a particular mobile phase such as in LC–MS studies.Varying selectivity by changing the stationary phase is an effective alternative to changing the(a)CH 3 OHH 2OCH 3 OH(b)H 2OH 2OSiO 2CH 3OHH 2OH 2OSiO 2H 2OH 2OH 2OH 2OH 2OFIGURE 1.5 Depiction of a) normal interaction of the C 18 bonded phase with the mobile phase; b) phasecollapsedsituation.K11050_C001.indd 811/15/2010 6:28:55 PM
Purity Analysis and Impurities Determination 9System:CGE column:Injection:Running:Temperature:Capillary gel electrophoresis systemPEG sleving matrix (BioCap 75 μm × 27.5 (to detector)/34.5 cm (total length)45 injection at 5 kV15 kV30°C3010 15UV 260 nm1222 minLC system:Column:Mobile phase:Flow rate:Column Temperature:Gradient:Detection:Water ACQUITY UPLC SystemACQUITY OST C 18, 1.7 μm (2.1 × 50 mm)A: 15 mM TEA, 400 mM HFIP, ph 7.9B: 50% A, 50% MeOH0.4 mL/min60°C40 to 48% B in 4 min(20–24% MeOH)260 nm202530350 4 minFIGURE 1.6 Comparison of CGE and IP-HPLC separation of deoxythymidine ladders. (Courtesy of WatersCorporation.)mobile phase, and this approach is being used more frequently. Typically, stationary phases used areC18, C8, phenyl, and fluoro or a combination thereof. Different commercial C18 columns also oftenshow different separation selectivities, usually based on differences in silica supports or stationaryphase chemistry.Typical solute-column interactions are based on hydrophobic, steric resistance, hydrogen bonding,ionic and London dispersion (also called dipole-dipole) forces. 51 Phenyl columns show additionalπ–π but less hydrophobic interactions. Phenyl columns, such as phenylpropyl or phenylhexylcolumns, are less commonly used for RP-LC separation. The selectivity of phenyl columns differsfrom that for alkyl-silica columns. π-Acids, such as aromatics, are preferentially retained by π–πinteractions on phenyl versus alkyl-silica columns. The enhanced retention of π-acids varies withthe organic solvent in the mobile phase as: tetrahydrofuran (least) < acetonitrile < methanol (most).Phenyl columns also show stronger dispersion interactions versus (less polarizable) C8 or C18 columns.The reduced hydrophobicity of phenyl versus alkyl groups leads to smaller hydrophobic andsteric interactions, possibly because the phenyl groups are more ordered.Perfluorinated alkyl or phenyl ligands are the basis of so-called fluoro columns. Solutes of lowerrefractive index (and lower molecular polarizability) are more strongly retained on fluoro-alkylcolumns, relative to a C8 or C18 column. Polyaromatics are less retained on the fluoro-alkyl columnK11050_C001.indd 911/15/2010 6:28:55 PM
10 Handbook of Analysis of Oligonucleotides and Related Productsthan substituted benzenes, while aliphatic solutes are more retained. Fluoro-substituted aromaticsshow even larger retention factor on fluoro columns. This behavior has been attributed to differencesin solute–column dispersion interactions for fluoro-alkyl columns, as a result of the muchlower polarizability of fluoro-alkyl columns. 511.5 Mobile <strong>Phase</strong>sThe term reverse-phased chromatography describes a separation technique utilizing a bondedphase (stationary phase) composed of a polystyrene- or silica-based bead covalently modified withnon polar groups. The technique differentiates itself from “normal” phase chromatography withalumina or silica in that polar compounds are the first to elute followed by more hydrophobic components.While reverse-phased chromatography relies solely on hydrophobicity as a mechanism ofseparation, ion-pairing chromatography describes a technique in which a long-chained alkyl amineis added in low concentration to the mobile phase in order to achieve enhanced resolution. 52–54 Theexact nature of ion-pairing phenomenon has been the subject of debate for several decades; however,it is now generally accepted that an ion-pairing reagent such as a tri- or tetraalkylammoniumsalt, when added to the mobile phase, is capable of associating with the nonpolar stationary phasethrough dynamic hydrophobic interactions as represented in Figure 1.7.The charged ammonium ion, in turn, acts as an ion exchanger along the surface of the stationaryphase and provides a means to separate charged species bearing hydrophobic groups accordingto charged state. The actual mechanism is certainly more complex, given the both the presenceof multiple charged species in the solvent mixture. The retention and order of elution is primarilygoverned by1. Charge of the oligonucleotide, whereby retention time increases in proportion to the numberof charges in the oligonucleotide.2. Length of alkyl chain in the ion-pairing reagent; increased hydrophobicity in the ionpairingreagent leads to extended retention.3. Proportion of organic solvent in the mobile phase; 55 retention is decreased by higher concentrationof organic solvent.Varying separation selectivity by optimizing the mobile phase is the most powerful approach foroptimizing separation resolution. 56 Selection of mobile phase for ion-pair (IP) HPLC is a criticalparameter. While triethylammonium acetate (TEAA) is the most commonly used ion-pairing buffercomponent, 57 a variety of other systems have been employed in IP chromatography of nucleosidesand oligonucleotides, including tetrabutylammonium hydrogen sulfate, 58,59 tetrabutylammoniumiodide, 60 tetrabutylammonium phosphate, 61 tetrabutylammonium acetate, 16 tetrabutylammoniumbromide (TBAB), 62 tributylammonium acetate (TBAA), 63 ethylenediamine acetate, 64 hexylammoniumacetate (HAA), 65–67 triethylammonium bicarbonate (TEAB), 42 and triethylamine in combinationwith hexafluoroisopropanol (HFIP). 12,68–73 The use of HFIP and TEAB as an ion-pairing agentOligonucleotide analyteOBaseOOOPO O-N +ion-pairing reagentC18 attached to supportFIGURE 1.7 Association of an oligonucleotide with an ion-pairing reagent at the surface of a C 18 support.K11050_C001.indd 1011/15/2010 6:28:55 PM
Purity Analysis and Impurities Determination 11is particularly attractive because it is compatible with MS coupling to HPLC (refer to Chapter 4) andoften provides excellent separation. Once only used for LC/MS separations, HFIP is now used aswidely as TEAA because of its unique ion-pairing ability. Gilar et al. found that in hetero-oligonucleotideladders, oligonucleotides one nucleotide apart could overlap or even reverse retention orderwhen using a TEAA-based buffer system for the separation due to the different hydrophobicity ofthe different bases (see Figure 1.8) (hydrophobicity increases in the following order: C < G < A
12 Handbook of Analysis of Oligonucleotides and Related Productsadded. HFIP or other organic polyfluorinated alcohols, also called additives or organic modifiers,can be added to either polar or nonpolar mobile phases. The use of such organic modifiers leads notjust to improvements in separation but also to the extension of silica-based column lifetimes. 74McCarthy et al. compared several ion-pairing systems for their usefulness in the separation ofa homo-oligonucleotide and hetero-oligonucleotide ladder. 75 For their investigation they includedTEAA, TEA/HFIP, dimethylbutylammonium acetate (DMBAA), tripropylammonium acetate(TPAA), TBAA, and HAA as ion-pairing reagents. Resolution of the homo-oligonucleotideladder improved with increasing concentration and hydrophobicity (alkyl chain length) of the ionpairingreagent. Separation efficiency (or peak capacity) decreased with oligonucleotide length andmore hydrophobic ion-pairing reagents such as HAA started to outperform TEA/HFIP system inresolution of longer oligonucleotides (30- to 35-mers). In the separation of hetero-oligonucleotideladders ion-pairing systems performed better, which separated based predominantly by a chargebasedmechanism. Separation improved from TEAA < DMBAA < TPAA < TEA/HFIP ~ HAA.McKeown et al. looked into the effect of several different parameters on the retention behavior ofa series of poly dT oligonucleotides (5- to 18-mer) under isocratic conditions using RP IP-HPLC. 62They study the effects of temperature, pH, eluent ionic strength, percentage organic modifier, concentration,and alkyl chain length of the ion-pairing reagent using a Kromasil C18, 100 Å, 5 μmparticle-size column (250 mm × 4.6 mm). Reversed-phase chromatography using a 100 mM ammoniumacetate buffer resulted in broad co-eluting peaks and incomplete resolution of the individualoligonucleotides from the poly dT mixture, confirming the need of ion-pairing reagents for an effectiveresolution of oligonucleotides, which was also shown by others. 67 The effect of the hydrophobicityof the alkylammonium ion-pair reagent on retention of the oligonucleotides was investigated forfive different ion-pairing reagents: tetramethyl- (TMAB), tetraethyl- (TEAB), tetrapropyl- (TPAB),tetrabutyl- (TBAB), and tetrahexyl- (THAB) ammonium bromide. The retention of the oligonucleotideswas directly related to the alkyl chain length of the ion-pairing reagent. With the shortestalkyl chain length ion-pair reagent (TMAB) the analytes were all unretained, but complete retentionof all the analytes was observed with the longest alkyl chain length (THAB). The percentageacetonitrile in the mobile phase was observed to be of critical importance in the optimization of theseparation. 76–78McKeown et al. was able to show that an increase in column temperature caused a decrease inthe retention of oligonucleotides, with longer chain length oligonucleotides being more affected bychanges in temperature than smaller chain lengths. From pH 4.8 to 6.8, he found a decrease in theretention of all oligonucleotides. This retention time shift was unexpected because the charged backboneis comprised of strong acids with a pK a value of about 1. 79 Over the entire pH range studied,the phosphodiester groups are therefore fully ionized. He therefore concluded that the proportionof ionized silanol groups was reduced at lower mobile phase pH, resulting in a reduction of negativecharge on the surface of the silica-based packing material thereby influencing the separations.Such unreacted acidic silanols are known to be present on most reversed-phase silica materials witha wide variety of pK a values being reported. 80 Depending on the sorbent, only about 25% of totalalkylammonium ions perform ion-pair functions with the other 75% interacting and electrostaticallyneutralizing residual silanol groups. 81McKeown et al. found that increasing the concentration of TBAB from 1.5 to 10 mM resulted inan increase in retention for all the oligonucleotides. At higher concentration, sorbent surface mightbecome saturated with the ion-pairing reagent or micelles are being formed in solution, which canlead to a reduced availability of adsorption sites and hence decreased retention. However, because ofTBAB’s solubility limit of 10 mM in water, McKeown et al. was not able to extend his studies intohigher buffer concentrations using this particular ion-pairing buffer.An efficient oligonucleotide separation is dependent on the concentration of both triethylamine(TEA) and hexafluoroisopropanol (HFIP). 70 The role of the triethylammonium cation, the activeion-pairing agent, is well understood. An increase in TEA concentration improves ion-pairing efficiencyand, consequently, the separation selectivity. A more efficient ion-pairing mechanism alsoK11050_C001.indd 1211/15/2010 6:28:56 PM
Purity Analysis and Impurities Determination 13results into an increase in retention time. Because the pKa of TEA is 10.7, a side effect of anincreased TEA concentration is a rise of mobile phase pH, which may reduce the lifetime of silicabasedcolumns. However, the hybrid organic–inorganic silica of BEH-based columns is highlystable up to a pH of 12.HFIP’s role on the ion-pairing efficiency of the buffer is less clear. An increase in the HFIP concentrationfrom 100 to 400 mM results in better separation efficiency, but because HFIP is not anactive ion-pairing agent, its effect could only be indirect. One possible explanation is that the limitedsolubility of TEA in aqueous HFIP solutions changes the distribution of TEA between the mobileand stationary phases and forces the triethylammonium ion adsorption on the sorbent surface. This,in turn, enhances the ion-pairing retention mechanism and improves the separation performance.In fact, the most successful ion-pairing system represents the maximum concentration of TEA (16.3mM) that is soluble in 400 mM HFIP aqueous solution at ambient temperature. This buffer providesfor more efficient separation than traditional TEAA ion-pairing buffers, in which longer gradientswere required to achieve similar column peak capacity. Gilar et al. showed that only marginal separationwas achieved using the TEAA buffer system, whereas baseline resolution of all 19- to 25-merpeaks was obtained using a TEA-HFIP mobile phase. 70 A very important feature of HFIP is that itreduces the impact of oligonucleotide hydrophobicity on retention, 12 which appears to be crucial forthe separation success of phosphorothioate oligonucleotides (PS-ONs).(a)20˚CPurified duplexCrude lowerCrude upper0 Minutes 10(b)60˚CPurified duplexCrude lowerCrude upper0 Minutes6FIGURE 1.9 Comparison of single strand and duplex analysis at 20°C and 60°C. (a) Analysis of singlestrands and duplex at 20°C; (b) analysis of the single strands and duplex under denaturing (60°C) conditions;Mobile phase A: 25 mM HAA, pH 7.0; mobile phase B: 100% methanol; gradient 30–40% methanol in10 min; column: Aquity UPLC OST C18. 1.7 µm, 2.1 mm × 50 mm (courtesy of Waters Corporation).K11050_C001.indd 1311/15/2010 6:28:57 PM
14 Handbook of Analysis of Oligonucleotides and Related ProductsThe mobile phase requirements for the analysis of double-stranded oligonucleotides are somewhatdifferent. While there are reports of using the TEA-HFIP ion-pairing system for the analysisof siRNA duplexes, 82,83 because of HFIP denaturing properties, McCarthy et al. relied on TEAA(100 mM) and HAA (25 mM) buffer systems for the analysis and purification of double-strandedRNA and DNA to increase the stability of the duplexes under IP-HPLC conditions. 67 Approachingthe melting temperature, dramatic peak broadening occurs, indicating on-column duplex melting.Duplex melting is accompanied by an appearance of complementary oligonucleotides. For this reason,20°C was selected as a generic separation temperature. While it is well established that retentiontimes of single stranded oligonucleotides are strongly sequence dependent, 12,43,44,50,84 McCarthyet al. found that the retention time of all three double-stranded oligodeoxynucleotides (19-merdsDNA) used for their investigation were sequence independent. He concluded that IP-HPLC retentionof double-stranded oligonucleotides is predominantly driven by charge-to-charge interactionand that dsDNA or siRNA are therefore more retained by the RP-column than their correspondingsingle strands, making RP IP-HPLC useful for the purification of on-column annealed siRNA. SeeFigure 1.9 for analytical traces of the crude single strands and the purified duplex at 20°C (nondenaturingconditions; duplex intact) and 60°C (denaturing conditions, duplex elutes as two singlestrands) using a BEH-based Acquity UPLC OST C18 column (2.1 × 50 mm, 1.7 μm particle size)and a 25 mM HAA buffer system with an acetonitrile gradient.1.6 Retention Time and Separation Selectivity Prediction ModelsIn HPLC, retention time (RT) is the most important parameter governing the separation of solutesand is often used for the qualitative identification of oligonucleotides. The study of the relationshipbetween the retention time and the sequence of an oligonucleotide can be a useful tool to optimizethe conditions for the separation of a particular oligonucleotides mixture. 85The commonly used method, linear free energy relationship (LFER) describing the behavior ofsolute molecules at the liquid–solid interface, models retention time as a sum of individual energycontributions (dispersion, dipole–dipole, π–π, proton donor–acceptor interactions, etc.). 86 However,this prediction model becomes inaccurate when modeling more complex molecules such as oligonucleotidesbecause their relevant parameters are difficult to determine. Alternatively, quantitativestructure retention relationship (QSRR) provides a promising method for retention time predictions.Gilar et al. developed models by simple summation of the retention contributions of the individualnucleotides obtained from experimentally determined homo-oligonucleotides. 12 Their model wasbased only on oligonucleotide length and base composition. Huber and coworkers used supportvector regression (SVR) to develop their model, which included oligonucleotides having a lengthof 15–48 over a wide temperature range. The model took into consideration information of length,sequence, and predicted secondary structure 43,44A different approach to retention time prediction was taken by Lei et al. 84 Base sequence autocorrelation(BSA) features for oligonucleotides were calculated by weighting constitutional, topological,geometrical, electrostatic, and quantum-chemical features of the four bases (A, T, C, andG) obtained from CODESSA. 87 By having these features calculated based only on sequence, all theoligonucleotides could be represented in numerical form and optimum models were obtained byemploying multiple linear regression (MLR) combined with genetic algorithm (GA) feature selection.The derived linear models showed equally good performance compared to works by Huberand coworkers, 43,44 but without the need of secondary structure prediction. A novel strategy to predictthe retention time at any temperature was also proposed.Gilar et al. developed a separation selectivity (or peak capacity) model for oligonucleotides andcompared it to empirical data derived from IP-HPLC analyses of oligonucleotide ladders using aBEH- based Acquity UPLC column (50 mm × 2.1 mm, 1.7 μm) and TEAA or TEA/HFIP buffersystems. 71 They showed that the overall sample peak capacity is nothing but the sum (or the integral)of the resolutions in the HPLC chromatogram. The position of the peak capacity maximumK11050_C001.indd 1411/15/2010 6:28:57 PM
Purity Analysis and Impurities Determination 15is rather insensitive to the molecular weight of the oligonucleotide. The peak capacity model wasdeveloped for homo-oligonucleotides. Separation of hetero-oligonucleotides partially depends ontheir sequence. Also, peak capacity cannot be reliably calculated for oligonucleotides with strongsecondary structure.The retention factor B is dependent on the molecular weight of the oligonucleotide and the logarithmof this factor B varies linearly with the logarithm oligonucleotide’s molecular weight. Whenplotting the logarithm of oligonucleotide molecular weight as a function of the logarithm of theretention factor, the resulting line was shown to correlate closely with experimental data. The interceptand the slope of the equation may change with temperature, the type of stationary phase,organic modifier (acetonitrile, methanol, isopropanol, etc.), and the nature of the ion-pairing system.2530 0.6% MeCN/min7 Minutes 112530 0.45% MeCN/min8Minutes 13.525300.3% MeCN/min9Minutes182025300.15% MeCN/min406012 Minutes30FIGURE 1.10 Decreasing gradient slope increases resolution but negatively impacts analysis run time.Fifteen- to sixty-mer oligodeoxythymidine separation using different gradient slopes; Mobile phase A: 100mM TEAA; mobile phase B: 20% acetonitrile in 100 mM TEAA; gradient was 40–70% B; Column: AcquityOST C18, 1.7 µm, 2.1 mm × 50 mm at 60°C (courtesy of Waters Corporation).K11050_C001.indd 1511/15/2010 6:28:57 PM
16 Handbook of Analysis of Oligonucleotides and Related ProductsIt was shown theoretically and experimentally that the slope is much steeper for the TEA/HFIP thanwith the TEAA ion-pairing system, which means that TEA/HFIP is a more efficient system for theseparation of oligonucleotides than TEAA. 12,50,71Gilar et al. investigated the impact of sorbent particle size, column length, and gradient time onthe retention factor and compared theoretical to experimental data. 71 Not surprisingly, the best peakcapacity was obtained for the column packed with the smallest particle size sorbent. Intriguingly,gains in resolution for longer columns are not as pronounced as one might expect. At constant gradientrun time the gradient slope is proportionally shallower for shorter columns. In other words,the peak capacity of longer columns is reduced by proportionally sharper gradient, which tends toConstant gradient slope (volume)3.9% ACN in 5.2 mL25300.8 mL/min6.5 min gradient0.6% MeCN/min1.8 Minutes 6.625300.4 mL/min13 min gradient0.3% MeCN/min3.0 Minutes 11.52530 0.2 mL/min26 min gradient0.15% MeCN/min6.0 Minutes 23.020253040 50 600.1 mL/min52 min gradient0.075% MeCN/min10.0 Minutes44.0FIGURE 1.11 Maintaining most of the resolution while decreasing analysis time by increasing the flow rate andproportionally reducing the gradient time. Fifteen- to sixty-mer oligodeoxythymidine separation using differentgradient slopes; Mobile phase A: 100 mM TEAA; mobile phase B: 20% acetonitrile in 100 mM TEAA; gradientwas 40–70% B; Column: Acquity OST C18, 1.7 µm, 2.1 mm × 50 mm at 60°C (courtesy of Waters Corporation).K11050_C001.indd 1611/15/2010 6:28:57 PM
Purity Analysis and Impurities Determination 17reduce or eliminate the positive impact of higher column efficiency. The full benefits of longer columnsin a gradient separation are only realized when changing the gradient duration in proportionwith the column volume (length).IP RP-HPLC analysis of oligonucleotides is typically performed with shallow gradients.Decreasing gradient slope increases resolution, but negatively impacts analysis throughput byincreasing run time (see Figure 1.10).While an increase in the flow rate decreases the separation efficiency, the resulting loss in peakcapacity is less detrimental compared to using sharper gradients. Therefore, for the fast analysisof oligonucleotides it is more practical to maintain a relatively shallow gradient and reduce theanalysis time by increasing the flow rate and gradient time proportionally thereby maintaining aconstant gradient slope. The number of column volumes remains constant. The separation selectivityremains unchanged with only some loss of resolution (see Figure 1.11).1.7 Selected Practical Examples of IP-HPLCThe choice of column, mobile phase composition, temperature, instrument, and the method of samplepreparation are all critical parameters for an effective purity analysis of oligonucleotides. In thefollowing section, the authors have attempted to compile a broad range of spectral data from theirown work to demonstrate the use of IP-HPLC as a powerful tool for the analysis of oligonucleotides.These examples aptly illustrate the uniqueness of each oligonucleotide sequence. In our experience,there is no “one size fits all” approach to separation and analysis of oligonucleotides, and this isdemonstrated by the necessity of screening a series of columns and mobile phases for use with eachsequence of interest.In the course of our work, we routinely synthesize and characterize sequences belonging to abroad range of oligonucleotide subclasses, such as antisense, immunostimulatory oligonucleotides,aptamers, small interfering RNA (siRNA), microRNA (miRNA), decoys, and splice modulators.The following list gives a brief overview of the kind of modifications that are routinely incorporatedinto oligonucleotides when making the above mentioned subclasses: phosphodiester andphosphorothioate DNA, duplex and single strand RNA, 2′-modified RNA, LNA, gapmers, chimericsequences, conjugates, aptamers, PEGylated oligonucleotides, backbone modified sequences, andsequences containing modified or unnatural nucleoside bases. The analysis of modified oligonucleotides,particularly ones bearing lipophilic groups such as cholesterol or long chain fatty acid esters,sometimes require the use of C4 or C8 columns instead of the standard C18 reverse phased column.For the synthesis of duplex RNA, denaturing as well as nondenaturing methods must be availablefor characterization of the duplex. Large-scale manufacturing of oligonucleotides typically relieson preparative anion exchange purification for several reasons. Preparative anion exchange (AEX)chromatography is generally more efficient than preparative IP RP-HPLC; it converts the oligonucleotideinto the sodium form during purification, and it can be performed using low-pressureHPLC equipment. However, the purified oligonucleotide elutes under high salt conditions. Pools orfractions containing high salt levels are sometimes difficult to analyze and require sample preparationprior to IP-HPLC analysis. Some techniques for improved chromatography of high-salt samplesare included below. While it is understood that method optimization will be essential for each newsequence, the following sections should be helpful in the selection of parameters that one must considerat the initial stages of IP-HPLC method development.1. 7.1 C o l u m n In f l u e n c e o n Ch r o m at o g r a p h yThe delivery of therapeutic oligonucleotides to their desired target is an enormous challenge beingaddressed in a number of different ways. Increasing the lipophilicity of highly negatively chargedoligonucleotides to pass through densely hydrophobic cell membranes, thereby improving their pharmacokineticproperties can be accomplished by attachment of a lipophilic group to either terminusK11050_C001.indd 1711/15/2010 6:28:57 PM
18 Handbook of Analysis of Oligonucleotides and Related Products0.350.300.250.200.150.100.050.00−0.05AU6.50 7.00 7.50 8.00 8.50 9.00 9.50 10.00 10.50 11.00 11.50MinutesFIGURE 1.12 Separation of a crude RNA 39-mer using XTerra C18, 2.5 µm, 4.6 mm × 50 mm. Mobile phaseA: 100 mM HFIP, 7 mM TEA; mobile phase B: methanol.of the oligonucleotide to form a so-called conjugate. The following example highlights the markeddifference in chromatography of a 40-mer RNA/2′-O-methyl/2′-fluoro RNA oligonucleotide bearinga cholesterol group at the 5′-terminus compared to the 39-mer prior to conjugation. Increasedlipophilicity associated with the cholesterol moiety caused the oligonucleotide to be highly retainedon a C18 stationary phase, resulting in extremely poor separation. Lipophilic conjugates particularlyin combination with longer sequences often show largely increased retention on RP columnsmandating the use of shorter carbon chain stationary phases, such as C4, C8, or C12 columns. C18columns, however, are better suited to separate a broad range of oligonucleotides prior to the conjugationstep. Shown in Figures 1.12 and 1.13 is a comparison of the chromatography of a 39-merRNA oligonucleotide before and after conjugation with cholesterol.Note the improved peak shape and resolution of the impurities and full length product (FLP)in the separation using the XTerra C18 column (Figure 1.12) compared to the ACE-3 C4 column(Figure 1.13), indicating the superiority of the C18 column for the separation of the unconjugated39-mer oligonucleotide. After the conjugation step, however, the C4 column is much better suitedfor the HPLC analysis of the conjugated oligonucleotide when compared to the C18 column (seeFigure 1.14).Figure 1.14 exemplifies the difficulties encountered when analyzing conjugated oligonucleotides.Failure sequences are not well resolved from the main peak and peak broadening occurs. The chromatographyof the conjugate using the C4 column shows a much improved separation. The impuritypeaks are well resolved from the main peak (see Figure 1.15).A C18 column is more effective in separating an unconjugated oligonucleotide in comparison toa C4 or C8 column. When selecting a C18 column, there are a wide variety of columns that can beAU0.300.250.200.150.100.050.00−0.056.50 7.00 7.50 8.00 8.50 9.00 9.50 10.00 10.50 11.00 11.50 12.00 12.50MinutesFIGURE 1.13 Separation of a crude RNA 39-mer using ACE-3 C4, 3.5 µm, 2.1 mm × 150 mm. Mobile phaseA: 200 mM HFIP, 8 mM TEA, 5% methanol; mobile phase B: 200 mM HFIP, 8 mM TEA, 90% methanol.K11050_C001.indd 1811/15/2010 6:28:58 PM
Purity Analysis and Impurities Determination 19AU0.400.350.300.250.200.150.100.050.000.00 2.00 4.00 6.00 8.00 10.00 12.00 14.00 16.00 18.00 20.00 22.00 24.00 26.00 28.00 30.00MinutesAU0.400.350.300.250.200.150.100.050.0012.00 12.50 13.00 13.50 14.00 14.50 15.00 15.50 16.00 16.50 17.00 17.50 18.00MinutesFIGURE 1.14 Separation of a crude RNA 40-mer cholesterol conjugate using XTerra C18, 2.5 µm, 4.6 mm ×50 mm. Mobile phase A: 100 mM HFIP, 7 mM TEA; mobile phase B: methanol.1.000.80AU0.600.400.200.000.00 5.00 10.00 15.00 20.00 25.00 30.00 35.00 40.00 45.00 50.00 55.00 60.00MinutesAU0.100.080.060.040.020.0024.00 24.50 25.00 25.50 26.00 26.50 27.00 27.50 28.00 28.50 29.00 29.50 30.00 30.50 31.00 31.50MinutesFIGURE 1.15 Separation of a crude RNA 40-mer cholesterol conjugate using ACE-3 C4, 3.5 µm, 2.1 mm ×150 mm. Mobile phase A: 200 mM HFIP, 8 mM TEA, 5% methanol; mobile phase B: 200 mM HFIP, 8 mMTEA, 90% methanol.K11050_C001.indd 1911/15/2010 6:28:59 PM
20 Handbook of Analysis of Oligonucleotides and Related Productschosen from (see Section 1.3). In addition to varying column dimensions and particle sizes, manycolumn manufacturers have introduced modifications to their sorbents that can result in an alteredseparation of the oligonucleotide of interest. The following examples will demonstrate how usingcolumns of varying dimensions and sorbent modifications for the analysis of a 2′-O-methyl phosphorothioateRNA 20-mer can produce drastically different results. In each example, the mobilephase and gradient were adjusted to optimize the separation of the failure sequences from the fulllength product. (Note: In order to verify impurity resolution, the reference sample used for thisinvestigation was spiked with approximately 3% of the (N–2), (N–1), and (N+1) failure sequencesto produce a second reference sample. By overlaying the chromatograms from the reference andspiked sample the quality of the separation was then verified.)The following chromatograms were generated using a Waters XTerra C18 2.5 µm, 4.6 mm ×50 mm column (100 mM HFIP, 7 mM TEA, ACN gradient). The N–3 impurity is only partiallyresolved from the main peak, while the N–2, N–1, and N+1 failure sequences fall under the mainpeak. Owing to this co-elution, the overall purity of the FLP cannot be accurately quantitated.The sorbent particle size and column dimensions of the Waters Xterra column are insufficient toachieve the theoretical plates needed for separating all impurities from the full length product (seeFigure 1.16).In an attempt to improve the resolution of the failure sequences, the Xterra column was replacedwith a Waters XBridge OST C18 2.5 µm, 2.1 mm × 50 mm column, which also had a reduced internaldiameter, while the buffer conditions (100 mM HFIP, 7mM TEA) were maintained. The changeof the column improved the overall chromatography of the sequence, now completely resolving theN–3 and partially resolving the N–2 and N+1 failure sequences (see Figure 1.17).While the Waters XBridge OST C18 2.5 µm, 2.1 mm × 50 mm improved the overall resolutionof this particular sequence when compared to the Waters Xterra C18 2.5 µm, 4.6 mm × 50 mm, thecalculated purity was still not completely accurate due to the partial resolution of the N–2 and N+1peaks and co-elution of the N–1 with the full length product.AU0.900.800.700.600.500.400.300.200.100.000.00 2.00 4.00 6.00 8.00 10.00 12.00 14.00 16.00 18.00 20.00 22.00 24.00 26.00 28.00 30.00 32.00 34.00 36.00 38.00 40.00MinutesAU0.0160.0140.0120.0100.0080.0060.0040.0020.000N–3N–2, N–1, FLP, N+1−0.00221.60 21.80 22.00 22.20 22.40 22.60 22.80 23.00 23.20 23.40 23.60 23.80 24.00 24.20 24.40 24.60 24.80 25.00 25.20 25.40 25.60 25.80 26.00 26.20 26.40 26.60 26.80 27.00 27.20MinutesFIGURE 1.16 <strong>Chromatography</strong> of a 2′-O-methyl phosphorothioate RNA 20-mer using a Waters Xterra C18column (with expansion). Mobile phase A: 400 mM HFIP, 15 mM TEA; mobile phase B: acetonitrile.K11050_C001.indd 2011/15/2010 6:28:59 PM
Purity Analysis and Impurities Determination 21AU1.000.900.800.700.600.500.400.300.200.100.000.00 2.00 4.00 6.00 8.00 10.00 12.00 14.00 16.00 18.00 20.00 22.00 24.00 26.00 28.00 30.00 32.00 34.00 36.00 38.00 40.00AU0.300.250.200.150.100.050.00N–3N–2FLP, N–1N+119.80 20.00 20.20 20.40 20.60 20.80 21.00 21.20 21.40 21.60 21.80 22.00 22.20 22.40 22.60 22.80 23.00 23.20 23.40 23.60 23.80 24.00 24.20 24.40 24.60 24.80MinutesFIGURE 1.17 <strong>Chromatography</strong> of a 2′-O-methyl phosphorothioate RNA 20-mer using a Waters XBridge OSTC18 column (with expansion). Mobile phase A: 100 mM HFIP, 7 mM TEA; mobile phase B: acetonitrile.In an attempt to continue the trend of increasing impurity resolution, the particle size of thesorbent was reduced resulting in an increase of theoretical plates (see Section 1.3). Unfortunately,when using columns of particle sizes less than 2.5 µm, the back pressure on the column tends toexceed the pressure capabilities of a standard HPLC instrument. Typically, when running a flow rateof approximately 0.3 mL/min on a 1.7 µm column, the back pressure is between 4000 and 5500 psi(pressure is dependent on the column temperature and mobile phase being used). A standard HPLCinstrument is not capable of handling back pressures of this intensity. Therefore, columns with particlesizes less than 2 µm need to be run on an ultra performance liquid chromatography instrument(UPLC), which is capable of handling back pressures up to 15,000 psi. The following chromatogramswere taken from an analysis using a Waters Acquity BEH C18 1.7 µm, 2.1 mm × 50 mm anda UPLC system (100 mM HFIP, 7 mM TEA) (see Figure 1.18).In this case, the N–1 and N+1 impurities are beginning to resolve from the main peak, thusallowing a more accurate calculation of the main peak purity. While not completely resolvedfrom the main peak, the resolution of N–1 and N+1 in this profile is again superior to the previousexample that used a column of increased particle size. These examples demonstrate how changingthe column type and reducing the internal diameter and particle size of a column can lead to amore efficient separation of the failure sequences from the full length product of a nonconjugatedoligonucleotide.In addition to comparing the effects of column dimensions and particle sizes on the analysisof a particular compound, it can also be useful to compare the performance of different columnmanufacturers and their various solid support modifications. The following examples demonstratethat while different column manufacturers can produce columns of identical dimension and particlesize, their resultant chromatography can be different enough to justify superiority between them.The following analyses were performed under optimized conditions, which lead to resolutionof N–1 and N+1 failures of a 20-mer 2′-O-methyl phosphorothioate RNA sequence. With theK11050_C001.indd 2111/15/2010 6:28:59 PM
22 Handbook of Analysis of Oligonucleotides and Related ProductsAU0.600.500.400.300.200.100.000.00 0.50 1.00 1.50 2.00 2.50 3.00 3.50 4.00 4.50 5.00 5.50 6.00 6.50 7.00 7.50 8.00 8.50 9.00 9.50 10.00Minutes0.0700.060FLP0.0500.040N–2, N–10.0300.0200.0100.000−0.0101.40 1.60 1.80 2.00 2.20 2.40 2.60 2.80N–33.00 3.20 3.40 3.60 3.80N+14.00 4.20 4.40 4.60 4.80 5.00 5.20MinutesAUFIGURE 1.18 <strong>Chromatography</strong> of a 2′-O-methyl phosphorothioate RNA 20-mer using a Waters Acquity BEHC18 column (with expansion). Mobile phase A: 400 mM HFIP, 15 mM TEA; mobile phase B: acetonitrile.separation of this particular sequence optimized, there was an opportunity to directly compare theperformance of different column manufacturers and modified solid supports. Under optimized conditions,we achieved sufficient separation (resolution > 1.0) of the N–1 and N+1 failure sequencesfrom the full length product using a Waters Acquity BEH C18 1.7 µm, 2.1 mm × 50 mm column andhexyl ammonium acetate as the ion-pairing agent. In order to investigate how other column manufacturerscompared to the Waters Acquity BEH C18 1.7 µm, 2.1 mm × 50 mm, we selected columnsof identical dimensions, and then analyzed the same sample using identical method conditions. Thefirst example compares the performance of a Phenomenex Kinetex C18 1.7 µm, 2.1 mm × 50 mmcolumn to the Waters Acquity BEH C18 1.7 µm, 2.1 mm × 50 mm (see Figure 1.19).Under these conditions the Waters Acquity column gives a FLP retention time of about 3.50min, while the Phenomenex Kinetex column shows a FLP retention time of about 2.80 min. In thiscase, the dimensions and particle sizes of both columns are identical; however, each uses a differentparticle design that has the potential to lead to different chromatography (see Section 1.3). Afterperforming the analyses, it was concluded that neither column provides a significant advantageover the other in terms of overall separation of the impurity profile. In both cases, N–1 and N+1resolution is evident, and the overall impurity profile is similar. The only noticeable difference inperformance is the resulting retention times of the FLP for each column. The Phenomenex Kinetexproduces an FLP retention time of 2.80 min, while the Waters Acquity produces an FLP retentiontime of 3.43 min. While the difference in retention time is only 0.63 min, the ability of the WatersAcquity to retain the sequence for a slightly longer period under these conditions results in a slightlyimproved resolution of the N–1 failure sequence when compared to the Phenomenex Kinetex. Forthe Phenomenex Kinetex, the resolution of N–1 is 1.05. For the Waters Acquity, the resolution ofN–1 is 1.29. While this difference in resolution isn’t profound, it can prove important when analyzingrather pure oligonucleotides that can produce N–1 levels less than 1.0%.The previous example compared the chromatography of two columns (Waters Acquity andPhenomenex Kinetex) that had the same dimensions and particle size. These columns also operatedK11050_C001.indd 2211/15/2010 6:29:00 PM
Purity Analysis and Impurities Determination 23AU0.350.300.250.200.150.100.050.00Phenomenex kinetexWaters acquity0.50 1.00 1.50 2.00 2.50 3.00 3.50 4.00 4.50 5.00 5.50 6.00 6.50 7.00 7.50 8.00 8.50 9.00 9.50 10.00Minutes0.0240.022N–1; R = 1.290.020N–1; R = 1.050.0180.0160.0140.0120.0100.0080.0060.0040.0020.000−0.002−0.0042.00 2.20 2.40 2.60 2.80 3.00 3.20 3.40 3.60 3.80 4.00 4.20 4.40MinutesAUFIGURE 1.19 <strong>Chromatography</strong> of a 2′-O-methyl phosphorothioate RNA 20-mer using Waters Acquity andPhenomnex Kinetex C18 columns. Mobile phase A: 15 mM HAA, 7.0% methanol, 3.0% acetonitrile; mobilephase B: 70% methanol, 30% acetonitrile.under the same mechanism, that being a hydrophobic interaction between the oligonucleotide ofinterest and the C18 chain attached to the solid support. The C18 column is currently the preferredphase for chromatographic oligonucleotide analysis; however, various column manufacturers areexploring other phase options that might be the next preferred method in oligonucleotide analysis.One such alternative that is currently being explored is a pentafluorophenyl (PFP) phase, which, similarto the C18 column, interacts via hydrophobic interactions (for details, see Section 1.4). In orderto compare how the PFP phase performs in comparison to a C18 phase, the same sequence from theexample in Figure 1.19 was run under identical conditions using a Phenomenex Kinetex PFP 1.7 µm,2.1 mm × 50 mm instead of the Kinetex C18 1.7 µm, 2.1 mm × 50 mm (see Figure 1.20).On the basis of the overlaid chromatograms of these two analyses (at full scale), the same dimensionsand particle sizes of these two columns leads to a nearly identical retention of the oligonucleotideof interest. However, when zooming in on the region of the full length product, it’s obvious thatthere are substantial differences in the interactions of these two phases with this oligonucleotide.Under these conditions, the N–2, N–1, and N+1 failures are well resolved when using the C18 phase.In contrast, when using the column with the PFP phase, the N–2 and N–1 failure sequences co-eluteand are not well resolved from the full length product, and the N+1 failure elutes as a shoulder offof the back side of the main peak. In addition to failing to completely resolve the N–1 from themain peak, the failure sequences are not well resolved when using the PFP phase. This can provedetrimental when analyzing samples of low concentrations because the broadening of the impurityprofile can cause low level impurities to be lost in the baseline noise, thus leading to an inaccuratedepiction of the entire profile of the sample. When analyzing this 2′-O-methyl phosphorothioateRNA 20-mer sequence, it is obvious that the PFP column does not resolve the impurity profile aswell as the C18 phase, in spite of their similar selection mechanism.K11050_C001.indd 2311/15/2010 6:29:00 PM
24 Handbook of Analysis of Oligonucleotides and Related ProductsAU0.350.300.250.200.150.100.050.00−0.050.00 0.50 1.00 1.50 2.00 2.50 3.00 3.50 4.00 4.50 5.00 5.50 6.00 6.50 7.00 7.50 8.00 8.50 9.00 9.50 10.00Minutes0.020N–2PFP0.0180.016C180.014N–10.0120.0100.0080.0060.004N+10.0020.000−0.0020.60 0.80 1.00 1.20 1.40 1.60 1.80 2.00 2.20 2.40 2.60 2.80 3.00 3.20 3.40 3.60 3.80 4.00 4.20 4.40MinutesAUFIGURE 1.20 <strong>Chromatography</strong> of a 2′-O-methyl phosphorothioate RNA 20-mer using a Phenomenex KinetexC18 and a Phenomenex Kinetex PFP column of identical dimensions (1.7 µm, 2.1 mm × 50 mm). Mobile phaseA: 15 mM HAA, 7.0% methanol, 3.0% acetonitrile; mobile phase B: 70% methanol, 30% acetonitrile.1.7.2 Mo b il e Ph a s e In f l u e n c e o n Ch r o m at o g r a p h yAs described in the theoretical portion of this chapter, selection of mobile phase, specifically selectionof the ion-pairing agent, is just as influential as the selection of the analytical column when analyzingthe oligonucleotide of interest. In our experience, the ion-pairing agents of HFIP/TEA andHAA have predominately been the most effective in separating oligonucleotides. In the previoussection of this chapter (Section 1.7.1), there was a sequential demonstration of improved impurityresolution on a particular 2′-O-methyl phosphorothioate RNA sequence (see Figures 1.16, 1.17, and1.18). In spite of this increasing trend of impurity profile resolution in these examples, the N–1 andN+1 failure sequences were still not fully resolved from the main peak, leaving an uncertainty inthe overall purity calculation. In an attempt to further separate the compound of interest from thefailures without increasing the theoretical plates, the ion-pairing agents used in the mobile phaseswere changed from HFIP/TEA (100 mM HFIP, 7 mM TEA) to hexylammonium acetate (15 mMHAA). The conditions were optimized leading to the following example (see Figure 1.21).Now the N–1 and N+1 impurities are fully resolved from the main peak, leaving little uncertaintyin the purity of the main peak. In this instance, changing the ion-pairing agent in the mobilephase was the key for the complete resolution of the N–1 and N+1 impurities from the full lengthproduct. While changing the ion-pairing agent from HFIP/TEA to HAA resulted into a completeresolution of the failure sequences of this particular sequence, it should be noted that HAA is not abetter ion-pairing reagent than HFIP/TEA for the analysis of oligonucleotides per se. This examplesimply demonstrates how ion-pairing agents can have different selectivities with oligonucleotides,thus producing different chromatographic separations.When selecting ion-pairing agents for chromatographic analyses, one must not only evaluate itsability to separate a sequence. If there is an interest in using MS to delineate structural information,in addition to its chromatographic capabilities, one must also consider the compatibility of theK11050_C001.indd 2411/15/2010 6:29:00 PM
Purity Analysis and Impurities Determination 25AU0.220.200.180.160.140.120.100.080.060.040.020.00−0.02−0.040.00 0.50 1.00 1.50 2.00 2.50 3.00 3.50 4.00 4.50 5.00 5.50 6.00 6.50 7.00 7.50 8.00 8.50 9.00 9.50 10.00MinutesAU0.0250.0200.0150.010N–2 N–1FLPN+10.0050.000−0.0050.60 0.80 1.00 1.20 1.40 1.60 1.80 2.00 2.20 2.40 2.60 2.80 3.00 3.20Minutes3.40 3.60 3.80 4.00 4.20 4.40 4.60 4.80 5.00 5.20 5.40FIGURE 1.21 <strong>Chromatography</strong> of a 2′-O-methyl phosphorothioate RNA 20-mer using a Waters AcquityBEH UPLC C18 column. Mobile phase A: 15 mM HAA, 7.0% methanol, 3.0% acetonitrile; mobile phase B:70% methanol, 30% acetonitrile.selected mobile phase with mass spectrometry. Mass spectrometry plays an important role in theprocess development of an oligonucleotide owing to its ability to identify any impurities or failuresequences that are produced during a synthetic process. When coupled with HPLC (or UPLC), massspectrometry allows the analyst to directly correlate a chromatographic peak with its atomic mass,thus allowing quantitation and identification of impurities in a sample’s profile. Selection of theion-pairing agent is important when using mass spectrometry. Ion-pairing agents suppress or helpionization of the analyte to different extends resulting into different intensities of the mass signalin the mass spectrometer. In the previous example (see Figure 1.21), when hexylammonium acetatewas used, it led to a complete resolution of all impurities for this RNA sequence. However, when thismethod was transferred to LC/MS, mass identification of low-level impurities was greatly diminishedowing to this suppression at the typical column loads of 10 pmol/μL. However, when analyzingthe same sequence using an HFIP/TEA buffer system, all low-level impurities were easily detectable.The phenomenon of ion suppression needs to be taken into consideration when selecting an analyticalHPLC method and is discussed in greater detail in the mass spectrometry chapter (see Chapter4). While a particular ion-pairing agent may lead to improved resolution of an oligonucleotide’s UVprofile, it may decrease the resolution of mass signal in the total ion count (TIC), thus preventing theanalyst from learning valuable information about his or her sample and synthetic process.1.7.3 HPLC v e r s u s UPLCAs a result of the continual evolution of therapeutic oligonucleotides in the pharmaceutical industry,demands for the production and impurity characterization of oligonucleotides continues to increase.While the typical HPLC system is capable of adequately analyzing a majority of oligonucleotides,K11050_C001.indd 2511/15/2010 6:29:01 PM
26 Handbook of Analysis of Oligonucleotides and Related Productsthe complexity of highly modified oligonucleotides has stretched the capabilities of high-pressureliquid chromatography, and in some cases, prevented complete impurity characterization. As discussedin Section 1.7.1, decreasing the particle size of columns to sub 2 µm typically leads to anincreased resolution of the impurity profiles of oligonucleotides. However, most HPLC instrumentsare incapable of handling the high back pressures produced when using columns with particles ofthis size. In response to such needs, instrument manufacturers introduced ultra high-pressure liquidchromatography (UPLC) systems that are capable of handling such back pressures (see Section 1.3for details).Ultra high-pressure liquid chromatography systems have a number of advantages when comparedto standard HPLC systems. The first, and likely most important, advantage is its ability toincrease the resolution of the oligonucleotide profile. An example of such a case can be seen inFigures 1.18 and 1.21 above. As an oligonucleotide successfully travels through clinical trials, thedemand for impurity characterization increases. In many cases, the complexity of the sequenceand the similarity of the impurities in comparison to the FLP do not permit a standard HPLC fromadequately separating the impurity profile. Because of this, the UPLC system appears to be the mosteffective instrument in chromatographic separation of oligonucleotides.In addition to improving the overall resolution of an oligonucleotide’s impurity profile, the UPLCsystem is capable of analyzing samples in a fraction of the time that HPLCs require. The followingexamples depict the analysis of a 2′-O-methyl phosphorothioate RNA 20-mer sequence that wasoptimized using both HPLC and UPLC.Figures 1.22 and 1.23 depict two analyses of the same 20-mer oligonucleotide sample usingoptimized HPLC and UPLC methods. As shown above, the HPLC analysis requires a run time of20 min, while the UPLC analysis requires only 6 min. In spite of the reduced run time of the UPLC0.600.500.40AU0.300.200.100.000.00 1.00 2.00 3.00 4.00 5.00 6.007.00 8.00 9.00 10.00 11.00Minutes12.00 13.00 14.00 15.00 16.00 17.00 18.00 19.00 20.00AU0.0350.0300.0250.0200.0150.0100.005N–2N–1N+10.000−0.0058.50 9.00 9.50 10.00 10.50 11.00 11.50 12.00Minutes12.50 13.00 13.50 14.00 14.50 15.00FIGURE 1.22 HPLC analysis of a 2′-O-methyl phosphorothioate RNA 20-mer (three percent impurity spikeof N–2, N–1, and N + 1 overlayed with reference to demonstrate failure sequence resolution). Mobile phase A:15 mM HAA, 7.0% methanol, 3.0% acetonitrile; mobile phase B: 70% methanol, 30% acetonitrile; column:Waters Acquity UPLC system with a Waters Acquity BEH UPLC C18 1.7 µm, 2.1 mm × 50 mm (dotted line3% spike of N–2, N–1, and N+1).K11050_C001.indd 2611/15/2010 6:29:01 PM
Purity Analysis and Impurities Determination 27AU0.800.600.400.200.000.00 0.20 0.40 0.60 0.80 1.00 1.20 1.40 1.60 1.80 2.00 2.20 2.40 2.60 2.80 3.00 3.20 3.40 3.60 3.80 4.00 4.20 4.40 4.60 4.80 5.00 5.20 5.40 5.60 5.80 6.00MinutesFIGURE 1.23 UPLC analysis of a 2′-O-methyl phosphorothioate RNA 20-mer. Mobile phase A: 15 mMHAA, 7.0% methanol, 3.0% acetonitrile; mobile phase B: 70% methanol, 30% acetonitrile; column: WatersAcquity UPLC system with a Waters Acquity BEH UPLC C18 1.7 µm, 2.1 mm × 50 mm.method, impurity resolution of the N–1 and N+1 failure sequences is maintained. The reduced runtimes of the UPLC system can prove invaluable when analyzing in process samples that requireshort turnaround times such as deprotection and stability indicating samples. In addition, at timesof high sample volumes, such as during fraction analysis following purification, a fast analyticalmethod is of great importance to increase turnaround time. A UPLC’s ability to reduce run timesto as little as 10% of a typical HPLC method improves the overall efficiency of both synthesis andanalytical laboratories.In addition to the previous two advantages that UPLC analyses have over HPLC analyses, athird advantage is the flow rate of typical UPLC methods. A majority of the UPLC methods usedto analyze oligonucleotides run in the range of 0.2–0.4 mL/min. When compared to reversed-phaseHPLC methods that typically run at a range of 0.5–0.75 mL/min, mobile phase consumption canbe reduced to approximately 25% when using UPLC. This flow rate reduction not only reduces theamount of ion-pairing agent and solvent that needs to be purchased, but it also reduces the amountof waste that is produced.1.7.4 Te m p e r at u r e In f l u e n c e s o f Ch r o m at o g r a p h yThe retention of oligonucleotides is often greatly affected by temperature. It has been suggestedthat column temperature will dictate the extent to which the ion-pairing reagent is adsorbed to thestationary phase and thus will impact the electrostatic interaction of the oligonucleotide with itssurface. 62 Additionally, increasing the temperature is expected to impact the peak shape. As wasdiscussed in Section 1.3, increasing the temperature will typically improve mass transfer properties.The example shown in Figure 1.24 demonstrates the impact of temperature on the retention timeand peak shape of a 16-mer phosphorothioate LNA (locked nucleic acid)/DNA mixed sequence.Buffers were composed of 100 mM HFIP spiked with 7 mM triethylamine in water (mobile phaseA) and methanol (mobile phase B). The retention time was shifted by as much as 27% on increasingthe column temperature from 30° to 60°C.Shown in Figure 1.24 is an overlay of four separations carried out on a 16-mer mixed LNA/DNAsequence at four column temperatures using an XTerra MS-C18 column (2.5 µm, 4.6 mm × 50 mm).The temperature also had a pronounced effect on the peak shape, as seen in the expansions below.The sharpness of the peak correlates with an increase in column temperature.Another phenomenon related to peak shape was uncovered on further expansion of the spectra(see Figure 1.25): splitting of the main peak into leading and tailing shoulders. At low temperature,e.g., 30°C, a shoulder appears at the early retention time relative to the apex. At high temperature(60°C), the shoulder appears at longer retention time compared to the center of the peak. This shoulderingeffect, when pronounced, presents an obstacle to consistent integration of the full lengthK11050_C001.indd 2711/15/2010 6:29:01 PM
28 Handbook of Analysis of Oligonucleotides and Related Products0.160.1460˚C50˚CAU0.120.100.080.060.040.020.0040˚C30˚C0.00 2.00 4.00 6.00 8.00 10.00 12.00 14.00 16.00 18.00 20.00 22.00 24.00 26.00 28.00 30.00Minutes0.160.1460˚C50˚C0.1240˚CAU0.100.0830˚C0.060.040.020.0015.50 16.00 16.50 17.00 17.50 18.00 18.50 19.00 19.50 20.00 20.50 21.00 21.50 22.00 22.50 23.00 23.50MinutesFIGURE 1.24 Overlay of a series of separations of a 16-mer LNA-DNA on an XTerra column at varioustemperatures. Mobile phase A: 100 mM HFIP spiked with 7 mM triethylamine in water; mobile phase B:100% methanol; column: Waters XTerra MS-C18, 2.5 µm, 4.6 mm × 50 mm.product. We chose to carry out separation at 40°C, a temperature that displayed minimal peaksplitting.1.7.5 Sa m p l e Pr e pa r at io n1.7.5.1 Salt EffectsThe presence of salts may greatly influence the quality of oligonucleotide separation. Generally,samples containing high salt concentration are encountered when analyzing crude RNA, whichtypically contains a high amount of fluoride salts and anion-exchange purification fractions containinghigh concentrations of salt buffer. A different problem represents crude samples of DNAor 2′-modified RNA in concentrated aqueous ammonia. Here the high pH of the sample mightinfluence the analysis. <strong>High</strong>-salt and high-pH levels interfere with the ability of oligonucleotides toparticipate in ion pairing and often results in change in retention time, peak splitting, or augmentedinjection peaks. Several techniques are known to curb these effects, including sample desalting,K11050_C001.indd 2811/15/2010 6:29:01 PM
Purity Analysis and Impurities Determination 29AU0.0900.0800.0700.0600.0500.0400.0300.0200.0100.000AU0.120.100.080.060.040.0230˚C21.00 21.20 21.40 21.60 21.80 22.00 22.20 22.40Minutes40˚C22.60 22.80 23.00 23.20 23.40 23.60AUAU0.000.160.140.120.100.080.060.040.020.000.160.140.120.100.080.060.040.020.0018.90 19.00 19.10 19.20 19.30 19.40 19.50 19.60 19.70 19.80 19.90 20.00 20.10 20.20 20.30 20.40 20.50 20.60 20.70 20.80 20.90 21.00 21.10 21.20 21.30 21.40Minutes50˚C16.60 16.80 17.00 17.20 17.40 17.60 17.80 18.00 18.20 18.40 18.60 18.80 19.00 19.20 19.40 19.60Minutes60˚C15.10 15.20 15.30 15.40 15.50 15.60 15.70 15.80 15.90 16.00 16.10 16.20 16.30 16.40 16.50 16.60 16.70 16.80 16.90 17.00 17.10 17.20 17.30 17.40 17.50MinutesFIGURE 1.25 Peak shape and shouldering at various temperatures of a 16-mer LNA-DNA oligonucleotide.Mobile phase A: 100 mM HFIP spiked with 7 mM triethylamine in water; mobile phase B: 100% methanol;column: Waters XTerra MS-C18, 2.5 µm, 4.6 mm × 50 mm.K11050_C001.indd 2911/15/2010 6:29:02 PM
32 Handbook of Analysis of Oligonucleotides and Related ProductsAU0.400.350.300.250.200.150.100.050.000.00 0.50 1.00 1.50 2.00 2.50 3.00 3.50 4.00 4.50 5.00 5.50 6.00 6.50 7.00 7.50 8.00 8.50 9.00 9.50 10.00 10.50 11.00 11.50 12.00MinutesFIGURE 1.30 Dilution of the high salt sample to 0.1 M TEAA permits analysis of the 24-mer phosphorothioateDNA sample. Mobile phase A: 100 mM HFIP/0.1% TEA in water; mobile phase B: 70% MeOH/30%ACN; column: Waters Acquity UPLC system with an Acquity BEH UPLC C18 column 1.7 µm, 2.1 mm × 50mm 55°C; sample prepared in 0.1 M TEAA.the major peak by area integration. The 24-mer phosphorothioate DNA product shown in Figure1.29 was diluted to 0.1 M TEAA and reanalyzed to give the spectrum shown in Figure 1.30. Again,the resolution of the main peak from the major impurity is dramatically improved.Figure 1.31 depicts the chromatography of a 20-mer 2′-O-methyl phosphorothioate RNA whosesample was prepared in water. The sample is representative of a selected pool of purification fractionsfrom AEX purification and therefore containing high salt concentration. The chromatographywas carried out on UPLC, Waters Acquity column, 1.7 µm, 2.1 mm × 50 mm (45–55% mobilephase B over 8 min) at 60°C. Mobile phase A was composed of 15 mM HAA in water, and mobilephase B consisted of methanol in acetonitrile.The typical broadening of the main peak and characteristic injection peak was attributed to highsalt content of the pooled purification fractions. The importance of matching the ion-pairing reagentused for dilution with the ion-pairing reagent in the mobile phase was demonstrated by diluting thesample to 0.01 M in TEAA and analyzing the sample with the HAA method described above. Theresulting chromatogram is displayed in Figure 1.32.The spectrum, shown in detail in the lower chromatogram of Figure 1.32, still shows significantpeak splitting as well as an attendant injection peak. It is thought that the triethylammonium cationbinds strongly to the oligonucleotide and does not allow for effective exchange between the TEAA(used for sample preparation) and HAA used for elution. The split peak can be understood in termsof a sample mixture consisting of TEAA and HAA bound to the oligonucleotide; each having a1.201.000.80AU0.600.400.200.000.00 0.50 1.00 1.50 2.00 2.50 3.00 3.50 4.00 4.505.00 5.50 6.00 6.50 7.00 7.50 8.00 8.50 9.00 9.50 10.00MinutesFIGURE 1.31 IP-UPLC chromatography of a 20-mer 2′-O-methyl phosphorothioate RNA from AEX purificationdiluted in water. Mobile phase A: 15 mM HAA in water; mobile phase B: MeOH/ACN; column: WatersAcquity UPLC system with an Acquity BEH UPLC C18 column 1.7 µm, 2.1 mm × 50 mm 60°C.K11050_C001.indd 3211/15/2010 6:29:03 PM
Purity Analysis and Impurities Determination 33AU1.401.201.000.800.600.400.200.000.00 0.50 1.00 1.50 2.00 2.50 3.00 3.50 4.00 4.505.00 5.50 6.00 6.50 7.00 7.50 8.00 8.50 9.00 9.50 10.00MinutesAU0.0600.0500.0400.0300.0200.0100.0002.40 2.50 2.60 2.70 2.80 2.90 3.00 3.10 3.20 3.30 3.40 3.50 3.60 3.70 3.80 3.90 4.00 4.10 4.20MinutesFIGURE 1.32 IP-UPLC chromatography of a 20-mer 2′-O-methyl phosphorothioate RNA from AEX purification;the sample was diluted to 0.01 M TEAA (with expansion). Mobile phase A: 15 mM HAA in water;mobile phase B: MeOH/ACN; column: Waters Acquity UPLC system with an Acquity BEH UPLC C18 column1.7 µm, 2.1 mm × 50 mm 60°C; gradient: 45–55% mobile phase B over 8 min; sample prepared in 0.1 MTEAA; lower panel details expansion of main peak.unique retention time. The remaining injection peak is due to the concentration of triethylammoniumcation in the sample not being sufficient to completely replace the sodium cation, which is ingreat excess from the purification buffer.The chromatography of a sample displaying a problematic injection peak can also often beimproved by lowering the organic content of the mobile phase used in the column equilibrationand at the start of the separation. The example of the 20-mer 2′-O-methyl phosphorothioate RNAaptly demonstrates the effect of modified starting organic concentration. Figure 1.33 shows theAU0.300.250.200.150.100.050.000.00 1.00 2.00 3.00 4.00 5.00 6.00 7.00 8.00 9.00 10.00 11.00 12.00 13.00 14.00 15.00 16.00MinutesFIGURE 1.33 Improved chromatography of the 20-mer 2′-O-methyl phosphorothioate RNA from AEXpurification by modification of the gradient and eluent composition. Mobile phase A: 15 mM HAA in water;mobile phase B: MeOH/ACN; column: Waters Acquity UPLC system with an Acquity BEH UPLC C18 column1.7 µm, 2.1 mm × 50 mm 60°C; gradient: 0–55% mobile phase B over 14 min.K11050_C001.indd 3311/15/2010 6:29:03 PM
40 Handbook of Analysis of Oligonucleotides and Related Products0.80Duplex, 11.8 min0.700.60AU0.500.400.30Titrationendpoint (7)Antisense, 7.5 minSense, 9.3 min0.200.101 3 5 7 90.000.00 1.00 2.00 3.00 4.00 5.00 6.00 7.00 8.00Minutes9.00 10.00 11.00 12.00 13.00 14.00 15.00 16.00FIGURE 1.41 Overlay of a series of titrations of a 21-mer siRNA showing: (1) excess antisense strand: 7.5min RT; (2) excess sense strand: 9.3 min RT; (3) duplex: 11.8 min RT. Overlay of six titrations analyzed by nondenaturingIP-HPLC. The endpoint of the titration, represented by Titration 4, indicates a slight (~0.5–1.0%)excess of antisense strand. Mobile phase A: 100 mM HFIP/16 mM TEAA in water/methanol 99:1; mobilephase B: 100 mM HFIP/16 mM TEAA in water/methanol 5:95; Waters Acquity UPLC system with a WatersXBridge OST C18, 2.5 µm, 2.1 mm × 50 mm; 23°C.AU0.140.120.100.080.060.040.02SenseRT = 10.22 minArea = 49.68%AntisenseRT = 14.24 minArea = 50.32%0.000.00 1.00 2.00 3.00 4.00 5.00 6.00 7.00 8.00 9.00 10.00 11.00 12.00 13.00 14.00 15.00 16.00 17.00 18.00 19.00 20.00 21.00 22.00 23.00 24.00 25.00MinutesFIGURE 1.42 Denaturing IP-HPLC of the duplex (titration endpoint) from Figure 1.41. A representativeseparation of the duplex into its complimentary strands by means of a nondenaturing method. In this case, thenondenaturing method is carried out on a Waters XBridge OST C18 column at 75ºC using 100 mM HFIP/7mM TEA in 1% MeOH and 100 mM HFIP/7 mM TEA in 95% MeOH as mobile phase A and B, respectively.The buffer composition is identical to that used for the nondenaturing conditions. The chief difference in themethod is the execution of a shallower gradient at significantly higher (75°C) temperature. Area percentages ofboth main peaks were set to 100% and are not adjusted for extinction coefficients. Results from the denaturingmethod show antisense strand in slight excess, which is in agreement with results found from the nondenaturingmethod depicted in Figure 1.41.K11050_C001.indd 4011/15/2010 6:29:06 PM
Purity Analysis and Impurities Determination 41TABLE 1.4Summary of Microtitration Data for a siRNA DuplexSampleOD TitrationRatio Sense/Antisense aExcess in Senseby OD, %Nondenaturing IP-HPLCDenaturing IP-HPLCDuplex % SS excess % Sense % AS % SS ExcessSense strand NA 100 NA 94.08 91.26 0 NAAS strand NA 0 NA 95.77 0 91.66 NATitration 1 1.00/0.85(1.00/0.89)Titration 2 1.00/0.90(1.00/0.94)Titration 3 1.00/0.95(1.00/0.99)Titration 4 1.00/1.00(1.00/1.05)Titration 5 1.00/1.05(1.00/1.10)Titration 6 1.00/1.10(1.00/1.15)Titration 7 1.00/1.15(1.00/1.20)Titration 8 1.00/1.20(1.00/1.26)Titration 9 1.00/1.25(1.00/1.31)15(12)10(6)5(0)0(–4)–5(–9)–10(–13)–15(–17)–20(–26)–25(–31)84.53 15.47 (S) 56.97 43.03 13.94 (S)87.18 12.82 (S) 55.92 44.08 11.84 (S)91.15 8.85 (S) 54.39 45.61 8.78 (S)93.15 6.85 (S) 53.51 46.49 7.02 (S)97.46 2.54 (S) 51.65 48.35 3.30 (S)98.63 1.37 (S) 51.12 48.88 2.24 (S)98.84 1.16 (AS) 49.68 50.32 0.64 (AS)95.97 4.03 (AS) 48.45 51.55 3.10 (AS)92.30 7.70 (AS) 46.92 53.08 6.16 (AS)Note: Bold-faced data (Titration 7) represents the empirically-derived titration endpoint.aItalicized OD ratios in parentheses reflect calculated differences in extinction coefficient of each strand based on the nearestneighbor model: sense = 201,700 L/mol cm; antisense = 192,700 L/mol cm.It is also noteworthy to mention that the methods are not sensitive enough to track the 5% incrementalincreases in amount of antisense strand as prepared during microtitration. The methods do,however, allow one to see the antisense peak begin to grow as the sense peak disappears, and it is atthis point that the endpoint of the titration is reached.The point at which the antisense strand is first seen in excess is generally interpreted as theendpoint of the titration because a slight excess of antisense strand can be tolerated because no offtargeteffects are expected in contrast to a potential excess of sense strand. In this case, the empiricallyderived OD ratio of sense to antisense 1.00 to 1.15 (or adjusted for extinction coefficient 1.00 to1.20) appears to be the ideal titration ratio (see Table 1.4). The denaturing HPLC supports the valuesderived from nondenaturing HPLC (see Figure 1.42).1.8 SummaryThe increasing significance of oligonucleotides as therapeutics demands a high level of qualitycontrol, including accurate purity determination and identification of the related process impurities.The iterative nature of oligonucleotide synthesis inevitably leads to the generation of low-leveloligonucleotide by-products such as failure sequences, N+1 impurities, PO impurities (for phosphorothioates),and others. Because of its generality and robustness, IP-HPLC has proven the mostimportant technique for analysis of oligonucleotides, whether they belong to siRNA, phosphorothioateDNA, aptamers, LNA gapmers, or other subclasses.K11050_C001.indd 4111/15/2010 6:29:06 PM
42 Handbook of Analysis of Oligonucleotides and Related ProductsCGE, AEX, and IP-HPLC are the most widely used analytical tools for the separation of impuritiesfrom the full length oligonucleotide. In contrast to AEX-HPLC and CGE we have been witnessingtremendous improvements of resolution in IP-HPLC over the past two decades by movingto smaller particle size sorbents. Also, IP-HPLC tends to be the most robust method of the threein terms of sample concentration, buffer, and instrument requirements. An additional advantage ofIP-HPLC is that it can be directly coupled to an ESI-MS instrument, thereby making it feasible toidentify each individual peak, which is not easily possible with CGE or AEX-HPLC.As with any technique, there are many variables affecting the outcome of the separation and thecritical parameters and attendant theory are discussed briefly in the introductory section. Drawingfrom our broad experience in manufacturing and analyzing a host of oligonucleotide subclasses, wepresent a selection of valuable examples for the practitioner in the experimental section. Thoughcertainly not comprehensive, Section 1.7 provides guidance in column selection, separation of themain peak from its most commonly observed impurities, techniques to curb salt influences, analysisof oligonucleotide small-molecule conjugates, and others.AcknowledgmentsWe thank Ananya Dubey, Sean McCarthy, and Martin Gilar from Waters Corporation for giving usaccess to RP-HPLC relevant journal articles and application notes including figures.References1. Cunliffe, J. M., and T. D. Maloney. 2007. Fused-core particle technology as an alternative to sub-2- micromparticles to achieve high separation efficiency with low backpressure. Journal of Separation Science 30:3104–3109.2. Destefano, J. J., T. J. Langlois, and J. J. Kirkland. 2008. Characteristics of superficially-porous silicaparticles for fast HPLC: some performance comparisons with sub-2-microm particles. Journal ofChromatographic Science 46: 254–260.3. Kirkland, J. J. 2000. Ultrafast reversed-phase high-performance liquid chromatographic separations: anoverview. Journal of Chromatographic Science 38: 535–544.4. Kirkland, J. J., F. A. Truszkowski, and R. D. Ricker. 2002. Atypical silica-based column packings forhigh-performance liquid chromatography. J. <strong>Chromatography</strong> A 965: 25–34.5. Svec, F. 2008. What is “hot” in column technologies for liquid chromatography. American Laboratory40: 13–17.6. Majors, R. E. 2006. Fast and ultrafast HPLC on sub-2 um porous particles—where do we go from here?LC-GC Europe 19: 352–362.7. Kirkland, J. J. 2004. Development of some stationary phases for reversed-phase high-performance liquidchromatography. Journal of <strong>Chromatography</strong> A 1060: 9–21.8. O’Gara, J. E., B. A. Alden, T. H. Walter, J. S. Peterson, C. L. Niederländer, and U. D. Neue. 1995. Simplepreparation of a CS HPLC stationary phase with an internal polar functional group. Analytical Chemistry67: 3809–3814.9. O’Gara, J. E., and K. D. Wyndham. 2006. Porous hybrid organic-inorganic particles in reversed-phaseliquid chromatography. Journal of <strong>Liquid</strong> <strong>Chromatography</strong> and Related Technologies 29: 1025–1045.10. Kirkland, J. J., F. A. Truszkowski, C. H. Dilks, Jr., and G. S. Engel. 2000. Superficially porous silicamicrospheres for fast high-performance liquid chromatography of macromolecules. Journal of<strong>Chromatography</strong> A 890: 3–13.11. Abrahim, A., M. Al-Sayah, P. Skrdla, Y. Bereznitski, Y. Chen, and N. Wu. 2010. Practical comparison of2.7 microm fused-core silica particles and porous sub-2 microm particles for fast separations in pharmaceuticalprocess development. Journal of Pharmaceutical and Biomedical Analysis 51: 131–137.12. Gilar, M., K. J. Fountain, Y. Budman, et al. 2002. Ion-pair reversed-phase high-performance liquidchromatography analysis of oligonucleotides: retention prediction. Journal of <strong>Chromatography</strong> A 958:167–182.13. Van Deemter, J. J., F. J. Zuiderweg, and A. Klinkenberg. 1956. Longitudinal diffusion and resistance tomass transfer as causes of nonideality in chromatography. Chemical Engineering Science 5: 271–290.K11050_C001.indd 4211/15/2010 6:29:06 PM
Purity Analysis and Impurities Determination 4314. Arghavani, M. B., and L. J. Romano. 1995. A method for the purification of oligonucleotides containingstrong intra- or intermolecular interactions by reversed-phase high-performance liquid chromatography.Analytical Biochemistry 231: 201–209.15. Germann, M. W., R. T. Pon, and J. H. van de Sande. 1987. A general method for the purification ofsynthetic oligodeoxyribonucleotides containing strong secondary structure by reversed-phase highperformanceliquid chromatography on PRP-1 resin. Analytical Biochemistry 165: 399–405.16. Swiderski, P. M., E. L. Bertrand, and B. E. Kaplan. 1994. Polystyrene reverse-phase ion-pair chromatographyof chimeric ribozymes. Analytical Biochemistry 216: 83–88.17. Johnson, J. L., W. Guo, J. Zang, et al. 2005. Quantification of raf antisense oligonucleotide (rafAON) inbiological matrices by LC-MS/MS to support pharmacokinetics of a liposome-entrapped rafAON formulation.Biomedical <strong>Chromatography</strong> 19: 272–278.18. Lee, D. P. 1988. Chromatographic evaluation of large-pore and non-porous polymeric reversed phases.Journal of <strong>Chromatography</strong> 443: 143–153.19. Huber, C. G., P. J. Oefner, and G. K. Bonn. 1992. <strong>High</strong>-performance liquid chromatographic separationof detritylated oligonucleotides on highly cross-linked poly-(styrene-divinylbenzene) particles. Journalof <strong>Chromatography</strong> 599: 113–118.20. Huber, C. G., P. J. Oefner, and G. K. Bonn. 1993. <strong>High</strong>-resolution liquid chromatography of oligonucleotideson nonporous alkylated styrene-divinylbenzene copolymers. Analytical Biochemistry 212:351–358.21. Gelhaus, S. L., and W. R. LaCourse. 2005. Separation of modified 2’-deoxyoligonucleotides using ionpairingreversed-phase HPLC. Journal of <strong>Chromatography</strong>. B, Analytical Technologies in the Biomedicaland Life Sciences 820: 157–163.22. Lloyd, L. L., M. I. Millichip, and K. J. Mapp. 2003. Rigid polymerics: the future of oligonucleotideanalysis and purification. Journal of <strong>Chromatography</strong> A 1009: 223–230.23. Unger, K. K., ed. 1990. Packings and Stationary <strong>Phase</strong>s in Chromatographic Techniques. New York:Marcel Dekker.24. Petro, M., F. Svec, and J. M. Frechet. 1996. Molded continuous poly(styrene-co-divinylbenzene) rod as aseparation medium for the very fast separation of polymers. Comparison of the chromatographic propertiesof the monolithic rod with columns packed with porous and non-porous beads in high-performanceliquid chromatography of polystyrenes. Journal of <strong>Chromatography</strong> A 752: 59–66.25. Afeyan, N. B., N. F. Gordon, I. Mazsaroff, et al. 1990. Flow-through particles for the high- performanceliquid chromatographic separation of biomolecules: perfusion chromatography. Journal of <strong>Chromatography</strong>519: 1–29.26. Svec, F., and J. M. J. Frechet. 1992. Continuous rods of macroporous polymer as high-performance liquidchromatography separation media. Analytical Chemistry 64: 820–822.27. Svec, F., and J. M. J. Frechet. 1995. Temperature, a simple and efficient tool for the control of pore sizedistribution in macroporous polymers. Macromolecules 28: 7580–7582.28. Mayr, B., G. Holzl, K. Eder, M. R. Buchmeiser, and C. G. Huber. 2002. Hydrophobic, pellicular, monolithiccapillary columns based on cross-linked polynorbornene for biopolymer separations. AnalyticalChemistry 74: 6080–6087.29. Oberacher, H., B. Wellenzohn, and C. G. Huber. 2002. Comparative sequencing of nucleic acids by liquidchromatography-tandem mass spectrometry. Analytical Chemistry 74: 211–218.30. Premstaller, A., H. Oberacher, W. Walcher, et al. 2001. <strong>High</strong>-performance liquid chromatographyelectrosprayionization mass spectrometry using monolithic capillary columns for proteomic studies.Analytical Chemistry 73: 2390–2396.31. Huber, C. G., P. J. Oefner, and G. K. Bonn. 1993. <strong>High</strong>-resolution liquid chromatography of oligonucleotideson nonporous alkylated styrene-divinylbenzene copolymers. Analytical Biochemistry 212:351–358.32. Huber, C. G., P. J. Oefner, and G. K. Bonn. 1992. <strong>High</strong>-performance liquid chromatographic separationof detritylated oligonucleotides on highly cross-linked poly-(styrene-divinylbenzene) particles. Journalof <strong>Chromatography</strong> 599: 113–118.33. Oberacher, H., A. Premstaller, and C. G. Huber. 2004. Characterization of some physical and chromatographicproperties of monolithic poly(styrene-co-divinylbenzene) columns. Journal of <strong>Chromatography</strong>A 1030: 201–208.34. Premstaller, A., H. Oberacher, and C. G. Huber. 2000. <strong>High</strong>-performance liquid chromatographyelectrosprayionization mass spectrometry of single- and double-stranded nucleic acids using monolithiccapillary columns. Analytical Chemistry 72: 4386–4393.K11050_C001.indd 4311/15/2010 6:29:06 PM
44 Handbook of Analysis of Oligonucleotides and Related Products35. Bisjak, C. P., L. Trojer, S. H. Lubbad, W. Wieder, and G. K. Bonn. 2007. Influence of different polymerisationparameters on the separation efficiency of monolithic poly(phenyl acrylate-co-1,4-phenylene diacrylate)capillary columns. Journal of <strong>Chromatography</strong> A 1154: 269–276.36. Wieder, W., C. P. Bisjak, C. W. Huck, R. Bakry, and G. K. Bonn. 2006. Monolithic poly(glycidyl methacrylate-co-divinylbenzene)capillary columns functionalized to strong anion exchangers for nucleotideand oligonucleotide separation. Journal of Separation Science 29: 2478–2484.37. Greiderer, A., S. C. Ligon, Jr., C. W. Huck, and G. K. Bonn. 2009. Monolithic poly(1,2-bis(p-vinylphenyl)ethane) capillary columns for simultaneous separation of low- and high-molecular-weight compounds.Journal of Separation Science 32: 2510–2520.38. Bakry, R., C. W. Huck, and G. K. Bonn. 2009. Recent applications of organic monoliths in capillaryliquid chromatographic separation of biomolecules. Journal of <strong>Chromatography</strong> Science 47: 418–431.39. Wieder, W., S. H. Lubbad, L. Trojer, C. P. Bisjak, and G. K. Bonn. 2008. Novel monolithic poly(p-methylstyrene-co-bis(p-vinylbenzyl)dimethylsilane)capillary columns for biopolymer separation. Journal of<strong>Chromatography</strong> A 1191: 253–262.40. Trojer, L., S. H. Lubbad, C. P. Bisjak, W. Wieder, and G. K. Bonn. 2007. Comparison between monolithicconventional size, microbore and capillary poly(p-methylstyrene-co-1,2-bis(p-vinylphenyl)ethane) highperformanceliquid chromatography columns synthesis, application, long-term stability and reproducibility.Journal of <strong>Chromatography</strong> A 1146: 216–224.41. Holdsvendova, P., J. Suchankova, M. Buncek, V. Backovska, and P. Coufal. 2007. Hydroxymethylmethacrylate- based monolithic columns designed for separation of oligonucleotides in hydrophilicinteractioncapillary liquid chromatography. Journal of Biochemical and Biophysical Methods 70: 23–29.42. Xiong, W., J. Glick, Y. Lin, and P. Vouros. 2007. Separation and sequencing of isomeric oligonucleotideadducts using monolithic columns by ion-pair reversed-phase nano-HPLC coupled to ion trap mass spectrometry.Analytical Chemistry 79: 5312–5321.43. Sturm, M., S. Quinten, C. G. Huber, and O. Kohlbacher. 2007. A statistical learning approach to the modelingof chromatographic retention of oligonucleotides incorporating sequence and secondary structuredata. Nucleic Acids Research 35: 4195–4202.44. Kohlbacher, O., S. Quinten, M. Sturm, B. M. Mayr, and C. G. Huber. 2006. Structure-activity relationshipsin chromatography: retention prediction of oligonucleotides with support vector regression.Angewwandte Chemie (International Edition in English) 45: 7009–7012.45. Przybyciel, M., and R. E. Majors. 2002. <strong>Phase</strong> collapse in reversed-phase LC. LC-GC Europe 15: 652–657.46. Agrawal, S., J. Y. Tang, and D. M. Brown. 1990. Analytical study of phosphorothioate analogues of oligodeoxynucleotidesusing high-performance liquid chromatography. Journal of <strong>Chromatography</strong> 509:396–399.47. Gilar, M., A. Belenky, and A. S. Cohen. 2000. Polymer solutions as a pseudostationary phase for capillaryelectrochromatographic separation of DNA diastereomers. Electrophoresis 21: 2999–3009.48. Metelev, V., and S. Agrawal. 1992. Ion-exchange high-performance liquid chromatography analysis ofoligodeoxyribonucleotide phosphorothioates. Analytical Biochemistry 200: 342–346.49. Huber, C. G. 1998. Micropellicular stationary phases for high-performance liquid chromatography ofdouble-stranded DNA. Journal of <strong>Chromatography</strong> A 806: 3–30.50. Gilar, M. 2001. Analysis and purification of synthetic oligonucleotides by reversed-phase highperformanceliquid chromatography with photodiode array and mass spectrometry detection. AnalyticalBiochemistry 298: 196–206.51. Snyder, L. R., J. W. Dolan, and P. W. Carr. 2004. The hydrophobic-subtraction model of reversed-phasecolumn selectivity. Journal of <strong>Chromatography</strong> A 1060: 77–116.52. Bidlingmeyer, B. A., S. N. Deming, W. P. Price, Jr., B. Sachok, and M. Petrusek. 1979. Retention mechanismfor reversed-phase ion-pair liquid chromatography. Journal of <strong>Chromatography</strong> 186: 419–445.53. Melander, W. R., and C. Horvath. 1980. Mechanistic study on ion-pair reversed-phase chromatography.Journal of <strong>Chromatography</strong> 201: 211–224.54. Cecchi, T. 2008. Ion pairing chromatography. Critical Reviews in Analytical Chemistry 38: 161–214.55. Jost, W., K. Unger, and G. Schill. 1982. Reverse-phase ion-pair chromatography of polyvalent ions usingoligonucleotides as model substances. Analytical Biochemistry 119: 214–224.56. Snyder, L. R., J. J. Kirkland, and J. W. Dolan. 2010. Introduction to Modern <strong>Liquid</strong> <strong>Chromatography</strong>. 3rded. Hoboken, N.J.: John Wiley.57. Andrus, A., and R. G. Kuimelis. 2001. Analysis and purification of synthetic nucleic acids using HPLC.Current Protocols in Nucleic Acid Chemistry Chapter 10: Unit 10.5.K11050_C001.indd 4411/15/2010 6:29:06 PM
Purity Analysis and Impurities Determination 4558. Haupt, W. P., and A. Pingoud. 1983. Comparison of several high-performance liquid chromatographytechniques for the separation of oligodeoxynucleotides according to their chain lengths. Journal of<strong>Chromatography</strong> 260: 419–428.59. Hoffman, N. E., and J. C. Liao. 1977. Reversed phase high performance liquid chromatographic separationsof nucleotides in the presence of solvophobic ions. Analytical Chemistry 49: 2231–2234.60. Crowther, J. B., R. Jones, and R. A. Hartwick. 1981. <strong>High</strong>-performance liquid chromatography of theoligonucleotides. Journal of <strong>Chromatography</strong> 217: 479–490.61. Makino, K., H. Ozaki, T. Matsumoto, H. Imaishia, T. Takeuchi, and T. Fukui. 1987. Reversed-phase ionpairchromatography of oligodeoxyribonucleotides. Journal of <strong>Chromatography</strong> A 400:271–277.62. McKeown, A. P., P. N. Shaw, and D. A. Barrett. 2002. Retention behaviour of an homologous seriesof oligodeoxythymidilic acids using reversed-phase ion-pair chromatography. Chromatographia 55:271–277.63. Kurata, C., D. C. Capaldi, Z. Wang, N. Luu, and H. Gaus. 2006. Methods for detection, identification andquantification of impurities. US Patent 2009/0095896, filed on Mar. 31, 2006.64. Ikuta, S., R. Chattopadhyaya, and R. E. Dickerson. 1984. Reverse-phase polystyrene column for purificationand analysis of DNA oligomers. Analytical Chemistry 56: 2253–2257.65. McCarthy, S. M., and M. Gilar. 2010. Hexylammonium acetate as an ion-pairing agent for IP-RP LCanalysis of oligonucleotides. Waters Application Note 720003361EN.66. Gjerde, D. T., L. Hoang, and D. Hornby. 2009. RNA Purification and Analysis: Sample Preparation,Extraction, <strong>Chromatography</strong>. Weinheim: Wiley-VCH.67. McCarthy, S. M., M. Gilar, and J. Gebler. 2009. Reversed-phase ion-pair liquid chromatography analysisand purification of small interfering RNA. Analytical Biochemistry 390: 181–188.68. Apffel, A., J. A. Chakel, S. Fischer, K. Lichtenwalter, and W. S. Hancock. 1997. New procedure forthe use of high-performance liquid chromatography–electrospray ionization mass spectrometry for theanalysis of nucleotides and oligonucleotides. Journal of <strong>Chromatography</strong> A 777: 3–21.69. Apffel, A., J. A. Chakel, S. Fischer, K. Lichtenwalter, and W. S. Hancock. 1997. Analysis of oligonucleotidesby HPLC-electrospray ionization mass spectrometry. Analytical Chemistry 69: 1320–1325.70. Gilar, M., K. J. Fountain, Y. Budman, J. L. Holyoke, H. Davoudi, and J. C. Gebler. 2003. Characterizationof therapeutic oligonucleotides using liquid chromatography with on-line mass spectrometry detection.Oligonucleotides 13: 229–243.71. Gilar, M., and U. D. Neue. 2007. Peak capacity in gradient reversed-phase liquid chromatography ofbiopolymers. Theoretical and practical implications for the separation of oligonucleotides. Journal of<strong>Chromatography</strong> A 1169: 139–150.72. Gaus, H. J., S. R. Owens, M. Winniman, S. Cooper, and L. L. Cummins. 1997. On-line HPLC electrospraymass spectrometry of phosphorothioate oligonucleotide metabolites. Analytical Chemistry 69:313–319.73. Griffey, R. H., M. J. Greig, H. J. Gaus, et al. 1997. Characterization of oligonucleotide metabolism invivo via liquid chromatography/electrospray tandem mass spectrometry with a quadrupole ion trap massspectrometer. Journal of Mass Spectrometry 32: 305–313.74. Bidlingmeyer, B., and Q. Wang. 2006. Additives for reversed-phase HPLC mobile phases. US Patent7125492, filed July 17, 2003 and issued Jan. 2005.75. McCarthy, S. M., W. J. Warren, A. Dubey, and M. Gilar. 2008. Ion-pairing systems for reversed-phasechromatography separation of oligonucleotides, paper presented at TIDES Conference in Las Vegas,Nevada.76. Bartha, Á., and J. Ståhlberg. 1994. Electrostatic retention model of reversed-phase ion-pair chromatography.Journal of <strong>Chromatography</strong> A 668: 255–284.77. Cruz, E., M. R. Euerby, C. M. Johnson, and C. A. Hackett. 1997. Chromatographic classification of commerciallyavailable reverse-phase HPLC columns. Chromatographia 44: 151–161.78. Bidlingmeyer, B. A. 1980. Separation of ionic compounds by reversed-phase liquid chromatography: anupdate of ion-pairing techniques. J. Chromatogr. Sci. 18: 525–539.79. Cantor, C. R., and P. R. Schimmel. 1980. The Conformation of Biological Macromolecules. Part 1. TheirBiophysical Chemistry. San Francisco: W. H. Freeman.80. Nawrocki, J. 1997. The silanol group and its role in liquid chromatography. Journal of <strong>Chromatography</strong>A 779: 29–71.81. Daignault, L. G., and D. P. Rillema. 1992. Ion-interaction chromatography: a study of the distribution ofn-alkylammonium ions on an ODS-2 column. Journal of <strong>Chromatography</strong> A 602: 3–8.K11050_C001.indd 4511/15/2010 6:29:06 PM
46 Handbook of Analysis of Oligonucleotides and Related Products82. Zou, Y., P. Tiller, I. W. Chen, M. Beverly, and J. Hochman. 2008. Metabolite identification of smallinterfering RNA duplex by high-resolution accurate mass spectrometry. Rapid Communications in MassSpectrometry 22: 1871–1881.83. Beverly, M., K. Hartsough, and L. Machemer. 2005. <strong>Liquid</strong> chromatography/electrospray mass spectrometricanalysis of metabolites from an inhibitory RNA duplex. Rapid Communications in MassSpectrometry 19: 1675–1682.84. Lei, B., S. Li, L. Xi, J. Li, H. Liu, and X. Yao. 2009. Novel approaches for retention time predictionof oligonucleotides in ion-pair reversed-phase high-performance liquid chromatography. Journal of<strong>Chromatography</strong> A 1216: 4434–4439.85. Gelhaus, S. L., W. R. LaCourse, N. A. Hagan, G. K. Amarasinghe, and D. Fabris. 2003. Rapid purificationof RNA secondary structures. Nucleic Acids Research 31: e135.86. Tan, L. C., P. W. Carr, and M. H. Abraham. 1996. Study of retention in reversed-phase liquid chromatographyusing linear solvation energy relationships I. The stationary phase. Journal of <strong>Chromatography</strong> A752: 1–18.87. Katritzky, A. R., S. Perumal, R. Petrukhin, and E. Kleinpeter. 2001. Codessa-based theoretical QSPRmodel for hydantoin HPLC-RT lipophilicities. Journal of Chemical Information Computer Sciences 41:569–574.88. Uhlmann, E., and A. Peyman. 1990. Antisense oligonucleotides: a new therapeutic principle. ChemicalReviews 90: 543–584.89. Dias, N., and C. A. Stein. 2002. Antisense oligonucleotides: basic concepts and mechanisms. MolecularCancer Therapeutics 1: 347–355.90. Kreuzian, T. B. 2009. Analysis of duplexes. Paper presented at EuroTides Conference, Dec. 2–3, inAmsterdam, Netherlands.K11050_C001.indd 4611/15/2010 6:29:06 PM