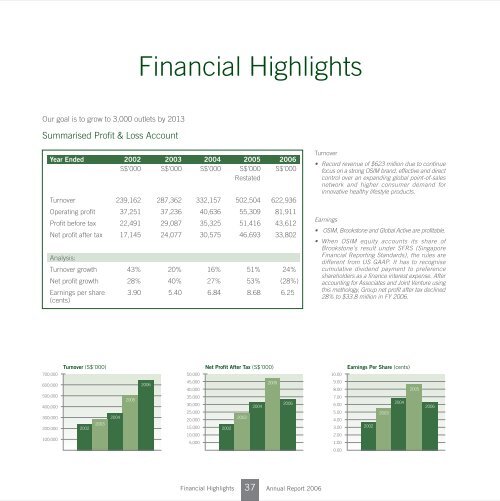
Financial HighlightsOur goal is to grow to 3,000 outlets by 2013Summarised Profit & Loss AccountYear Ended 2002 2003 2004 2005 2006S$’000 S$’000 S$’000 S$’000 S$’000RestatedTurnover 239,162 287,362 332,157 502,504 622,936Operating profit 37,251 37,236 40,636 55,309 81,911Profit before tax 22,491 29,087 35,325 51,416 43,612Net profit after tax 17,145 24,077 30,575 46,693 33,802Analysis:Turnover growth 43% 20% 16% 51% 24%Net profit growth 28% 40% 27% 53% (28%)Earnings per share 3.90 5.40 6.84 8.68 6.25(cents)Turnover Record revenue of $623 million due to continuefocus on a strong OSIM brand, effective and directcontrol over an expanding global point-of-salesnetwork and higher consumer demand forinnovative healthy lifestyle products.Earnings OSIM, Brookstone and Global Active are profitable. When OSIM equity accounts its share ofBrookstone's result under S<strong>FR</strong>S (SingaporeFinancial Reporting Standards), the rules aredifferent from US GAAP. It has to recognisecumulative dividend payment to preferenceshareholders as a finance interest expense. Afteraccounting for Associates and Joint Venture usingthis methology, Group net profit after tax declined28% to $33.8 million in FY 2006.700,000Turnover (S$’000)50,000Net Profit After Tax (S$’000)10.00Earnings Per Share (cents)600,000500,000400,000300,000200,000100,0002002200320042005200645,00040,00035,00030,00025,00020,00015,00010,0005,000200220032004200520069.008.007.006.005.004.003.002.001.00200220032004200520060.00Financial Highlights 37 Annual Report 2006
Summarised Balance SheetYear Ended 2002 2003 2004 2005 2006S$’000 S$’000 S$’000 S$’000 S$’000RestatedShareholders' equity 75,145 94,940 121,329 166,380 170,122Minority interests 1,386 1,780 1,979 7,436 6,21776,531 96,720 123,308 173,816 176,339Represented by:Fixed assets 61,923 24,046 28,718 42,136 49,038Associated companies 4,369 16,793 20,833 166,037 140,738and a Joint VentureGoodwill on consolidation 2,822 1,697 571 21,055 22,073Intangible assets 123 123 123 18,087 17,772Other non current assets - 5,311 657 10,899 16,45969,237 47,970 50,902 258,214 246,080Current assets 99,687 111,874 166,499 203,686 173,696Current liabilities (68,672) (62,219) (89,075) (189,959) (171,095)Net current assets/(liabilities) 31,015 49,655 77,424 13,727 2,601Less: Non-current liabilitiesTerm loans (22,198) (316) (4,482) (90,462) (66,639)Deferred taxation (261) - - (4,084) (4,254)Others (1,262) (589) (536) (3,579) (1,449)(23,721) (905) (5,018) (98,125) (72,342)76,531 96,720 123,308 173,816 176,339Other ratios:Total assets 168,924 159,844 217,401 461,900 419,776Return on total assets 10.1% 15.1% 14.1% 10.1% 8.1%Return of equity 22.8% 25.4% 25.2% 28.1% 19.9%Net asset value per share (cents) 16.9 21.3 27.1 37.1 31.4Shareholders’ Equity Shareholders’equity grew mainly due to profitsfor the year but is reduced by translationdifference from USD currency and dividends Minority interest has decreased due toincrease shareholding of subsidiaries inTaiwan and Global Active Limited (GAL)Assets Fixed assets have increased mainly due toincrease in number of outlets Joint venture decreased mainly due to OSIMBrookstone LP cumulative dividends andtranslation difference from USD currencyCurrent Liabilities Current liabilities have decreased mainly dueto less working capital loansNon Current Liabilities Term loans have decreased mainly due torepayment made during the year180,000Shareholders’ Equity (S$’000)500,000Total Assets (S$’000)40.0Net Asset Value Per Share (cents)160,000140,000120,000100,00080,00060,00040,00020,00020022003200420052006450,000400,000350,000300,000250,000200,000150,000100,00050,0002002200320042005200635.030.025.020.015.010.05.020022003200420052006Financial Highlights 38 Annual Report 2006