Notes for Exp. 34: UV-VIS/Fluorescence Spectroscopy S. K. Buratto ...
Notes for Exp. 34: UV-VIS/Fluorescence Spectroscopy S. K. Buratto ...
Notes for Exp. 34: UV-VIS/Fluorescence Spectroscopy S. K. Buratto ...

You also want an ePaper? Increase the reach of your titles
YUMPU automatically turns print PDFs into web optimized ePapers that Google loves.
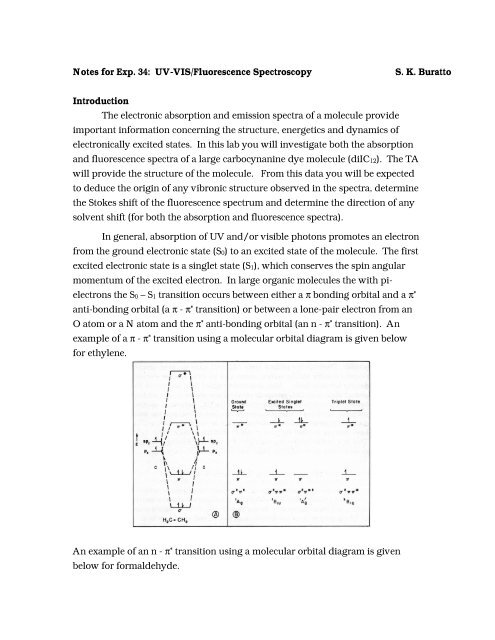
<strong>Notes</strong> <strong>for</strong> <strong>Exp</strong>. <strong>34</strong>: <strong>UV</strong>-<strong>VIS</strong>/<strong>Fluorescence</strong> <strong>Spectroscopy</strong>S. K. <strong>Buratto</strong>IntroductionThe electronic absorption and emission spectra of a molecule provideimportant in<strong>for</strong>mation concerning the structure, energetics and dynamics ofelectronically excited states. In this lab you will investigate both the absorptionand fluorescence spectra of a large carbocynanine dye molecule (diIC12). The TAwill provide the structure of the molecule. From this data you will be expectedto deduce the origin of any vibronic structure observed in the spectra, determinethe Stokes shift of the fluorescence spectrum and determine the direction of anysolvent shift (<strong>for</strong> both the absorption and fluorescence spectra).In general, absorption of <strong>UV</strong> and/or visible photons promotes an electronfrom the ground electronic state (S0) to an excited state of the molecule. The firstexcited electronic state is a singlet state (S1), which conserves the spin angularmomentum of the excited electron. In large organic molecules the with pielectronsthe S0 – S1 transition occurs between either a π bonding orbital and a π *anti-bonding orbital (a π - π * transition) or between a lone-pair electron from anO atom or a N atom and the π * anti-bonding orbital (an n - π * transition). Anexample of a π - π * transition using a molecular orbital diagram is given below<strong>for</strong> ethylene.An example of an n - π * transition using a molecular orbital diagram is givenbelow <strong>for</strong> <strong>for</strong>maldehyde.
The structure observed in the absorption and emission spectra of largeorganic molecules is due to coupling between the electronic states (i.e. the π, π *and n states) and the many vibrations of the molecule (i.e. the C-H stretches,C=O stretches, C=C stretches, benzene ring breathing modes, etc…). Theabsorption and fluorescence are now said to come from these vibronic states,rather than pure electronic states. A diagram illustrating the absorption andfluorescence spectra <strong>for</strong> a large molecule are shown below.In general, the absorption and fluorescence spectra will be mirror images of eachother as seen in the spectra above (solid line is absorption and dashed line isfluorescence). The splitting between the peak maxima of the absorption andfluorescence spectra is called the Stokes shift. In addition, there will usually beone or two vibrations which couple most strongly with the ground and excitedstates of the molecule. By measuring the frequency splitting between the peaks(or shoulders) of the absorption and emission spectra and comparing it to the
frequencies of particular vibrational modes, it is possible to determine whichvibration(s) couple most strongly with the electronic states. Finally, theinteraction between the dipoles (or induced dipoles) of the sovent molecules andthe polarized excited molecules influences the peak maximum of the absorptionand fluorescence spectra. This solvent shift is strongly dependent on the polarityof the solvent and will be investigated in this lab. A detailed discussion ofsolvent effects will be presented in lecture.TheorySee lecture notes of 4/10/01.Instrument:The absorption instrument is housed in the P. Chem. Lab and thefluorescence instrument is housed in 4624 PSBN.Sample PreparationThe TA will give you three 10 -6 M solutions of dye molecules; one intoluene, one in chloro<strong>for</strong>m and one in methanol. You will take the absorptionand fluorescence spectrum of each solution using a cuvette supplied by the TA.Load the cuvette into the instrument as instructed.Data AcquisitionThe absorption spectrum is acquired pointwise by scanning themonochromator as demonstrated by the TA. Make sure to scan slowly enoughso you do not miss any peaks. Remember to correct <strong>for</strong> the transmission of thelamp as a function of wavelength. The date should be input to a spreadsheet(e.g. MS Excel) <strong>for</strong> plotting. The fluorescence spectrum is acquired via thesoftware of the CCD camera. Once you have acquired the fluorescencespectrum, export the data as an ASCII file (as instructed by the TA) which canthen be imported to the spreadsheet. Plot both the absorption and fluorescencespectra on the same graph <strong>for</strong> comparison.Data AnalysisAre the absorption and fluorescence spectra mirror images of each other?Are there any resolved vibronic peaks (or shoulders)? Determine the vibronicsplitting in cm -1 (see class notes <strong>for</strong> example). Compare your value with typical
vibrational frequencies and determine the source of the coupling. Measure theStokes shift. Determine the solvent shift <strong>for</strong> both the absorption and fluorescencesprectra. Are they different? If so, why?