2006-34: The X-ray Telescope onboard Suzaku - HEASARC - NASA
2006-34: The X-ray Telescope onboard Suzaku - HEASARC - NASA
2006-34: The X-ray Telescope onboard Suzaku - HEASARC - NASA

You also want an ePaper? Increase the reach of your titles
YUMPU automatically turns print PDFs into web optimized ePapers that Google loves.
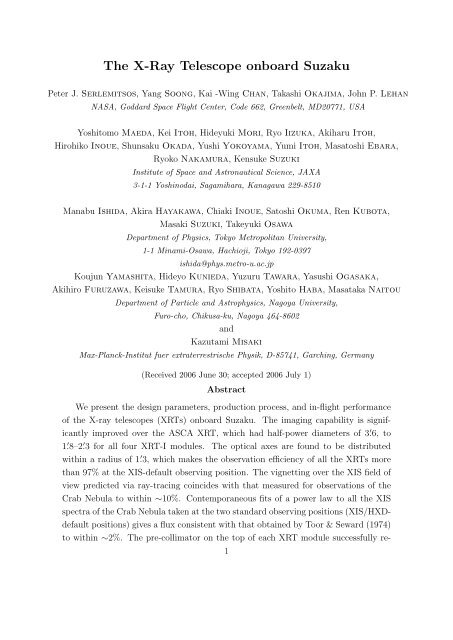
<strong>The</strong> X-Ray <strong>Telescope</strong> <strong>onboard</strong> <strong>Suzaku</strong>Peter J. Serlemitsos, Yang Soong, Kai -Wing Chan, Takashi Okajima, John P. Lehan<strong>NASA</strong>, Goddard Space Flight Center, Code 662, Greenbelt, MD20771, USAYoshitomo Maeda, Kei Itoh, Hideyuki Mori, Ryo Iizuka, Akiharu Itoh,Hirohiko Inoue, Shunsaku Okada, Yushi Yokoyama, Yumi Itoh, Masatoshi Ebara,Ryoko Nakamura, Kensuke SuzukiInstitute of Space and Astronautical Science, JAXA3-1-1 Yoshinodai, Sagamihara, Kanagawa 229-8510Manabu Ishida, Akira Hayakawa, Chiaki Inoue, Satoshi Okuma, Ren Kubota,Masaki Suzuki, Takeyuki OsawaDepartment of Physics, Tokyo Metropolitan University,1-1 Minami-Osawa, Hachioji, Tokyo 192-0397ishida@phys.metro-u.ac.jpKoujun Yamashita, Hideyo Kunieda, Yuzuru Tawara, Yasushi Ogasaka,Akihiro Furuzawa, Keisuke Tamura, Ryo Shibata, Yoshito Haba, Masataka NaitouDepartment of Particle and Astrophysics, Nagoya University,Furo-cho, Chikusa-ku, Nagoya 464-8602andKazutami MisakiMax-Planck-Institut fuer extraterrestrische Physik, D-85741, Garching, Germany(Received <strong>2006</strong> June 30; accepted <strong>2006</strong> July 1)AbstractWe present the design parameters, production process, and in-flight performanceof the X-<strong>ray</strong> telescopes (XRTs) <strong>onboard</strong> <strong>Suzaku</strong>. <strong>The</strong> imaging capability is significantlyimproved over the ASCA XRT, which had half-power diameters of 3. ′ 6, to1. ′ 8–2. ′ 3 for all four XRT-I modules. <strong>The</strong> optical axes are found to be distributedwithin a radius of 1. ′ 3, which makes the observation efficiency of all the XRTs morethan 97% at the XIS-default observing position. <strong>The</strong> vignetting over the XIS field ofview predicted via <strong>ray</strong>-tracing coincides with that measured for observations of theCrab Nebula to within ∼10%. Contemporaneous fits of a power law to all the XISspectra of the Crab Nebula taken at the two standard observing positions (XIS/HXDdefaultpositions) gives a flux consistent with that obtained by Toor & Seward (1974)to within ∼2%. <strong>The</strong> pre-collimator on the top of each XRT module successfully re-1
duces the intensity of the st<strong>ray</strong> light from the 20 ′ and 50 ′ -off directions down to thelevel of pre-flight expectations.Key words: Instruments: detectors — <strong>Telescope</strong>s — X-<strong>ray</strong>s: general1. Introduction<strong>The</strong> X-<strong>ray</strong> telescope <strong>onboard</strong> the Einstein observatory (Van Speybroeck 1979) representeddramatic improvements in both spatial resolution and sensitivity, and thereby allowedfor great advances in X-<strong>ray</strong> astronomy both qualitatively and quantitatively. Since this time,X-<strong>ray</strong> telescopes have gradually become essential to X-<strong>ray</strong> astronomy, and were adopted forboth EXOSAT (de Korte et al. 1981) and ROSAT (Aschenbach 1988).Another breakthrough was made by the thin-foil-nested X-<strong>ray</strong> telescopes <strong>onboard</strong>BBXRT (Serlemitsos 1988) and ASCA (Serlemitsos et al. 1995). <strong>The</strong>se mirrors allowed forthe first time the ability to reflect X-<strong>ray</strong>s up to ∼10 keV. This unprecedented capability enablesthe investigation of the astrophysically important iron K-shell features, which have beenobserved from various classes of celestial objects, both in detail and for much fainter sources.Further, this technology, along with the energy-resolving power of the CCDs (Burke et al.1991), has helped to unveil the nature of thermal plasmas and of X-<strong>ray</strong>-irradiated nebulae. Inorder to efficiently reflect high energy X-<strong>ray</strong>s, the incident grazing angle θ of the reflector mustbe within ∼ < 0.◦ 7. In such ultimate grazing-incidence geometries, the area effective for photoncollection becomes only a tiny fraction (∼ sin θ) of the geometric area of the reflectors. Toovercome this disadvantage, a number of reflectors are tightly nested confocally and coaxially.In addition, it is important to make the reflector substrate as thin as possible for high apertureefficiency, because the substrate edge forms a dead area. <strong>The</strong> idea of a thin-foil-nested telescopehas been successfully implemented for the X-<strong>ray</strong> telescopes <strong>onboard</strong> Beppo-SAX (Conti et al.1994), XMM-Newton (Aschenbach 2002; Lumb et al. 2003), and Swift (Burrows et al. 2005).<strong>The</strong> X-<strong>ray</strong> telescope <strong>onboard</strong> <strong>Suzaku</strong> (Mitsuda et al. <strong>2006</strong>), hereafter referred to as XRT,is also a thin-foil-nested Wolter-I type telescope. Another type of X-<strong>ray</strong> telescope is one thatachieves the ultimate imaging capability with accurate Wolter-I optics, which is <strong>onboard</strong> theChandra X-<strong>ray</strong> Observatory (Weisskopf et al. 2002). Given a severe weight limit imposed bythe launch vehicle for <strong>Suzaku</strong>, however, we have intended to achieve the maximum possibleeffective area particularly at the energy of the iron K lines. At the same time, the shapes of theprimary and secondary reflectors, a paraboloid and hyperboloid, respectively, in the originalWolter type I optics, are both approximated by cones in <strong>Suzaku</strong>, since they are very similar intheir grazing optics. This approximation ultimately limits the imaging capability of the <strong>Suzaku</strong>XRT, in that the image in the focal plane cannot be smaller than ltanθ in principle, where land θ are the axial length and the grazing angle of a typical reflector (Kunieda et al. 2001). In2
the case of the <strong>Suzaku</strong> XRT, this results in the Half-Power Diameter (HPD) of ∼18 ′′ .Since ASCA, improvement have been made in three areas. First, the incident grazingangle has been reduced to be < ∼ 0.◦ 6 so that even the outermost mirror shell can reflect the ironK photons. <strong>The</strong> diameter of the X-<strong>ray</strong> telescope has increased from ∼350 mm to ∼400 mm.Accordingly, the focal lengths are extended to 4.50 m and 4.75 m, compared with that of 3.5 mfor ASCA. Second, the smoothness of the ASCA reflectors was achieved by coating the acryliclacquer on the rolled aluminum substrate followed by vacuum deposition of a gold layer on topof it. However, there remains a mid frequency figure error on the surface of the lacquer, whichresults in image broadening. We therefore have adopted the replica method for producing the<strong>Suzaku</strong> reflectors (Serlemitsos & Soong 1996). In this method, the gold layer is sputtered ontoa glass tube of highly smooth surface and is transferred to a reflector substrate with epoxyas adhesive. This improves the HPD from ∼3. ′ 6 for ASCA to ∼1. ′ 9 for <strong>Suzaku</strong>. Finally, sincethe reflectors are tightly packed in the mirror housing, X-<strong>ray</strong>s arriving from outside the fieldof view can be reflected by adjacent surfaces or skip the normal reflections and then appearas X-<strong>ray</strong> images in the field of view. In order to avoid such st<strong>ray</strong> light, we have provided apre-collimator on top of each XRT (Mori et al. 2005). We install five XRT modules on the topplate of the Extensible Optical Bench (EOB). One is referred to as the XRT-S which has a focallength of 4.50 m and was adapted to the X-Ray Spectrometer (XRS; X-<strong>ray</strong> micro-calorimeter;Kelley et al. (<strong>2006</strong>)). <strong>The</strong> other four modules are designated as XRT-I0, I1, I2, I3 with a focallength of 4.75 m, and are dedicated for the X-<strong>ray</strong> Imaging Spectrometer (XIS; X-<strong>ray</strong> CCDcamera; Koyama et al. (<strong>2006</strong>)). Since <strong>Suzaku</strong> is the revival mission of Astro-E1, which failedto reach orbit on 2000 February 10 (Inoue 2003), the basic design and performance verified inthe ground-based calibration have already been published (Kunieda et al. 2001; Shibata et al.2001; Misaki et al. 2005).In this paper, we present first the design parameters of the <strong>Suzaku</strong> XRT in section 2.<strong>The</strong> expected performance on the basis of the ground-based calibration is also described. Insection 3, characteristics of the <strong>Suzaku</strong> XRTs such as effective area, imaging capability, andvignetting, are summarized based on in-flight data. A summary is provided in section 4.2. Design Parameters and Expected Performance from Ground Measurements2.1. <strong>Telescope</strong> Design<strong>The</strong> design parameters of the X-<strong>ray</strong> telescope <strong>onboard</strong> Astro-E1 launched on 2000February 10 are described in full detail in Kunieda et al. (2001). <strong>The</strong> basic telescope design of<strong>Suzaku</strong> has not been changed since Astro-E1, except for the pre-collimator newly adopted for<strong>Suzaku</strong>. <strong>The</strong> reader is referred to this paper for more details on the <strong>Suzaku</strong> XRT.In table 1, we summarize all the design parameters of the <strong>Suzaku</strong> XRT. <strong>The</strong> primaryconstraint on the size of the XRT originates from the maximum possible focal length, which3
Table 1. X-Ray <strong>Telescope</strong> Design ParametersXRT-I XRT-S ASCAFocal Length 4.75 m 4.50 m 3.50 mNumber of Module 4 1 4SubstrateMaterial Aluminum Aluminum AluminumSubstrate Thickness 152 µm 152 µm 127 µmAxial Length 101.6 mm 101.6 mm 101.6 mmReflectorMaterial Au Au AuThickness > 1000 Å > 1000 Å 500 ÅAdhesive material Epoxy Epoxy Acrylic lacquerAdhesive thickness 25 µm 25 µm 10 µmNumber of Nesting 175 168 120Diameter of innermost reflector 118 mm 119 mm 120 mmDiameter of outermost reflector 399 mm 400 mm <strong>34</strong>5 mmIncident angle 0. ◦ 18–0. ◦ 60 0. ◦ 19–0. ◦ 63 0. ◦ 24–0. ◦ 70Number of Reflectors/<strong>Telescope</strong> 1400 1<strong>34</strong>4 960Geometrical Area/<strong>Telescope</strong> 873 cm 2 887 cm 2 558 cm 2Weight/<strong>Telescope</strong> 19.3 kg 19.9 kg 9.84 kgField of View aat 1 keV 20 ′ 20 ′ 24 ′at 7 keV 14 ′ 14 ′ 16 ′Effective Area (per XRT) bat 1.5keV 450 cm 2 450 cm 2 300cm 2at 7.0keV 250 cm 2 250 cm 2 150cm 2Spatial Resolution (HPD) b 2. ′ 0 2. ′ 0 3. ′ 6a Diameter of the area within which the effective area is more than 50% of the on-axis value.b Measured on the ground.is 4.75 m for XRT-I, determined by the space within the nose fairing of the M-V rocket. ForXRT-S, the XRS detector ar<strong>ray</strong> is within a dewar, located ∼70 cm above the base plate ofthe spacecraft. Accordingly, we inserted the mirror support with a length of 59 cm betweenthe top plate of EOB and XRT-S, and achieved a focal length of 4.50 m. In Fig. 1 we give aschematic view of the XRTs mounted on the top plate of the EOB. Given the focal length, thediameter of the telescope is determined by the requirement that the iron K-shell emission lines(
Fig. 1. Schematic view of the <strong>Suzaku</strong> XRTs mounted on the top plate of the Extensible Optical Bench(EOB). By courtesy of K. Abe, NIPPI Corporation.the XRT-I and XRT-S, respectively. Note that 0. ◦ 60 corresponds to the critical grazing angle ofgold for the total reflection of the 7.65 keV X-<strong>ray</strong>. Within the radius of 200 mm, the reflectorshells are confocally nested with the ultimate tightness where X-<strong>ray</strong>s from the on-axis directionbe reflected by the primary reflectors, whereas the entire surface of any primary reflector isnever shaded by the inner adjacent primary reflector. This determines the total number ofnestings, 175 and 168, for the XRT-I and the XRT-S, respectively. Fig. 2 gives a picture of oneof the telescope modules, XRT-I1.Finally, the number of XRT-I modules is determined to be four, by taking into accountthe available area of the EOB top plate. Fig. 3 gives the total effective area of the four XRT-Imodules, including the detector efficiency, in comparison with that of XMM-Newton (PN +2MOS) and Chandra (ACIS-I and ACIS-S). <strong>The</strong> effective areas for Chandra were calculatedfrom the ARF files prepared for proposal planning of the AO2 cycle 1 , while those for XMMwere from the ARF prepared for the nominal position using CALINDEX #0122 2 . Althoughthe total weight is only ∼ < 80 kg, the effective area of the four XRT-I modules at 7 keV iscomparable to that of XMM-Newton mirrors whose total weight is as much as 1311 kg.1http://asc.harvard.edu/2http://xmm.vilspa.esa.es/5
2.2. ReflectorsFig. 2. Picture of the module XRT-I1. Note that the thermal shield is not yet attached.<strong>The</strong> reflectors of the <strong>Suzaku</strong> XRT were produced through a replication method(Serlemitsos & Soong 1996) in which a thin ( ∼ > 1000Å) gold layer sputtered on a highly smoothglass tube is transferred to an aluminum substrate with epoxy as adhesive. We adopted #2024aluminum sheet with thickness of 152 µm (= 6.0 mil) as the substrate of the reflector for itsstiffness and lightness. It is first cut into fan shape, which is deployed as a quarter of a cone,and then formed into conical shape in an oven at 200 ◦ C for 8 hr, by being pushed onto a shapingmandrel with air pressure. <strong>The</strong> shaping mandrels are mechanically polished as smoothlyas 2–3 µm in peak-to-bottom. This process finally determines the shape of each reflector. Inthe meantime, gold is sputtered in a vacuum chamber onto a cylindrical glass mandrel which isa borosilicate glass tube produced by Schott Glaswerke (Germany). Gold is used as an agentto separate the reflector from the glass mandrel as well as reflecting surface. <strong>The</strong> smoothnessof the surface of the glass tube is equivalent to that of float glass, with a micro roughness ofonly a few Å. After these two processes, we sp<strong>ray</strong> epoxy as glue onto the inner side of thesubstrate until its thickness becomes 25 µm. <strong>The</strong> epoxy of this amount is thick enough to fill alarge-scale figure error of the substrate and to make the reflecting surface as smooth as that ofthe glass mandrel. <strong>The</strong> epoxy-sp<strong>ray</strong>ed substrate is adhered to the gold-layered glass mandrelin a vacuum chamber, and the epoxy is cured at 40 ◦ C for 8 hr. Finally, the substrate can easilybe separated off at the boundary of the glass and the gold.We have measured the surface shape of the reflector thus produced with optical laser6
Fig. 3. Total effective area of the four XRT-I modules in comparison with that of XMM-Newton andChandra. Transmissions of the thermal shield and the optical blocking filter, and the quantum efficiencyof the CCD are all taken into account.profilometers and by utilizing X-<strong>ray</strong> scattering. It is found that the amplitude of micro roughnesswith a surface wavelength of ∼ < 30µm is as small as that of the Chandra reflector (Zissa1999), whereas that with a surface wavelength of ∼ > 100 µm is larger by several orders of magnitude(Misaki et al. 2005). In Fig. 4, we show the encircled-energy fraction (EEF) of one ofthe typical <strong>Suzaku</strong> quadrants at three different energies measured at the ISAS 30 m beam line(Shibata et al. 2001), in comparison with that of ASCA. <strong>The</strong> diameter to define the 100% fluxis taken to be 24 ′ for the ASCA XRT and 17. ′ 8 (= the size of the CCD chip) for the <strong>Suzaku</strong>XRT-I. <strong>The</strong> HPD is significantly improved from ASCA (∼3. ′ 6). This is owing to the fact thatthe mid-frequency figure error of the acrylic lacquer surface of the ASCA reflector is significantlyreduced by the replication method. Nevertheless, the HPD of 1. ′ 9 is still far from thedesign value of ∼0. ′ 3. This is due to the longer wavelength figure error remaining on the replicasurface and positioning error or the reflectors in the housing of the XRT (Misaki et al. 2005).On the other hand, the HPD at the three energies are nearly identical, being slightly smallerat the highest energy 9.44 keV. This is a remarkable contrast with that of ASCA (Fig. 10 ofSerlemitsos et al. (1995)), where the EEF becomes significantly broader at higher energies. Thisdemonstrates that the micro roughness of the gold surface is so small that it does not affectthe image blur in the <strong>Suzaku</strong> XRT. This is a significant merit of the replication method.2.3. Pre-CollimatorIt is known that ASCA observations were sometimes hampered by X-<strong>ray</strong>s arriving fromsources out of the field of view, which we refer to as st<strong>ray</strong> light. In order to reduce this st<strong>ray</strong>7
Fig. 4. Encircled-energy fraction (EEF) of a typical quadrant of XRT-I at the three energies 4.51 keV,8.04keV, and 9.44keV, in comparison with that of ASCA measured at 4.51 keV. <strong>The</strong> diameter to definethe 100% flux is 24 ′ for the ASCA XRT and 17. ′ 8 (= the size of the CCD chip) for the XRT-I quadrant.light, we have planned to introduce a pre-collimator in front of the XRT for the first time. Itsdesign, production process, and performance verification in the ground-based calibration aredescribed in Mori et al. (2005) in full detail. Hence, we describe them only briefly here.Since a number of reflectors are tightly installed in the telescope housing, it is possiblethat some X-<strong>ray</strong>s are reflected/scattered in the housing on light paths other than the nominaldouble reflection. <strong>The</strong>se abnormally reflected/scattered X-<strong>ray</strong>s are potential candidates of st<strong>ray</strong>light which form a ghost image within the detector field of view. Among various components ofst<strong>ray</strong> light, the “secondary reflection” and the “backside reflection” are the two major componentswhose paths are shown in Fig. 5. <strong>The</strong> “secondary reflection” is the light path where theincident X-<strong>ray</strong> is reflected only by the secondary reflector, whereas in the “backside reflection”the incident X-<strong>ray</strong> is first reflected by a backside of the primary reflector followed by undergoingthe normal double reflection. For geometrical reason, these two components appear onthe opposite side from the detector center, irrespective of the incident orientation of the st<strong>ray</strong>light.Since the “backside reflection” includes the reflection on a less shiny backside, the st<strong>ray</strong>flux due to the “backside reflection” is at least a factor of 5–6 smaller than that of the “secondaryreflection”. Hence, it is much more important to reduce the “secondary reflection”. For thisto be achieved, it is easily understood from the Fig. 3 that the secondary reflection, arrivingat the center of the field of view, in particular, can be cut if a cylindrical blade is placedjust on top of the primary reflector. In order to suppress st<strong>ray</strong> images from all “secondaryreflections” within the XIS field of view, 17. ′ 8×17. ′ 8, a series of blades is needed whose height is8
(a) Normal Reflection (b) Secondary Reflection (c) Backside Reflection(τ
thinner than the reflector by roughly ∼50 µm.Because of the limited height of the blades, we cannot completely eliminate secondaryreflections from off-axis angles in the range 11 ′ –30 ′ (Fig. 5 of Mori et al. (2005)). In addition,although the top of the blades are located 30 mm above the primary reflectors, we need to have8 mm space between the blade bottom and the reflector top. Unfortunately, X-<strong>ray</strong>s arrivingfrom off-axis angles of 60 ′ –70 ′ pass through this space and form ghost images in the focal plane.However, the X-<strong>ray</strong>s from off-axis directions in the range 20 ′ –70 ′ are diminished by more than90% compared to the case of no pre-collimator. This is of significant merit in observing the faintouter regions of diffuse sources such as clusters of galaxies, and reducing contamination due tothe cosmic X-<strong>ray</strong> background. It is also important to note that the remaining ghost images dueto secondary reflections concentrate on the edge of the field of view, and the detector center isnearly free from the secondary reflection, as demonstrated in Fig. 12 of Mori et al. (2005).2.4. <strong>The</strong>rmal ShieldAfter the installation of the pre-collimator on top of each XRT, the entrance side iscovered with a thermal shield, in order to isolate the XRT thermally from space as well asto reflect infrared radiation from the interior of the spacecraft. This is to keep the XRTtemperature within the specified range of 20±7.5 ◦ C. <strong>The</strong> thermal shield also works to blockingoptical light from the sky and from the surface of Earth illuminated by the sun.In Fig. 6, we give a schematic view of the thermal shield. As for the XRT itself, theFig. 6. Schematic view of the <strong>Suzaku</strong> thermal shield.10
thermal shield is also produced as units of quadrants. <strong>The</strong> thermal shield is mechanicallysustained by a frame made of aluminum, with a thickness of 4 mm. <strong>The</strong> frame has thirteenspokes which are along the alignment bars of the XRT. A stainless steel mesh with a wire pitch,width and thickness of 3 mm, 0.1 mm, and 0.15 mm, respectively, is glued with epoxy to thetop side of the frame. Finally, a polyethylene teleftalate (PET) film as thin as 0.24 µm, coatedwith aluminum layer with thickness of 30 nm on the surface oriented to the space, is adheredto the mesh with epoxy.Fig. 7 gives the transmission of X-<strong>ray</strong>s as a function of energy. <strong>The</strong> data were taken at theFig. 7. Transmission of the thermal shield as a function of X-<strong>ray</strong> energy measured at the synchrotronbeam facility SPring-8. Note that the transmission of the mesh is not included. Different colors indicateseparate measurements carried out with a different grating apparatus.beamline for soft X-<strong>ray</strong> spectroscopy (BL25SU) at the synchrotron radiation facility SPring-8.Note that the measurements are carried out only for the PET film with the aluminum coating.For the real thermal shield, the transmission of the stainless steel mesh 92.4 %, which is equalto the fraction of the geometrically open area, should additionally be multiplied. <strong>The</strong> K-shellabsorption edges of carbon and oxygen can be identified at 0.28 keV and 0.53 keV, respectively.<strong>The</strong> wavy structure is due to XAFS associated with the K-edges. See Kunieda et al. (2001) formore detail about the thermal shield.3. In-flight PerformanceIn this section we describe the in-flight performance and calibration of the <strong>Suzaku</strong> XRTs.Note that the XRS (Kelley et al. <strong>2006</strong>) ran short of the coolant helium before observing celestialobjects, and hence, there are no data to verify the in-flight performance of the XRT-S.11
Accordingly, we hereafter concentrate on the four XRT-I modules (XRT-I0 through I3) whichfocus incident X-<strong>ray</strong>s onto the XIS detectors.3.1. Optical Axis<strong>The</strong> maximum transmission of each telescope module is achieved when a target star isobserved along the optical axis. <strong>The</strong> optical axes of the four XRT-I modules are, however,expected to scatter within an angular range of ∼1 ′ . Accordingly, we need to define the axisto be used for real observations that provides a reasonable compromise among the four opticalaxes. We hereafter refer to this axis as the observation axis.In order to determine this observation axis, we have first searched for the optical axis ofeach XRT-I module by observing the Crab Nebula at various off-axis angles. <strong>The</strong> observationsof the Crab Nebula were carried out in the following three groups. Hereafter all the off-axisangles are expressed in the detector coordinate system (Det-X,Det-Y) (Ishisaki et al. <strong>2006</strong>).1. 2005 Aug. 22 03:30UT – 15:33UT: a short observation near the center of the detectors,which is defined as the origin (0 ′ ,0 ′ ) of the (Det-X,Det-Y) scheme, until 06:00UT followedby the four 10 ′ -off observations at (Det-X,Det-Y) = (±10 ′ ,0 ′ ) and (0 ′ ,±10 ′ ).2. 2005 Aug. 24 23:58UT – Aug. 27 07:30UT: a series of the off-axis observations at(Det-X,Det-Y) = (±3. ′ 5,0 ′ ), (0 ′ ,±3. ′ 5), (±7. ′ 0,0 ′ ), (0 ′ ,±7. ′ 0), (±20,0 ′ ), (0 ′ ,±20 ′ ), (+50 ′ ,0 ′ )and (+120 ′ ,0 ′ ).3. 2005 Sep. 15 01:00UT – Sep. 16 08:50UT: pointings at the XIS default position(Det-X,Det-Y) = (0 ′ ,0 ′ ) and the HXD default position (Det-X,Det-Y) = (−3. ′ 5,0 ′ ) as wellas the remaining three 50 ′ off pointings at (Det-X,Det-Y) = (−50 ′ ,0 ′ ) and (0 ′ ,±50 ′ ).Note that the field of view of the XIS detector is a square with 17. ′ 8 on a side. Thus only thedata taken at the origin, at ±3. ′ 5-off and at ±7. ′ 0-off are available for determining the opticalaxes.By fitting a model of a Gaussian plus a constant to the count rate as a function of theoff-axis angle, we determined the optical axis of each XRT-I module. <strong>The</strong> results are given inFig. 8. Since the optical axes moderately scatter around the origin, we have decided to adopt itas the observation axis for XIS-oriented observations as the default. Hereafter we refer to thisaxis as the XIS-default orientation, or equivalently, the XIS-default position. <strong>The</strong> optical axisof XRT-I0 shows the largest deviation of ∼1. ′ 3 from the XIS-default position. Nevertheless, theefficiency of XRT-I0 at the XIS-default position is more than 97% even in the highest 8–10 keVband (see Fig. 11). <strong>The</strong> optical axis of the HXD PIN detector, on the other hand, deviates by∼5 ′ in the negative Det-X direction (Takahashi et al. <strong>2006</strong>; Kokubun et al. <strong>2006</strong>). Because ofthis, the observation efficiency of the HXD PIN at the XIS-default orientation is reduced to∼93% of the on-axis value. We thus provide another default pointing position, the HXD-defaultposition, for HXD-oriented observations, at (Det-X, Det-Y) = (−3. ′ 5, 0 ′ ). At the HXD-defaultposition, the efficiency of the HXD PIN is nearly 100%, whereas that of the XIS is ∼88% on12
Fig. 8. Locations of the optical axis of each XRT-I module in the focal plane determined from the observationsof the Crab Nebula in 2005 August–September. This figure implies that the image on each XISdetector becomes brightest when a target star is placed at the position of the corresponding cross. <strong>The</strong>dotted circles are drawn every 30 ′′ in radius from the XIS-default position (see the text).the average.3.2. Effective AreaIn-flight calibration of the effective area has been carried out with the version 0.7 processeddata (Mitsuda et al. <strong>2006</strong>) of the Crab Nebula both at the XIS/HXD-default positions.<strong>The</strong> observations were carried out in 2005 September 15–16 (§3.1). <strong>The</strong> data were taken inthe normal mode with the 0.1 s burst option in which the CCD is exposed during 0.1 s out ofthe full-frame read-out time of 8 s, in order to avoid event pile-up and telemetry saturation.<strong>The</strong> exposure time of 0.1 s is, however, comparable to the frame transfer time of 0.025 s. Asa matter of fact, the Crab image is elongated in the frame-transfer direction due to so-calledout-of-time events, as shown in Fig. 9. Accordingly, the background-integration regions with asize of 126 by 1024 pixels are taken at the left and right ends of the chip for the XIS-defaultposition, perpendicularly to the frame-transfer direction, as shown in the left panel of Fig. 9.For observations at the HXD-default observation, the image center is shifted from the XISdefaultposition in the direction perpendicular to the frame-transfer direction for XIS0 andXIS3. Hence we can adopt the same background-integration regions as those of the XIS-defaultposition for these two XIS modules. For XIS1 and XIS2, on the other hand, the image shiftoccurs in the frame-transfer direction, as shown in the right panel of Fig. 9. We thus take a13
Fig. 9. <strong>The</strong> source- and background-integration regions overlaid on the Crab images taken with XIS1at the XIS-default position (left) and the HXD-default position (right) on 2005 September 15-16. <strong>The</strong>images are elongated in the frame-transfer direction due to out-of-time events (see the text). In order tocancel these events, the background regions with a size of 126 by 1024 pixels each are taken at the left andright ends of the chip for the XIS-default position, and a single region with a size of 252 by 1024 pixels istaken at the side far from the Crab image for the HXD-default position. <strong>The</strong> remaining source-integrationregion has a size of 768 by 1024 pixels, or 13. ′ 3×17. ′ 8. <strong>The</strong> background subtraction is carried out afterafter area-size correction.single background-integration region with a size of 252 by 1024 pixels at the far side from theCrab image for the HXD-default position of these two detectors. As a result, the remainingsource-integration region has a size of 768 by 1024 pixels, or 13. ′ 3×17. ′ 8 for all the cases, whichis wide enough to collect all the photons from the Crab Nebula.After subtracting the background, taking into account the sizes of the regions, we fittedthe spectra taken with the four XIS modules with a model composed of a power law with photoelectricabsorption using xspec (Arnaud 1996) version 11.2. For the photoelectric absorption,we have adopted the model phabs with the solar metal composition (Anders & Grevesse 1989).We first set all parameters free, allowing them to vary independently for all the XIS modules.<strong>The</strong> results are summarized for the XIS/HXD-default positions separately in table 3, and areshown in Fig. 10. In doing the fit, we adopted ae xi[0123] <strong>2006</strong>0213.rmf as the RMF, andae xi[0123] xisnom6 <strong>2006</strong>0615.arf or ae xi[0123] hxdnom6 <strong>2006</strong>0615.arf as the ARF forthe XIS and HXD-default positions, respectively. <strong>The</strong>se ARFs are made for use for a pointsource, whereas the Crab Nebula is slightly extended (∼2 ′ ). We thus created ARFs by utilizingthe <strong>ray</strong>-tracing simulator (Misaki et al. 2005) with a Chandra image as the input, and haveconfirmed that the difference of the effective area between these two sets of ARFs is less than1%. We have neglected the energy channels below 1 keV, above 10 keV, and in the 1.5–2.0 keVband because of insufficient calibration related to uncertainties of the nature and the amountof the contaminant on the OBF and Si edge structure (Koyama et al. <strong>2006</strong>). Those energychannels are retrieved after the fit and shown in Fig. 10.14
Table 3. Best-fit parameters of the power law model to the Crab spectra taken in 2005 September 15-16.Sensor ID N HaPhoton Index Normalization b Flux c χ 2 ν (d.o.f.)XIS-default positionXIS0 0.35±0.01 2.13±0.02 10.48 +0.27−0.26 2.15 0.97 (199)XIS1 0.30±0.01 2.07±0.02 9.52±0.23 2.14 1.27 (217)XIS2 0.33±0.01 2.09±0.02 10.09 +0.26−0.25 2.19 1.05 (200)XIS3 0.<strong>34</strong>±0.02 2.07±0.02 9.46 +0.25−0.24 2.13 1.11 (197)HXD-default positionXIS0 0.35±0.02 2.14±0.02 9.79 +0.31−0.30 1.97 1.21 (155)XIS1 0.29±0.02 2.09±0.02 8.90 +0.27−0.26 1.94 1.07 (170)XIS2 0.33±0.02 2.10±0.02 9.89 +0.28−0.27 2.13 1.03 (181)XIS3 0.32±0.02 2.06±0.02 9.38 +0.27−0.26 2.15 1.19 (180)a Hydrogen column density in a unit of 10 22 cm −2 .b Power-law normalization in a unit of photons cm −2 s −1 keV −1 at 1 keV.c Energy flux in a unit of 10 −8 cm −2 s −1 in the 2-10keV band.Toor & Seward (1974) compiled the results from a number of rocket and balloon measurementsavailable at that time, and derived the photon index and the normalization of thepower law of the Crab nebula to be 2.10 ± 0.03 and 9.7 photons cm −2 s −1 keV −1 at 1 keV,respectively. Overlaying photoelectric absorption with N H = 3 × 10 21 cm −2 , we obtain the fluxto be 2.09 × 10 −8 erg cm −2 s −1 in the 2–10 keV band. <strong>The</strong> best-fit parameters of all the XISmodules at the XIS-default position are close to these standard values. Although those at theHXD-default position show similar values, the fluxes of XIS0 and XIS1 are smaller than thestandard value by 6–7 %. Since the optical axes of these two detectors are farther away fromthe HXD-default position than those of the other two (Fig. 8), this may be due to insufficientcalibration of the optical axes and/or the vignetting (§3.3).Since the best-fit parameters of the four XIS modules are close to the standard values, wehave attempted to constrain the hydrogen column density and the photon index to be commonamong all the detectors. <strong>The</strong> best-fit parameters are summarized in table 4. <strong>The</strong> hydrogencolumn density (0.32–0.33)×10 22 cm −2 and the photon index 2.09±0.01 are consistent with thestandard values.Finally we would like to remark on our choice of the background-integration region.Since the background-integration region is taken at the very edge of the XIS field of view, onemay suspect possible under-subtraction of the background due to vignetting effects (§3.3) onthe background spectra. We thus have analyzed the data of MBM12 (Lynds 1457) off-cloudobservation carried out from <strong>2006</strong> February 6 through 8 (Smith et al. <strong>2006</strong>). <strong>The</strong> originalpurpose of this observation was to collect reliable background data for the main MBM12 observation.<strong>The</strong> pointing direction (l,b) ≃ (157. ◦ 3,−36. ◦ 8) is close to anti-galactic center like the15
Fig. 10. Power-law fit to the Crab spectra of all the four XIS modules taken at the XIS-default position.All parameters are set free, allowing them to vary independently for each XIS module. <strong>The</strong> fit is carried outin the 1.0-10.0keV band but excluding the interval 1.5-2.0 keV where a large systematic error associatedwith the Si K-edge remains, and the other channels are retrieved after the fit.Crab Nebula, and hence, this field is a good background sky also for Crab. In the MBM12off-cloud observation, the 2–10 keV flux within the same source-integration region as appliedto Crab was found to be 0.06–0.07 c s −1 for XIS0, 2, and 3 (FI) and 0.15 c s −1 for XIS1 (BI).This is only about one part per 10 4 of the counting rate of the Crab nebula in the same energyband. Moreover, the flux in the background-integration region was consistent with that fromthe source-integration region after appropriate area correction. This implies that the off-axisangle of the background-integration region is so small compared with the vignetting curve thatnon-X-<strong>ray</strong> background dominates over the reduction of CXB due to vignetting effects (§3.3)in the background-integration region. Consequently, we do not have to care about the undersubtractionof the background due to vignetting effects. Note also that the out-of-time eventsare the dominant source of the background in the observations of the Crab nebula. <strong>The</strong>y are,however, not subject to vignetting, either.3.3. Vignetting<strong>The</strong> vignetting curves calculated by the <strong>ray</strong>-tracing simulator are compared with theobserved intensities of the Crab nebula at various off-axis angles in Fig. 11. We have utilizedthe data of the Crab Nebula taken during 2005 August 22–27 (§3.1) to search for the opticalaxis of each XRT. In the figure, we have drawn the vignetting curves in the two energy bands 3–6 keV and 8–10 keV. To obtain this, we first assume the spectral parameters of the Crab Nebula16
Table 4. Best-fit parameters of the contemporaneous power-law fit to the Crab spectra taken in 2005 September 15-16.Sensor ID N HaPhoton Index Normalization b Flux c χ 2 ν (d.o.f.)XIS-default positionXIS0 0.33±0.01 2.09±0.01 9.93±0.13 2.17 1.22 (817)XIS1 — d — d 9.89±0.13 2.16XIS2 — d — d 10.04±0.13 2.19XIS3 — d — d 9.52±0.13 2.08average 9.845 2.15HXD-default positionXIS0 0.32±0.01 2.09±0.01 9.22 +0.15−0.14 2.00 1.27 (692)XIS1 — d — d 9.09±0.14 1.98XIS2 — d — d 9.77±0.15 2.13XIS3 — d — d 9.65±0.15 2.10average 9.433 2.05a Hydrogen column density in a unit of 10 22 cm −2 .b Power-law normalization in a unit of photons cm −2 s −1 keV −1 at 1 keV.c Energy flux in a unit of 10 −8 cm −2 s −1 in the 2–10keV band.d Constrained to be the same as the corresponding parameter of XIS0.to be a power law with N H = 0.33 × 10 22 cm −2 , photon index = 2.09, and the normalization =9.845 photons cm −2 s −1 keV −1 at 1 keV. <strong>The</strong>se values are the averages of the four detectors atthe XIS-default position (table 4). We then calculate the counting rate of the Crab Nebula onthe entire CCD field of view in every 0. ′ 5 step both in the Det-X and Det-Y directions using the<strong>ray</strong>-tracing simulator. Note that the abrupt drop of the model curves at ∼8 ′ is due to the sourceapproaching the detector edge. On the other hand, the data points provide the real countingrates in the corresponding energy bands within an aperture of 13. ′ 3 by 17. ′ 8. <strong>The</strong>y consist of theobservations at the five different off-axis angles 0 ′ , ±3. ′ 5, and ±7. ′ 0 both in Det-X and Det-Ydirections, where the origin is the XIS-default position (§3.1). Note that the aperture adoptedfor the observed data can collect more than 99% of the photons from the Crab Nebula, andhence the difference of the integration regions between the simulation and the observation doesnot matter. Finally, we renormalize both the simulation curve and the data so that the countingrate of the simulation curve at the origin becomes equal to unity. <strong>The</strong>se figures roughly showthat the effective area is calibrated to within ∼10% over the XIS field of view. We expect mostof these deviations can be attributed to scattering of the optical axis orientations of the fourquadrants within a telescope.3.4. Angular ResolutionVerification of the imaging capability of the XRTs has been made with the data of SS Cygin quiescence taken during 2005 November 2 01:02UT–23:39UT. <strong>The</strong> total exposure time was17
Fig. 11. Vignetting of the four XRT-I modules using the data of the Crab Nebula taken during 2005August 22–27 in the two energy bands 3–6 keV and 8–10 keV. <strong>The</strong> model curves are calculated with the<strong>ray</strong>-tracing simulator with the spectral parameters of N H = 0.33 × 10 22 cm −2 , photon index = 2.09, andthe normalization = 9.845 photons cm −2 s −1 keV −1 at 1 keV. Note that the abrupt drop of the modelcurves at ∼8 ′ is due to the source approaching the detector edge. See the text for more details. <strong>The</strong> excessof the data points of XIS1 is probably due to insufficient calibration of the backside-illuminated CCD.41.3 ks. SS Cyg is selected for this purpose because it is a point source and moderately bright(3.6, 5.9, 3.7, and 3.5 c s −1 for XIS0 through XIS3), and hence, it is needless to care aboutpile-up even at the image core.In evaluating the imaging capability, it is found that variation of the relative alignmentbetween the XRT system and the Attitude and Orbit Controlling System (AOCS) becomes asignificant problem. <strong>The</strong> variation is synchronized with the orbital motion of the spacecraft.This phenomenon is now understood to be due to the thermal distortion by the bright-earthillumination of the side panel #7 on which the instruments to measure the attitude of thespacecraft (the star trackers and the gyros) are mounted. <strong>The</strong> amplitude of the variation isas large as ∼50 ′′ at most, which cannot be neglected in evaluating the imaging capability.Software to correct this alignment variation has been developed. In the meantime, we simplyaccumulate the data taken while the pointing of the XRT is stable. In Fig. 12, we give theimage, the Point-Spread Function (PSF), and the EEF of all the XRT-I modules thus obtained.Due to this treatment, however, the total exposure time is reduced to be 9.1 ks. <strong>The</strong> HPD isobtained to be 1. ′ 8, 2. ′ 3, 2. ′ 0, and 2. ′ 0 for XRT-I0, 1, 2, and 3, respectively. <strong>The</strong>se values are ingeneral consistent with those expected from ground-based calibration measurements.3.5. St<strong>ray</strong> LightObservations of st<strong>ray</strong> light were carried out with the Crab Nebula during 2005 August 22– September 16 (§ 3.1) at the off-axis angles of (Det-X,Det-Y) = (±20 ′ ,0 ′ ), (0 ′ ,±20 ′ ), (±50 ′ ,0 ′ ),and (0 ′ ,±50 ′ ). An example st<strong>ray</strong>-light image is shown in the right panel of Fig. 13. This image18
XIS0 XIS1 XIS2 XIS310 -1 1 1010 -1 1 1010 -1 1 1010 -1 1 10888866664444DETY [ arcmin ]20-2DETY [ arcmin ]20-2DETY [ arcmin ]20-2DETY [ arcmin ]20-2-4-4-4-4-6-6-6-6-8-8 -6 -4 -2 0 2 4 6 8DETX [ arcmin ]-8-8 -6 -4 -2 0 2 4 6 8DETX [ arcmin ]-8-8 -6 -4 -2 0 2 4 6 8DETX [ arcmin ]-8-8 -6 -4 -2 0 2 4 6 8DETX [ arcmin ]Fig. 12. Image, Point-Spread Function (PSF), and EEF of the four XRT-I modules in the focal plane.All the images are binned with 2×2 pixels followed by being smoothed with a Gaussian with a sigma of3 pixels, where the pixel size is 24 µm. <strong>The</strong> EEF is normalized to unity at the edge of the CCD chip (asquare of 17. ′ 8 on a side). With this normalization, the HPD of the XRT-I0 through I3 is 1. ′ 8, 2. ′ 3, 2. ′ 0,and 2. ′ 0, respectively.was taken with XIS3 in the 2.5–5.5 keV band when the Crab Nebula is offset at (Det-X,Det-Y)=(−20 ′ ,0 ′ ). <strong>The</strong> left and central panels show simulated st<strong>ray</strong> light images without and with thepre-collimator, respectively, of a monochromatic point source of 4.5 keV being located at thesame off-axis angle. <strong>The</strong> ghost image seen in the left half of the field of view is due to the“secondary reflection”. Although the “secondary reflection” cannot be completely diminishedat the off-axis angle of 20 ′ (§ 2.3), the center of the field of view is nearly free from st<strong>ray</strong>light. <strong>The</strong> semi-circular bright region in the middle panel, starting from (Det-X, Det-Y) =(−8. ′ 9,+6. ′ 5) through ∼(0 ′ ,0 ′ ) where the image becomes fainter, and ending up at (−8. ′ 9,−6. ′ 5),originates from the innermost secondary reflector, because the space between the innermostreflector and the inner wall of the telescope housing is much larger than the reflector-reflectorseparation. This semi-circular bright region is marginally visible in the real Crab Nebulaimage in the right panel. Another remarkable difference between the simulation and the realobservation is the location of the brightest area; in the simulation, the left end of the image19
the XIS-default position. This makes the observation efficiency of all the XRTs more than 97%even at the high-energy limit 8–10 keV. <strong>The</strong> optical axis of the HXD PIN, however, is awayfrom the XIS-default position by ∼5 ′ in the negative Det-X direction. We thus have providedanother default pointing position, the HXD-default position, for HXD-oriented observations,which is (Det-X, Det-Y) = (−3. ′ 5, 0 ′ ). Vignetting calibration within the XIS field of view hasbeen carried out with the same Crab data. <strong>The</strong> observed vignetting is consistent with thatcalculated according to the telescope design and the spectral parameters summarized by Toor& Seward (1974) within ∼10%. From a contemporaneous fit of a power law to all the XISspectra taken at the XIS/HXD-default positions, we have found the hydrogen column densityand the photon index to be (0.32−0.33) × 10 22 cm −2 and 2.09 ± 0.01, respectively. <strong>The</strong> fluxesobtained from these fits are consistent with that predicted by Toor & Seward (1974) within∼3%. <strong>The</strong> in-flight imaging capability is what we have expected from ground-based calibration.Using the data of SS Cyg in quiescence, we have found that HPDs are in the range 1. ′ 8–2. ′ 3. Inorder to reduce st<strong>ray</strong> light photons, which arrive at the XIS detector from directions out of thefield of view, each XRT module is equipped with a pre-collimator. <strong>The</strong> pre-collimator works asexpected, and it successfully reduces the st<strong>ray</strong> lights from the directions of 20 ′ and 50 ′ -off fromthe XIS-default position.Acknowledgement<strong>The</strong> authors are grateful for dedicated contribution to the XRT production, pre-launchcalibration and various tests provided by the following people: Y. Terashima, M. Watanabe,K. Haga, T. Yoshioka, H. Takada, K. Matsunaga, S. Fukuda, T. Tanaka from Nagoya University:M. Itoh, S. Akao, K. Imamura from Kobe University: H. Honda, K. Okada, T. Endo, J. Ishida,Y. Hidaka, M. Maeda from ISAS/JAXA: T. Shimizu from Tokyo Metropolitan University:Curtis O’dell and technical staff and contractors at <strong>NASA</strong>/GSFC. <strong>The</strong> machine shop of NagoyaUniversity kindly supported us from technical aspect. <strong>The</strong> authors are grateful to B. Budau,W. Burkert, M. J. Freyberg, G. Hartner, G. Hasinger who kindly provided an opportunity tocalibrate XRT-I0 at the Panter test facility in Germany. <strong>The</strong> authors would like to expressour special thanks to Koichi Yamashiro, Hideo Yanai, Yusuke Hataide, Kazuhiro Abe, HitoshiKaneko, Takashi Sasaki, and Osamu Kubota from NIPPI Corporation for designing, constructing,and testing the Extensible Optical Bench. <strong>The</strong> synchrotron radiation experiments wereperformed at the BL25SU beamline in the SPring-8 with the approval of the Japan SynchrotronRadiation Research Institute (JASRI) (Proposal No. <strong>2006</strong>A1221). This research was supportedin part by a grand in aid of Specially Promoted Research contract (15001002) from the Ministryof Education, Culture, Sports, Science and Technology.21
ReferencesAnders, E., & Grevesse, N. 1989, Geochim. Cosmochim. Acta, 53, 197Arnaud, K. A. 1996, ASP Conf. Ser. 101: Astronomical Data Analysis Software and Systems V, 101,17Aschenbach, B. 2002, Proc. SPIE, 4496, 8Aschenbach, B. 1988, Appl. Opt., 27, 1404Burke, B. E., Mountain, R. W., Harrison, D. C., Bautz, M. W., Doty, J. P., Ricker, G. R., & Daniels,P. J. 1991, IEEE Trans. ED-38, 1069Burrows, D. N., et al. 2005, Space Science Reviews, 120, 165Conti, G., Mattaini, E., Santambrogio, E., Sacco, B., Cusumano, G., Citterio, O., Braeuninger, H. W.,& Burkert, W. 1994, Proc. SPIE, 2279, 101de Korte, P. A. J., Giralt, R., Coste, J. N., Ernu, C., Frindel, S., Flamand, J., & Contet, J. J. 1981,Appl. Opt., 20, 1080Inoue, H. 2003, Advances in Space Research, 32, 2089Ishisaki, Y. et al. <strong>2006</strong>, PASJ, this volumeKoyama, K. et al. <strong>2006</strong>, PASJ, this volumeKelley, R. et al. <strong>2006</strong>, PASJ, this volumeKokubun, M. et al. <strong>2006</strong>, PASJ, this volumeKunieda, H., et al. 2001, Appl. Opt., 40, 553Lumb, D. H., Finoguenov, A., Saxton, R., Aschenbach, B., Gondoin, P., Kirsch, M., & Stewart, I. M.2003, Proc. SPIE, 4851, 255Misaki, K., et al. 2005, Appl. Opt., 44, 916Mitsuda, K. et al. <strong>2006</strong>, PASJ, this volumeMori, H., et al. 2005, PASJ, 57, 245Serlemitsos, P. J., & Soong, Y. 1996, Ap&SS, 239, 177Serlemitsos, P. J., et al. 1995, PASJ, 47, 105Serlemitsos, P. J. 1988, Appl. Opt., 27, 1447Shibata, R., et al. 2001, Appl. Opt., 40, 3762Smith, R. K. et al. <strong>2006</strong>, PASJ, this volumeTakahashi, T. et al. <strong>2006</strong>, PASJ, this volumeTanaka, Y., Inoue, H., & Holt, S. S. 1994, PASJ, 46, 37LToor, A., & Seward, F. D. 1974, AJ, 79, 995Van Speybroeck, L. 1979, Proc. SPIE, 184, 2Weisskopf, M. C., Brinkman, B., Canizares, C., Garmire, G., Mur<strong>ray</strong>, S., & Van Speybroeck, L. P.2002, PASP, 114, 1Zissa, D. E., 1999, Proc. SPIE, 3766, 3622