Vblock Solution for SAP: Use Case and Performance Results - VCE
Vblock Solution for SAP: Use Case and Performance Results - VCE
Vblock Solution for SAP: Use Case and Performance Results - VCE

Create successful ePaper yourself
Turn your PDF publications into a flip-book with our unique Google optimized e-Paper software.
IntroductionLarge multifaceted data center organizations are under increasing pressure to reduce operating <strong>and</strong>capital costs through virtualization technologies while also being asked to improve applicationavailability <strong>and</strong> per<strong>for</strong>mance. <strong>Vblock</strong> Systems provide administrators <strong>and</strong> architects the capability tonot only virtualize business-critical <strong>and</strong> resource-intensive applications such as <strong>SAP</strong>, but alsorecognize return on investment through improved per<strong>for</strong>mance <strong>and</strong> efficiency.This document addresses how <strong>SAP</strong> can be virtualized on <strong>Vblock</strong> Systems to achieve significantimprovements in application per<strong>for</strong>mance compared with a typical retail customer environment usingCisco network infrastructure, EMC storage <strong>and</strong> in<strong>for</strong>mation infrastructure, <strong>and</strong> VMware virtualizationtechnologies. This document also provides test data <strong>and</strong> results illustrating the differences between<strong>SAP</strong> per<strong>for</strong>mance in non-virtualized <strong>and</strong> virtualized environments.Within this document, test data <strong>and</strong> results demonstrate the significant per<strong>for</strong>mance improvementsrealized with <strong>Vblock</strong> Systems. Per<strong>for</strong>mance analysis of these results is also given, to provide contextto what the results actually mean in production <strong>and</strong> test environments.Business caseEnterprise organizations need to validate the feasibility of virtualizing mission-critical applications like<strong>SAP</strong> in their data center environments as part of an overall private cloud strategy. To address theirconcerns about virtualizing <strong>SAP</strong> <strong>and</strong> placing it into the private cloud, administrators must haveassurances that application per<strong>for</strong>mance <strong>and</strong> operation will in fact provide significant improvements.By adopting a private cloud strategy <strong>and</strong> virtualizing <strong>SAP</strong> on <strong>Vblock</strong> Systems, customers can achievekey business objectives to reduce costs through virtualization while also significantly improvingapplication per<strong>for</strong>mance through ease of use.About this documentThis document presents in<strong>for</strong>mation on the per<strong>for</strong>mance of <strong>SAP</strong> on <strong>Vblock</strong> Systems in a virtualizedenvironment, compared to a retail customer’s production <strong>and</strong> test environment in a non-virtualizedenvironment.The test configuration was designed to support <strong>SAP</strong> running six application servers with close to20,000 <strong>SAP</strong>S on the Database Server <strong>and</strong> close to 9,000 <strong>SAP</strong>S on each application server in thenon-virtualized environment. Then, we ran a per<strong>for</strong>mance comparison between this configuration <strong>and</strong>the <strong>Vblock</strong> System.This document describes how <strong>SAP</strong> is virtualized using <strong>Vblock</strong> Systems, <strong>and</strong> it includes several testscenarios with per<strong>for</strong>mance metrics <strong>and</strong> comparisons that demonstrate the benefits of <strong>SAP</strong> on <strong>Vblock</strong>Systems. In addition, this document describes a set of use cases that are available when <strong>SAP</strong> isdeployed within a private cloud infrastructure.© 2013 <strong>VCE</strong> Company, LLC. All Rights Reserved.5
The purpose of this document is to describe how the:§ <strong>SAP</strong> solution was migrated to an offsite <strong>Vblock</strong> System.§ New environment was configured, tested, <strong>and</strong> validated to exceed the per<strong>for</strong>mance of a legacyenvironment.§ Advanced functionality of the <strong>Vblock</strong> System was used in value-add use cases, <strong>and</strong> validatedwithin a per<strong>for</strong>mance-testing environment.ScopeThis document provides a focused evaluation of the <strong>SAP</strong> l<strong>and</strong>scape on <strong>Vblock</strong> Systems <strong>and</strong> isapplicable to a wide variety of <strong>SAP</strong> l<strong>and</strong>scapes that could be virtualized to take advantage of theenhanced functionality of the <strong>Vblock</strong> System.AudienceThis document was written <strong>for</strong> customers interested in learning about <strong>SAP</strong> on the <strong>Vblock</strong> Systems,which includes <strong>SAP</strong> <strong>and</strong> infrastructure administrators <strong>and</strong> architects, as well as other individualstasked with evaluating, acquiring, managing, operating, or deploying <strong>SAP</strong> in a virtualized data centerenvironment.Key resultsThe following list details the key improvements observed during <strong>SAP</strong> on <strong>Vblock</strong> Systems testing:§ Per<strong>for</strong>mance improvement of 50% or more when running <strong>SAP</strong> on <strong>Vblock</strong> Systems comparedwith a retail customer’s production <strong>and</strong> test environments.§ Reduced complexity when configuring <strong>and</strong> deploying <strong>SAP</strong>, unlike physical server <strong>and</strong> databaseenvironments, which can be hampered by capacity, storage, <strong>and</strong> compute resource limitations.§ Increased scalability to dynamically add resources to a running virtual <strong>SAP</strong> dialog instance.§ Ability to per<strong>for</strong>m <strong>SAP</strong> recovery using RecoverPoint continuous remote replication.§ Support <strong>for</strong> Stateless Computing, allowing <strong>Vblock</strong> Systems service profiles to be migratedacross the environment without negatively impacting running systems.§ Simplified provisioning of new <strong>SAP</strong> servers through orchestration <strong>and</strong> automationFeedbackTo suggest documentation changes <strong>and</strong> provide feedback on this paper, send email todocfeedback@vce.com. Include the title of this paper, the name of the topic to which your commentapplies, <strong>and</strong> your feedback.© 2013 <strong>VCE</strong> Company, LLC. All Rights Reserved.6
Technology overviewThis section summarizes the technologies used in the solution.<strong>Vblock</strong> SystemsThe <strong>Vblock</strong> System from <strong>VCE</strong> is the world's most advanced converged infrastructure—one thatoptimizes infrastructure, lowers costs, secures the environment, simplifies management, speedsdeployment, <strong>and</strong> promotes innovation. The <strong>Vblock</strong> System is designed as one architecture that spansthe entire portfolio, includes best-in-class components, offers a single point of contact from initiationthrough support, <strong>and</strong> provides the industry's most robust range of configurations.<strong>Vblock</strong> System 720The <strong>Vblock</strong> System 720 is an enterprise, service provider class mission-critical system in the <strong>Vblock</strong>System 700 family, <strong>for</strong> the most dem<strong>and</strong>ing IT environments—supporting enterprise workloads <strong>and</strong>SLAs that run thous<strong>and</strong>s of virtual machines <strong>and</strong> virtual desktops. It is architecturally designed to bemodular, providing flexibility <strong>and</strong> choice of configurations based on dem<strong>and</strong>ing workloads. Theseworkloads include business-critical enterprise resource planning (ERP), customer relationshipmanagement (CRM), <strong>and</strong> database, messaging, <strong>and</strong> collaboration services. The <strong>Vblock</strong> System 720leverages the industry’s best director-class fabric switch, the most advanced fabric based bladeserver, <strong>and</strong> the most trusted storage plat<strong>for</strong>m. The <strong>Vblock</strong> System 720 delivers greater configurationchoices, 2X per<strong>for</strong>mance <strong>and</strong> scale from prior generations, flexible storage options, denser compute,five 9s of availability, <strong>and</strong> converged network <strong>and</strong> support <strong>for</strong> a new virtualization plat<strong>for</strong>m thataccelerates time to service <strong>and</strong> reduces operations costs.<strong>Vblock</strong> System 320The <strong>Vblock</strong> System 320 is an enterprise <strong>and</strong> service provider ready system in the <strong>Vblock</strong> System 300family, designed to address a wide spectrum of virtual machines, users, <strong>and</strong> applications. It is ideallysuited to achieve the scale required in both private <strong>and</strong> public cloud environments. The <strong>Vblock</strong>System 320 has been engineered <strong>for</strong> greater scalability <strong>and</strong> per<strong>for</strong>mance to support large enterprisedeployments of mission-critical applications, cloud services, VDI, mixed workloads <strong>and</strong> applicationdevelopment <strong>and</strong> testing. The <strong>Vblock</strong> System 320 delivers greater configuration choices, 2Xper<strong>for</strong>mance <strong>and</strong> scale from prior generations, flexible storage options, denser compute, five 9s ofavailability, <strong>and</strong> converged network <strong>and</strong> support <strong>for</strong> a new virtualization plat<strong>for</strong>m that accelerates timeto service <strong>and</strong> reduces operations costs. Every <strong>Vblock</strong> System 320 is available with the marketleadingEMC VNX storage arrays.For more in<strong>for</strong>mation, go to www.vce.com.© 2013 <strong>VCE</strong> Company, LLC. All Rights Reserved.7
<strong>Vblock</strong> Systems benefits<strong>Vblock</strong> Systems provide <strong>SAP</strong> customers with several benefits from its integrated hardware stackincluding:§ Fewer unplanned downtimes <strong>and</strong> reduced planned downtimes <strong>for</strong> maintenance activities§ Reduced complexity due to preconfigured <strong>and</strong> centralized IT resources leading to st<strong>and</strong>ardizedIT services§ Predictable per<strong>for</strong>mance <strong>and</strong> operational characteristics§ Tested <strong>and</strong> validated solutions with unified support <strong>and</strong> end-to-end vendor accountability§ Graceful scaling of a <strong>Vblock</strong> Systems environment by adding:- capacity to an existing <strong>Vblock</strong> System- more <strong>Vblock</strong> Systems§ Virtualized efficiency with predictable scaling <strong>for</strong> a given footprint© 2013 <strong>VCE</strong> Company, LLC. All Rights Reserved.8
Architecture overview<strong>Vblock</strong> System configurationThe table below describes the <strong>Vblock</strong> System 700 configuration used <strong>for</strong> this testing.ComponentCisco Unified ComputingSystemStorageStorage area networkConfiguration1 x Cisco B250 BladeMicrosoft Windows Server 2003 x64Microsoft SQL Server 2005 Enterprise Edition SP3 CU44 x Cisco B200 Blades – VMware vSphere Servers<strong>SAP</strong> central instance <strong>and</strong> <strong>SAP</strong> dialog instances on virtual machinesEMC Symmetrix VMAXCisco MDS 9222i Switches<strong>SAP</strong> server configurationThis section covers specific configuration in<strong>for</strong>mation <strong>for</strong> the <strong>SAP</strong> server. The key point to note here isthat only the database server was physical; the rest of the servers were configured as virtual serverswithin the <strong>Vblock</strong> System. The table below describes the <strong>SAP</strong> server configuration.© 2013 <strong>VCE</strong> Company, LLC. All Rights Reserved.9
ComponentDatabase server (B250 Blade)running on physical hardwareStorageApplication servers – running onVMware vSphere (B200 Blades)<strong>SAP</strong> application serverVMware vSphere 4StorageConfiguration12 CPU cores (2 x six-core Westmere X5670 2.93 GHz)192 GB RAM22 x 320 GB data volumes8 x 30 GB temp DB volumes1 x 200 GB logs volume1 x 2 TB backup/restore volume1 x 50 GB <strong>SAP</strong> executables volume1 x 350 GB OS, SQL <strong>and</strong> pagefile volume1 x 25 GB clustered SQL main mount point volumeQuest LightSpeed used <strong>for</strong> backup/restore8 CPU cores (2 x quad-core Nehalem X5570 2.93 GHz) per blade96 GB RAM per blade4x4 vServer 40 GB RAM3x6 vServer 40 GB RAM25 GB boot volume100 GB host volumeThis section describes the high-level configuration of the <strong>SAP</strong> environment on the <strong>Vblock</strong> System. TheProduction/QA/Test/Dev <strong>SAP</strong> environments were virtualized <strong>and</strong> resided on the Cisco UCS. EMCSymmetrix VMAX provided tiered storage based on per<strong>for</strong>mance expectations through a SANnetwork to the <strong>SAP</strong> l<strong>and</strong>scape.<strong>SAP</strong> production environment instance on <strong>Vblock</strong> SystemsThe configuration team was able to realize a key benefit of the <strong>Vblock</strong> System: the ability to supportmultitier architectures running either physical, virtual, or mixed modes.To demonstrate this capability, a Microsoft SQL Server was installed <strong>and</strong> configured <strong>for</strong> a retailcustomer’s <strong>SAP</strong> production environment system on a physical host. Using four ESXi hosts, eightvirtual machines were then created using five UCS servers to build the <strong>SAP</strong> l<strong>and</strong>scape. The primarycomponents of the <strong>SAP</strong> l<strong>and</strong>scape were:§ 1 x <strong>SAP</strong> central instance§ 7 x <strong>SAP</strong> application servers© 2013 <strong>VCE</strong> Company, LLC. All Rights Reserved.10
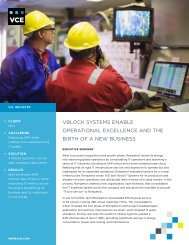
Figure 1 shows the <strong>SAP</strong> l<strong>and</strong>scape running on a <strong>Vblock</strong> System 700 configuration at the virtual,physical, <strong>and</strong> storage layers.Figure 1. <strong>SAP</strong> l<strong>and</strong>scape running on a <strong>Vblock</strong> System 700 configurationNote: Microsoft SQL Server 2005 is installed on a physical host while <strong>SAP</strong> central instance <strong>and</strong> dialog instancesare installed on virtualized hosts. The back-end storage used <strong>for</strong> this setup is EMC Symmetric VMAX.LayerVirtualPhysicalStorageDescription4 Cisco UCS B200 half-blade servers8-core CPU <strong>and</strong> 96 GB RAMMicrosoft SQL Server Database1 Cisco UCS B250-M2 full-blade server equipped with a 12-core CPU <strong>and</strong>192 GB RAM.Redundant pair of Cisco UCS 6120 Fabric Interconnects with 10 GigabitEthernet <strong>and</strong> Fibre Channel over Ethernet (FCoE) functionality.Cisco MDS 9222i Multiservice Modular Switch connects the UCS bladesthrough a fibre channel storage area network.© 2013 <strong>VCE</strong> Company, LLC. All Rights Reserved.11
Summary comparison of environmentsThe following table shows physical configurations of the retail customer’s production <strong>and</strong> testenvironments, compared with the <strong>Vblock</strong> System.Summary Customer production Customer test <strong>Vblock</strong> SystemDatabase server22 cores x 1.6 GHz(IA64/Itanium), 176 GB24 cores x 2.8 GHz(Opteron), 192 GB12 cores x 2.93 GHz(Nehalem/Westmere) 192GBDatabaseMicrosoft SQL Server2005Microsoft SQL Server 2005Microsoft SQL Server2005Operating systemMicrosoft WindowsServer 2003Microsoft Windows Server2003Microsoft WindowsServer 2003Central instance On App Server Tier On App Server Tier On App Server TierApp Server environment8 cores x 2.6 GHz(Opteron), 32 GB each8 cores x 2.4 GHz(Xeon)32 GB each4x4 vServer 40 GB RAM3x6 vServer 40 GB RAMApp Server number 6 6 HP Proliant BL680c G5 8Estimated <strong>SAP</strong>S on DBServerEstimated rating~19,388<strong>SAP</strong> 2-tier SD Benchmark:25,550Estimated rating: 22,675<strong>SAP</strong> 2-tier SDBenchmark : 25,500(approx.)Estimated <strong>SAP</strong>S on AppServer (each)9950 8775 6250HP LoadRunner N/A V 9.5 V 9.5Virtual users pergeneratorN/A 250(5 second frequency, 120runs)250(5 sec frequency, 120runs)Load Generators N/A 10 10The following definitions apply to each environment in this table:§ Customer production – the environment where the customer was actually running <strong>SAP</strong>. This canbe referred to as the “as-is” environment.§ Customer Test – the environment the customer was planning to implement after per<strong>for</strong>mancetesting was completed based on a new vendor plat<strong>for</strong>m. A copy of the existing productionenvironment was used. This can be referred to as the “to be” environment.§ <strong>Vblock</strong> System – the <strong>Vblock</strong> System used to measure per<strong>for</strong>mance against the Testenvironment at the customer site.© 2013 <strong>VCE</strong> Company, LLC. All Rights Reserved.12
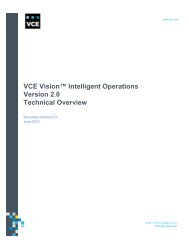
Testing methodology <strong>and</strong> resultsHP LoadRunner per<strong>for</strong>mance testing l<strong>and</strong>scapeThe LoadRunner environment was set up on the <strong>Vblock</strong> System providing direct access to the <strong>SAP</strong>application.Figure 2 shows the <strong>SAP</strong> PE2 l<strong>and</strong>scape on the <strong>Vblock</strong> System. According to the virtualizedapplication servers (also known as dialog instances), the number of servers, amount of memory, <strong>and</strong>number of processor cores assigned could vary from test run to test run. HP Per<strong>for</strong>mance Center <strong>and</strong>HP LoadRunner 9.5 tools were used to generate a load on the PE2 <strong>Vblock</strong> System. LoadRunner wasused to stress the PE2 <strong>Vblock</strong> System by executing OTC, RTC, <strong>and</strong> FICO business processes. Thistool was also used to per<strong>for</strong>m data analysis.Business processes (implemented as scripts) were created with the Virtual <strong>Use</strong>r Generator(LoadRunner scripting tool), which was later imported into the controller (Per<strong>for</strong>mance Center) toexecute the test scenario outlined during the planning phase of the project.Figure 2. LoadRunner l<strong>and</strong>scape <strong>for</strong> <strong>SAP</strong> on <strong>Vblock</strong> SystemNote: The above diagram shows the LoadRunner l<strong>and</strong>scape using two virtualized blade servers running 11virtual machines. Of these virtual machines, one was configured as Load Controller <strong>and</strong> 10 were used asLoad Generators.© 2013 <strong>VCE</strong> Company, LLC. All Rights Reserved.13
Testing overviewThe <strong>Vblock</strong> <strong>Solution</strong> <strong>for</strong> <strong>SAP</strong> described in this document consisted of a virtualized <strong>SAP</strong> instance ona <strong>Vblock</strong> System. A number of tests were per<strong>for</strong>med on the <strong>SAP</strong> database (<strong>SAP</strong> DB), centralinstance, <strong>and</strong> an application server configuration comparable to what would be seen in typicalproduction <strong>and</strong> test environments to demonstrate the significant per<strong>for</strong>mance improvements that canbe expected when running <strong>SAP</strong> on <strong>Vblock</strong> Systems. Per<strong>for</strong>mance results between a virtualized <strong>SAP</strong>on <strong>Vblock</strong> Systems <strong>and</strong> a non-virtualized <strong>SAP</strong> l<strong>and</strong>scape are detailed in this document. Per<strong>for</strong>mancetesting was compared with per<strong>for</strong>mance test results from a typical test environment.The following tests were per<strong>for</strong>med:§ <strong>SAP</strong> application server layer§ <strong>SAP</strong> application server sizing§ Online response times tests <strong>and</strong> batch throughput§ Stress tests using HP LoadRunner§ <strong>SAP</strong> batch <strong>and</strong> dialog load tests to test <strong>Vblock</strong> System capacity limits§ Server, storage, <strong>and</strong> network components§ Deployment <strong>and</strong> scaling of servers§ Dynamic resource allocation§ Migration of various componentsThe purpose of this testing was to demonstrate the following characteristics of <strong>SAP</strong> on <strong>Vblock</strong>Systems:§ Meets or exceeds existing physical environment per<strong>for</strong>mance using <strong>Vblock</strong> Systems§ Analysis of the key attributes of the per<strong>for</strong>mance pertaining to the <strong>Vblock</strong> System design§ Demonstrate the efficiency of resource provisioning on <strong>Vblock</strong> SystemsMethodologyOnly <strong>Vblock</strong> System <strong>and</strong> <strong>SAP</strong> st<strong>and</strong>ard procedures <strong>and</strong> methods were used to attain the benchmarkresults. The test results provided in this document were gathered using various systems <strong>and</strong>application administration tools. Testing experts compared the per<strong>for</strong>mance of the <strong>Vblock</strong> System withwhat would be seen in a traditional customer environment <strong>and</strong> divided the testing into two majorareas:§ Application (<strong>SAP</strong> environment)§ Data center operations (<strong>Vblock</strong> System) environments, listed below© 2013 <strong>VCE</strong> Company, LLC. All Rights Reserved.14
<strong>SAP</strong> environment per<strong>for</strong>mance testingThe <strong>SAP</strong> environment per<strong>for</strong>mance testing included two test cases:§ HP LoadRunner <strong>for</strong> interactive per<strong>for</strong>mance testingHP LoadRunner was used to simulate Online Dialog user load on the <strong>SAP</strong> environment <strong>and</strong>Average Transaction Response. Both were then measured <strong>for</strong> the duration of test§ Batch processingThe batch workload was reproduced, where possible. Additional batch <strong>and</strong> dialog instance loadtesting was conducted to significantly increase the workload on the system to identify capacitylimits. In addition to the analysis of the LoadRunner results, usage statistics were gathered at theinfrastructure levels during batch processing.Data center operations testingThe data center operation testing was limited to three major categories:§ Addition of resources to a running virtual <strong>SAP</strong> dialog instanceThe testing team demonstrated the ability to add resources, such as vCPU <strong>and</strong> vMemory, to arunning virtual <strong>SAP</strong> dialog instance. The team also successfully added vCPUs (up to eight) <strong>and</strong>memory (up to 80 GB RAM) to a <strong>SAP</strong> dialog instance running on a virtual machine. The additionof vCPUs <strong>and</strong> memory required a restart of the virtual machine. When the <strong>SAP</strong> dialog instancewas restarted, the additional vCPU <strong>and</strong> memory were immediately apparent (in <strong>SAP</strong> transactionOS06).§ Migration of service profilesThe testing team demonstrated <strong>and</strong> validated the nature of stateless computing on a <strong>Vblock</strong>System by migrating the <strong>Vblock</strong> System service profiles from one physical blade server toanother. The relevant use cases were:- Hardware migration- Hardware maintenance- Hardware upgrade- Recovery in the event of hardware failure§ Operational testingThe operation-level testing was completed to demonstrate the versatility of the <strong>Vblock</strong> System<strong>and</strong> summarize the flexibility <strong>and</strong> agility of <strong>Vblock</strong> Systems. These use cases included thefollowing operational tests:- Deployment <strong>and</strong> scaling of the <strong>SAP</strong> application- On-dem<strong>and</strong> provisioning of resources- Systems monitoring <strong>and</strong> management including patches <strong>and</strong> routine maintenance© 2013 <strong>VCE</strong> Company, LLC. All Rights Reserved.15
Infrastructure metricsPer<strong>for</strong>mance monitoring tools were an important part of the testing process; in both physical <strong>and</strong>virtualized environments these tools played a critical role. Resources such as database, CPU,memory, storage, I/O, <strong>and</strong> other components needed to be measured to ensure per<strong>for</strong>mancerequirements were met. For testing, the following per<strong>for</strong>mance monitoring tools were used to measureper<strong>for</strong>mance:ServerThe following per<strong>for</strong>mance monitoring tools were used during the RTC, OTC <strong>and</strong> FICO runs tomeasure database per<strong>for</strong>mance <strong>and</strong> CPU usage:§ Physical server – PerfMon:PerfMon is an SNMP-based per<strong>for</strong>mance tool that was used to measure database <strong>and</strong> CPUper<strong>for</strong>mance <strong>and</strong> usage while a series of <strong>SAP</strong> RTC, OTC, <strong>and</strong> FICO tests were executed on the<strong>Vblock</strong> System.§ Virtual server – VMware vCenter Per<strong>for</strong>mance Charts <strong>and</strong> ESXTOPThe per<strong>for</strong>mance counters maintained by vCenter <strong>and</strong> accessed via the vCenter client wereused to monitor the per<strong>for</strong>mance of the virtualized customer environment. Alternatively,VMware’s ESXTOP was executed on the ESXi server to provide realtime views of ESXi server<strong>and</strong> virtual machine per<strong>for</strong>mance.Storage I/OStorage <strong>and</strong> I/O per<strong>for</strong>mance were measured using the EMC Symmetrix VMAX STP tool. STP can beused as a workload analyzer to collect per<strong>for</strong>mance statistics on a Symmetrix VMAX storage array. Inthe case of this testing, STP was used to measure storage per<strong>for</strong>mance while RTC, OTC <strong>and</strong> FICOruns were executed on the <strong>Vblock</strong> System.VMware vCenterVMware vCenter was used to take advantage of the capability to view CPU, memory, disk, <strong>and</strong>network resources in a single per<strong>for</strong>mance chart, rather than having to navigate multiple charts.Specifically, these charts provided:§ Aggregated views <strong>and</strong> high-level summaries of resource distribution across the entireenvironment§ Thumbnail views of virtual machines, hosts, resource pools, clusters, <strong>and</strong> data stores§ Drill-down capability to per<strong>for</strong>m root cause analysis of problems§ Detailed storage views showing usage by file typeSolarWindsSolarWinds was used to measure network <strong>and</strong> fabric-level per<strong>for</strong>mance of the <strong>Vblock</strong> System.© 2013 <strong>VCE</strong> Company, LLC. All Rights Reserved.16
Per<strong>for</strong>mance comparison <strong>and</strong> usageThis section of the report contains a comparison of the per<strong>for</strong>mance <strong>and</strong> usage of infrastructureresources while the environment was subjected to three critical business processes:§ RTC§ OTC§ FICONote: The RTC, OTC, <strong>and</strong> FICO per<strong>for</strong>mance results were based on workload-generating scripts provided bythe customer to measure the business process per<strong>for</strong>mance of the <strong>Vblock</strong> System compared with thecustomer test environment.This section covers two major areas:§ A summary of the business process per<strong>for</strong>mance§ Details of the underlying resource usage from an infrastructure perspectiveThe following three tests were run on the <strong>Vblock</strong> System:§ RTC run§ OTC run with a 3x6 virtual machine configuration§ FICO run with a 3x6 virtual machine configurationFor each of the above runs, application, vSphere servers <strong>and</strong> storage-level per<strong>for</strong>mance comparisonswere per<strong>for</strong>med, along with resource usage.© 2013 <strong>VCE</strong> Company, LLC. All Rights Reserved.17
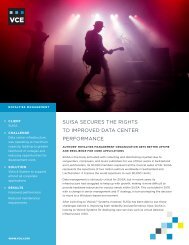
RTC runThe table below shows per<strong>for</strong>mance statistics.<strong>SAP</strong> RTC transactionsCustomersystem <strong>Vblock</strong> System Difference<strong>SAP</strong>GUI_IDOC_17_VAR1_RTC_EXECUTE 148.557 77.047 48%<strong>SAP</strong>GUI_IDOC_17_VAR2_RTC_EXECUTE 139.516 66.139 53%<strong>SAP</strong>GUI_IDOC_338_VAR1_RTC_EXECUTE 762.415 284.458 63%<strong>SAP</strong>GUI_IDOC_338_VAR2_EXECUTE 697.899 266.804 62%<strong>SAP</strong>GUI_MB51_RTC_EXECUTE 2.463 1.491 39%<strong>SAP</strong>GUI_ZPTR_MAIN_RTC_EXECUTE 0.534 0.297 44%<strong>SAP</strong>GUI_ZPTR_VAR1_RTC_EXECUTE 103.19 71.192 31%1854.574 767.428 59%Figure 3. Per<strong>for</strong>mance statisticsNote: The figure above shows the comparison of per<strong>for</strong>mance response time between the <strong>Vblock</strong> System <strong>and</strong>the customer’s test plat<strong>for</strong>m. <strong>Results</strong> show that the <strong>Vblock</strong> System was able to process seven businesscriticalRTC transactions with an improved average response time of 59%.© 2013 <strong>VCE</strong> Company, LLC. All Rights Reserved.18
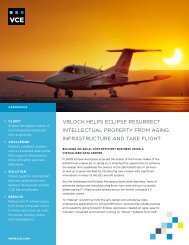
FICO runApplication per<strong>for</strong>mance comparisonThe table <strong>and</strong> Figure 4 illustrate the per<strong>for</strong>mance improvements seen when running <strong>SAP</strong> FICOtransactions in the <strong>Vblock</strong> System environment, as compared with the customer environment.<strong>SAP</strong> FICO transactionsCustomersystem <strong>Vblock</strong> System Difference<strong>SAP</strong>GUI_FAGLB03_FICO_EXECUTE 23.348 0.178 99%<strong>SAP</strong>GUI_FAGLL03_FICO_EXECUTE 292.46 172.764 41%<strong>SAP</strong>GUI_FBL1N_FICO_EXECUTE 14.132 7.694 46%<strong>SAP</strong>GUI_FBL5N_FICO_EXECUTE 103.185 45.744 56%<strong>SAP</strong>GUI_KE24_FICO_EXECUTE 20.555 9.611 53%<strong>SAP</strong>GUI_KE30_VAR1_FICO_EXECUTE 34.28 15.703 54%<strong>SAP</strong>GUI_KE30_VAR2_FICO_EXECUTE 423.162 133.011 69%<strong>SAP</strong>GUI_ZGRIRAGING_FICO_EXECUTE 1058.521 189.728 82%<strong>SAP</strong>GUI_ZPOACCRUAL_FICO_EXECUTE 1163.213 307.942 74%3132.856 882.375 72%Figure 4. <strong>SAP</strong> FICO transactions running on three virtual application servers© 2013 <strong>VCE</strong> Company, LLC. All Rights Reserved.19
Note: The figure above shows the comparison of per<strong>for</strong>mance response time between the <strong>Vblock</strong> System <strong>and</strong>the customer’s test plat<strong>for</strong>m. <strong>Results</strong> show that the <strong>Vblock</strong> System was able to process nine businesscriticalFICO transactions with an improved average response time of 72%.OTC runApplication per<strong>for</strong>mance comparisonThe table below <strong>and</strong> Figure 5 illustrate the per<strong>for</strong>mance improvements seen when running <strong>SAP</strong> OTCtransactions in the <strong>Vblock</strong> System, as compared with the customer environment.<strong>SAP</strong> OTC transactionsCustomersystem<strong>Vblock</strong>SystemDifference<strong>SAP</strong>GUI_VA41_OTC_DATA_EXECUTE 0.1 0.139 -39%<strong>SAP</strong>GUI_VKM1_VAR2_OTC_EXECUTE 59.298 21.447 64%<strong>SAP</strong>GUI_VKM1_VAR3_OTC_EXECUTE 51.823 19.315 63%<strong>SAP</strong>GUI_ZBACKORDER_VAR1_OTC_EXECUTE 0.288 0.1 65%<strong>SAP</strong>GUI_ZBACKORDER_VAR2_OTC_EXECUTE 0.414 0.1 76%<strong>SAP</strong>GUI_ZDLVSTATUS_OTC_EXECUTE 16.412 18.083 -10%<strong>SAP</strong>GUI_ZNOBACKORDER_OTC_EXECUTE 147.907 111.665 25%<strong>SAP</strong>GUI_ZVA14L_OTC_EXECUTE 8.472 1.083 87%<strong>SAP</strong>GUI_ZVASSUMM_VAR1_OTC_EXECUTE 26.027 11.733 55%<strong>SAP</strong>GUI_ZVASSUMM_VAR2_OTC_EXECUTE 1.538 0.497 68%<strong>SAP</strong>GUI_ZVENDORMARK_OTC_EXECUTE 2.68 0.906 66%<strong>SAP</strong>GUI_ZWORKLOAD_MAIN_EXECUTE 30.984 16.493 47%<strong>SAP</strong>GUI_ZWORKLOAD_VAR1_OTC_EXECUTE 34.455 15.443 55%<strong>SAP</strong>GUI_ZWORKLOAD_VAR2_OTC_EXECUTE 44.526 14.168 68%424.924 231.172 46%© 2013 <strong>VCE</strong> Company, LLC. All Rights Reserved.20
Figure 5. <strong>SAP</strong> OTC transactions running on three virtual appliccation serversNote: The figure above shows the comparison of per<strong>for</strong>mance response time between the <strong>Vblock</strong> System <strong>and</strong>the customer’s test plat<strong>for</strong>m. <strong>Results</strong> show that the <strong>Vblock</strong> System was able to process 14 businesscriticalOTC transactions with an improved average response time of 46%.Per<strong>for</strong>mance comparisonThe per<strong>for</strong>mance comparison was completed <strong>for</strong> application, vSphere server, <strong>and</strong> storagecomponents from the application per<strong>for</strong>mance availability <strong>and</strong> usage perspectives:Resource usageResource usage focus was on the <strong>Vblock</strong> System at the component level. The resource usage wascaptured to underst<strong>and</strong> the overall per<strong>for</strong>mance of the <strong>Vblock</strong> System from an infrastructureperspective, while running <strong>SAP</strong> as one of the solutions. The test team was interested in the use of thefollowing key components of the <strong>Vblock</strong> System while running <strong>SAP</strong>:§ Network§ Storage§ Servers§ CPU© 2013 <strong>VCE</strong> Company, LLC. All Rights Reserved.21
From the virtual machines perspective, the four application servers (4 x vCPU virtual machines) usedwere:§ <strong>SAP</strong>CL55§ <strong>SAP</strong>CL53§ <strong>SAP</strong>CL54§ <strong>SAP</strong>CL59Per<strong>for</strong>mance analysis <strong>and</strong> key contributorsThe significant per<strong>for</strong>mance metrics <strong>and</strong> measurements described in the previous section can berealized due to a number of improvements in storage <strong>and</strong> application layout, network optimization,<strong>and</strong> inherent advantages of the <strong>Vblock</strong> System, with its optimized multi-application compute system.The following key factors contributed to the superior per<strong>for</strong>mance improvements observed in the testresults provided in this configuration report.Processor architecture <strong>and</strong> configurationThe Xeon 5570 processor was shown in testing to exceed the per<strong>for</strong>mance of the Opteron processorin server benchmark testing (1.6 times faster); while the Xeon 5680 (used in these tests) wasobserved to far exceed the 5570’s per<strong>for</strong>mance by an additional 43%, leading the combination of theXeon 5680 <strong>and</strong> UCS B250 server to vastly outper<strong>for</strong>m Opteron-based HP servers.Figure 6. Cisco UCS B250 M2 per<strong>for</strong>mance© 2013 <strong>VCE</strong> Company, LLC. All Rights Reserved.22
UCS integrated <strong>and</strong> converged fabric configurationOne of the key factors in underst<strong>and</strong>ing how these per<strong>for</strong>mance results exceeded expected results isin the UCS blade configuration. Because the <strong>SAP</strong> layout enables the database server (physical), allapplication servers (virtual), <strong>and</strong> LoadRunner clients (virtual) to reside on a single chassis connectedto a set of 6120 Fabric Interconnects, the majority of <strong>SAP</strong> traffic remains internal, thus takingadvantage of the large amount of b<strong>and</strong>width available.Virtual application server dynamic per<strong>for</strong>mance tuningApplication server virtual machines in the <strong>Vblock</strong> System were sized <strong>and</strong> numbered to approximatelymatch the <strong>SAP</strong>S capacity of the TE2 application tier, which was 3 x 8,775 (approximately 26,325)<strong>SAP</strong>S.In vSphere, four- way application servers are a “sweet spot” <strong>and</strong> the <strong>SAP</strong>S rating of a four-way virtualmachine is estimated to be 6,250. Based on 6,250 <strong>SAP</strong>S per four-way virtual machine, fourapplication servers were required to approximately match the TE2 application tier rating. After initialtesting with a 4 x 4 application server virtual machines configuration, an uneven distribution in theCPU usage was observed, whereby 1-2 of the virtual machines were at 100% CPU usage, while theremaining virtual machines were relatively underused. This was attributed to imperfect load balancingof the virtual users as they were ramped up by LoadRunner.To more evenly distribute CPU usage across the application tier <strong>and</strong> prevent a virtual machine fromspiking to 100%, the number of virtual machines was reduced <strong>and</strong> then made larger in size. The nextsizing configuration to reflect this <strong>and</strong> also roughly match the TE2 application tier <strong>SAP</strong>S rating was 3 x6-way virtual machines. The <strong>SAP</strong>S rating of a 6-way virtual machines configuration is approximatelybetween 8,000 <strong>and</strong> 9,000 <strong>SAP</strong>S (estimated from 4- <strong>and</strong> 8-way benchmark certifications 2009028 <strong>and</strong>2009029, which shows approximately linear scalability).Optimization <strong>and</strong> balancing of compute, network, <strong>and</strong> storage throughout the <strong>Vblock</strong> SystemPer<strong>for</strong>mance testing showed that less than 25% of cache, disk, <strong>and</strong> front-end <strong>and</strong> back-end portswere used. The Symmetrix VMAX storage array can h<strong>and</strong>le much larger workloads, thus validating akey design point of optimization <strong>and</strong> balancing of compute, network <strong>and</strong> storage throughout the<strong>Vblock</strong> System. In this example, a <strong>Vblock</strong> System 700 minimum configuration was designed with fourUCS chassis with corresponding network <strong>and</strong> storage capacity. The customer test bed consumes oneUCS chassis, <strong>and</strong> thus less than 25% of storage resources.© 2013 <strong>VCE</strong> Company, LLC. All Rights Reserved.23
<strong>SAP</strong> on <strong>Vblock</strong> System use casesThis paper provides the following use case descriptions:§ Deployment <strong>and</strong> scaling of servers [vCPU, vMemory]§ <strong>SAP</strong> recovery using EMC RecoverPoint continuous remote replication (CRR)§ Stateless computing : Migration of <strong>Vblock</strong> System service profiles§ Dynamic on-dem<strong>and</strong> provisioningDeployment <strong>and</strong> scaling of servers (vCPU, vMemory)The testing team demonstrated the ability to add resources, such as vCPU <strong>and</strong> vMemory, to a runningvirtual <strong>SAP</strong> dialog instance.The team successfully added vCPUs (up to eight) <strong>and</strong> memory (up to 80 GB RAM) to an <strong>SAP</strong> dialoginstance running on a virtual machine. The addition of vCPUs <strong>and</strong> memory required restarting thevirtual machine. Once the <strong>SAP</strong> dialog instance was restarted, the additional vCPU <strong>and</strong> memory wereimmediately apparent (in <strong>SAP</strong> transaction OS06).Application server virtual machines in the <strong>Vblock</strong> System were sized <strong>and</strong> numbered to approximatelymatch the <strong>SAP</strong>S capacity of the customer. The TE2 application tier was 3 x 8,775 (approximately26,325) <strong>SAP</strong>S. When using vSphere, four-way application servers were considered to be the sweetspot: The <strong>SAP</strong>S rating of a four-way virtual machine is estimated at 6,250 (source: SD benchmarkcertification 2009028). Based on 6,250 <strong>SAP</strong>S per four-way virtual machine, the team required four ofthese to approximately match the TE2 application tier rating. After initial testing with 4 x 4 applicationserver virtual machines, the team observed an uneven distribution in the CPU usage where one ortwo of the machines were at 100% vCPU while the remaining were relatively underused. The teamattributed this to imperfect load balancing of the virtual users by LoadRunner.To distribute vCPU usage more evenly across the application tier, <strong>and</strong> also to prevent any virtualmachine from spiking to 100%, the team reduced the number of virtual machines but made themlarger. The next appropriate sizing configuration (which also approximates the TE2 application tier<strong>SAP</strong>S rating) was 3 x 6-way virtual machines. The <strong>SAP</strong>S rating of a 6-way virtual machine wasapproximately between 8,000 <strong>and</strong> 9,000 <strong>SAP</strong>S (estimated from 4- <strong>and</strong> 8-way benchmark certifications2009028 <strong>and</strong> 2009029, which show approximately linear scalability).The following data was obtained from ESXTOP, with the data captured as a batch file <strong>and</strong> viewed inESXplot (freeware from www.virtualizetips.com/2010/03/how-to-use-esxplot-to-read-your-esxtopreports/).The metric shown below is the percentage (%) used of the virtual machine. As each virtualmachine is 4 x vCPU, the percentage used needs to be divided by 4 (see the following link <strong>for</strong>explanation http://communities.vmware.com/docs/DOC-9279, section “%USED”).© 2013 <strong>VCE</strong> Company, LLC. All Rights Reserved.24
Figure 7. <strong>SAP</strong>CL55 application server virtual machine per<strong>for</strong>mance (CPU %used)© 2013 <strong>VCE</strong> Company, LLC. All Rights Reserved.25
Figure 8. <strong>SAP</strong>CL53 application server virtual machine per<strong>for</strong>mance (CPU% used)© 2013 <strong>VCE</strong> Company, LLC. All Rights Reserved.26
Figure 9. <strong>SAP</strong>CL54 application server virtual machine per<strong>for</strong>mance (CPU% used)© 2013 <strong>VCE</strong> Company, LLC. All Rights Reserved.27
Figure 10. <strong>SAP</strong>CL59 application server virtual machine per<strong>for</strong>mance (CPU% used)© 2013 <strong>VCE</strong> Company, LLC. All Rights Reserved.28
<strong>SAP</strong> recovery using EMC RecoverPoint CRRIf you need to install a software update, apply a patch, or per<strong>for</strong>m testing on your <strong>SAP</strong> productiondata, you should capture a “point in time” when you know that the data is accurate using EMCRecoverPoint, which allows continuous data protection, either locally or remotely through the use ofbookmarks.EMC RecoverPoint continuous data protection technology allows you to per<strong>for</strong>m the following actionsin an <strong>SAP</strong> environment:§ Provide local protection (CDP)§ Provide remote replication (CRR)§ Provide protection <strong>for</strong> any point in time§ Present any point in time to another host in the <strong>SAP</strong> environmentFor this testing, RecoverPoint CRR was set up in a heterogeneous storage environment. Replicationwas per<strong>for</strong>med from a <strong>Vblock</strong> System 700 to a <strong>Vblock</strong> 1, <strong>and</strong> the configuration used array-basedsplitter technology on the CLARiiON storage of the <strong>Vblock</strong> System <strong>and</strong> SANTap-based splittertechnology on the VMAX storage of the <strong>Vblock</strong> System 700. Heterogeneous replication was thenper<strong>for</strong>med on the boot LUN <strong>and</strong> remaining <strong>SAP</strong> LUNs.The boot LUN was replicated from the primary UCS to the disaster recovery (DR) UCS. The systemwas fully booted at the disaster recovery site without affecting the primary (production) site, as shownin Figure 11.Figure 11. Customer <strong>SAP</strong> Boot running on RPA 1© 2013 <strong>VCE</strong> Company, LLC. All Rights Reserved.29
Per<strong>for</strong>ming recovery using RecoverPoint bookmarksYou can view <strong>and</strong> manage your <strong>SAP</strong> environment through the RecoverPoint GUI, <strong>and</strong> protect theenvironment based on individual LUNs or groups of LUNs. Using RecoverPoint bookmarks, you cancreate reference points in the indefinitely granular l<strong>and</strong>scape of point-in-time protection, which you canuse to per<strong>for</strong>m a production rollback, if necessary.Creating a RecoverPoint bookmark1. In the RecoverPoint GUI, click the Bookmark link. The Create a bookmark image <strong>for</strong> <strong>SAP</strong><strong>Solution</strong>s Manager page appears.2. Enter a name <strong>for</strong> the bookmark in the Bookmark Name field <strong>and</strong> click OK.To enable image access:1. In the Recovery GUI, click the arrow icon <strong>and</strong> select Enable Image Access on the recovery host.An Enable Image Access wizard appears, which allows you to transfer this bookmark image tothe recovery server.2. Select one of the following options to enable image access:a. Select the latest image, which selects the latest image savedb. Select an image from the list, which allows you to select from a list of saved imagesc. Specify a desired point in time, which allows you to select a specific point in time3. Select Groups from the RecoverPoint GUI menu <strong>and</strong> select Group Sets. This then allows you tocreate a new consistency group.Creating a new consistency group1. Click Create. A Group Set dialog appears.2. Select the consistency groups you want to group together <strong>for</strong> the new consistency group.3. Enter a name <strong>for</strong> the <strong>SAP</strong> consistency group <strong>and</strong> click OK.4. Select the frequency you want to use <strong>for</strong> bookmarks. Setting the frequency controls how oftenbookmarks will be created across your consistency groups <strong>and</strong> allows you to have granularity toroll back just one at a time, or present only one bookmark to the recovery server while stillmaintaining a common point in time across all three consistency groups in your <strong>SAP</strong> environment.© 2013 <strong>VCE</strong> Company, LLC. All Rights Reserved.30
Creating a suspend stateTo bring up consistency groups simultaneously, you need to put the production environment into aSuspend state to ensure there are no IP address conflicts. To put an <strong>SAP</strong> virtual machine in Suspendstate:1. In the RecoverPoint GUI, right-click <strong>SAP</strong> <strong>Solution</strong> Manager <strong>and</strong> select Suspend. The ConfirmSuspend dialog prompt appears.2. Click Yes to suspend the virtual machine.3. Once you initiate the Suspend state, you can enable access to the <strong>SAP</strong> bookmark that youcreated earlier. If there is data corruption or data integrity loss, this bookmark allows you to rollyour production data back to the point-in-time of the bookmark.4. Enable image access to the bookmark by selecting the Image Access icon <strong>and</strong> clicking EnableImage Access. The Enable Image Access window appears.5. Click Select image from the list <strong>and</strong> browse to the <strong>SAP</strong> Patch Installation bookmark.6. Click Next. The Image Access Mode window appears.7. Click Image Access Mode. There are two options <strong>for</strong> this selection: logged access <strong>and</strong> virtualaccess.a. Logged access takes the point-in-time <strong>and</strong> copies the data to the target LUNs.b. Virtual access allows <strong>for</strong> immediate access to the data through memory mappingtechnologies. You can also select the Roll image in background checkbox to also copy thedata to the target LUNs.Starting the virtual machineYou can also start the virtual machine to verify everything is operating properly by per<strong>for</strong>ming thefollowing steps:1. Verify that the <strong>SAP</strong> services are running in <strong>SAP</strong> <strong>Solution</strong>s Manager.2. On the desktop <strong>for</strong> the virtual machine, click the <strong>SAP</strong> Logon icon to log in to <strong>SAP</strong>.3. In the <strong>SAP</strong> Logon window, select <strong>Solution</strong> Manager to ensure that <strong>SAP</strong> is running properly.4. Return to the RecoverPoint GUI. Notice that there is a Recovery Options icon on the right thatallows you to select either of the following options:a. Failover to Recoveryb. Recover Production© 2013 <strong>VCE</strong> Company, LLC. All Rights Reserved.31
Stateless computingIn the <strong>Vblock</strong> System, <strong>SAP</strong> instances can be seamlessly migrated between UCS blades usingVMware’s vMotion technology. Moving <strong>SAP</strong> instances between blades allows administrators toschedule maintenance (<strong>for</strong> example, installing a <strong>SAP</strong> kernel update, OS updates or patches, or adatabase update/patch) on a blade while maintaining minimal production downtime. Redundancy canalso be enabled through the migration of <strong>SAP</strong> instances; ensuring that <strong>SAP</strong> production data is not lostin case of blade failure.Be<strong>for</strong>e moving a <strong>SAP</strong> instance from one blade to another, ensure that the following conditions aremet:§ <strong>SAP</strong> is running on a virtual machine on an ESXi Server.§ Both ESXi Servers:- Have compatible CPUs.- Are connected to a virtual switch assigned <strong>for</strong> vMotion.- Are connected to a production switch enabled <strong>for</strong> user access.§ <strong>SAP</strong> virtual disk <strong>and</strong> VMFS configuration files reside on shared storage connected to both ESXihosts.Moving a <strong>SAP</strong> instance from one UCS blade to another1. Open the Virtual Infrastructure Client application <strong>and</strong> locate the <strong>SAP</strong> instance you want to move(<strong>for</strong> example, sap_vm).2. Right-click the <strong>SAP</strong> instance <strong>and</strong> click Migrate. A list of destination hosts is displayed where youcan move the <strong>SAP</strong> instance.3. Select the host you want to use to move the <strong>SAP</strong> instance <strong>and</strong> click Next. A Resource Poolspage is shown.4. Select the resource pool you want to use <strong>and</strong> click Next. A Migration Policy page appears.5. Choose the priority of the migration. There are two options:a. High Priority - ensures virtual machine availability during migration by reserving resourceson both source <strong>and</strong> destination hosts.b. Low Priority - resources are NOT reserved; thus, the virtual machine may becomeunavailable during migration.6. Click Next. A Summary page is displayed. Verify that the in<strong>for</strong>mation is correct <strong>and</strong> click Finish.The progress of the migration is shown in the Virtual Infrastructure Client window (bottompane).7. After the migration completes, verify that the <strong>SAP</strong> instance is running on the destination host.© 2013 <strong>VCE</strong> Company, LLC. All Rights Reserved.32
Dynamic on-dem<strong>and</strong> provisioningProvisioning new <strong>SAP</strong> servers on the <strong>Vblock</strong> System can be simplified through the use of automation.Using customized scripts <strong>and</strong> UIM, <strong>SAP</strong> servers can be more easily managed <strong>and</strong> provisionedwithout requiring significant configuration <strong>and</strong> setup steps. This approach can be particularly useful <strong>for</strong>service providers where a rapid, error-free, <strong>and</strong> st<strong>and</strong>ardized approach is required.© 2013 <strong>VCE</strong> Company, LLC. All Rights Reserved.33
ConclusionThis paper demonstrates the operational <strong>and</strong> per<strong>for</strong>mance improvements that can be realized whendeploying <strong>SAP</strong> on a <strong>Vblock</strong> System in a large-scale production environment. The testingdemonstrates that an <strong>SAP</strong> instance can be rapidly configured <strong>and</strong> deployed, unlike physical servers<strong>and</strong> databases, which are hampered by limitations of capacity, storage, <strong>and</strong> compute resources. Thetest team was able to configure <strong>and</strong> deploy <strong>Vblock</strong> System storage, compute, <strong>and</strong> virtualizationcapabilities with advanced system administration technologies. Various infrastructure changes wererequired throughout this exercise, allowing administrators <strong>and</strong> architects to dynamically adjustcapacity, storage, <strong>and</strong> processing capabilities. Some of these benefits are documented in the usecases.The <strong>SAP</strong> on <strong>Vblock</strong> Systems defined in this document was designed to mirror a retail customer’sexisting production <strong>and</strong> test environments to illustrate the significant per<strong>for</strong>mance improvementsobserved when <strong>SAP</strong> was deployed on the <strong>Vblock</strong> System. A series of customer-provided dialog <strong>and</strong>batch workload-generating scripts (RTC, OTC, <strong>and</strong> FICO) runs were per<strong>for</strong>med. Per<strong>for</strong>mancestatistics were collected <strong>and</strong> results analyzed that provided a compelling comparison against resultsseen in a customer’s non-optimized environment.The per<strong>for</strong>mance metrics <strong>and</strong> measurements contained in this report were achieved due to a numberof storage optimizations <strong>and</strong> application layout, network, <strong>and</strong> inherent advantages of the <strong>Vblock</strong>System, with its optimized multi-application compute system. Within the test <strong>Vblock</strong> System, one UCSchassis (8 blades) was comparable to the customer’s entire <strong>SAP</strong> production farm, <strong>and</strong> averaged aper<strong>for</strong>mance improvement of 50%.© 2013 <strong>VCE</strong> Company, LLC. All Rights Reserved.34
Appendix A: Per<strong>for</strong>mance <strong>and</strong> comparison resultsRTC runThe team chose to cover RTC to explain the rationale behind the better per<strong>for</strong>mance <strong>and</strong> efficientresource usage of <strong>SAP</strong> on a <strong>Vblock</strong> System.Application per<strong>for</strong>manceFrom an application per<strong>for</strong>mance perspective, RTC was run with in 4x4 virtual server layers <strong>and</strong>contained four application servers, each configured with 4 vCPU.RTC run 4x4The following table shows the per<strong>for</strong>mance difference between <strong>SAP</strong> within the customer environment<strong>and</strong> <strong>SAP</strong> on <strong>Vblock</strong> Systems while running identical RTC scripts through HP LoadRunner. <strong>SAP</strong> on the<strong>Vblock</strong> System per<strong>for</strong>med 59% better. The per<strong>for</strong>mance statistics are presented in the following table<strong>and</strong> Figure 12.<strong>SAP</strong> RTC transactionsCustomer system<strong>Vblock</strong>SystemDifference<strong>SAP</strong>GUI_IDOC_17_VAR1_RTC_EXECUTE 148.557 77.047 48%<strong>SAP</strong>GUI_IDOC_17_VAR2_RTC_EXECUTE 139.516 66.139 53%<strong>SAP</strong>GUI_IDOC_338_VAR1_RTC_EXECUTE 762.415 284.458 63%<strong>SAP</strong>GUI_IDOC_338_VAR2_EXECUTE 697.899 266.804 62%<strong>SAP</strong>GUI_MB51_RTC_EXECUTE 2.463 1.491 39%<strong>SAP</strong>GUI_ZPTR_MAIN_RTC_EXECUTE 0.534 0.297 44%<strong>SAP</strong>GUI_ZPTR_VAR1_RTC_EXECUTE 103.19 71.192 31%1854.574 767.428 59%© 2013 <strong>VCE</strong> Company, LLC. All Rights Reserved.35
Figure 12. RTC per<strong>for</strong>mance statisticsNote: The figure above shows the comparison of response times between the <strong>Vblock</strong> System <strong>and</strong> thecustomer’s test plat<strong>for</strong>m. <strong>Results</strong> show that the <strong>Vblock</strong> System was able to process seven business criticalRTC batch jobs with an improved average response time of 59%.Resource usageAs shown above, the RTC run was 59% better; however, resource level usage has been remarkablybetter. While there was no benchmark or comparison data available from the customer, it can bestated that a duplicate customer <strong>SAP</strong> implementation could be run. This fact is clear based on <strong>Vblock</strong>System resource usage.Network usageIn a distributed environment, the major bottleneck among application, database, <strong>and</strong> client is oftendetermined to be the network. In the <strong>Vblock</strong> System, all <strong>SAP</strong> environment components reside in thesame box, creating a “super-highway” of sorts that allows each component to communicate moreefficiently.© 2013 <strong>VCE</strong> Company, LLC. All Rights Reserved.36
I/O usageFigures 13 <strong>and</strong> 14 show the I/O usage <strong>for</strong> the two fibre channel connections (fc2/1 <strong>and</strong> fc2/2) from the6120 Fabric Interconnect connected to the MDS, which connects to the Symmetrix VMAX storagearray. Each fibre channel interface is capable of h<strong>and</strong>ling up to 4 Gbps of throughput. For this run,each interface is only using approximately 25 Mbps <strong>and</strong> 30 Mbps at peak intervals during the initialramp-up of the LR run. There is plenty of link capacity to spare as the usage is under 10% used attheir highest point.FCoE usage from chassis to fabric interconnect was also observed during the RTC run <strong>and</strong> isillustrated in the charts displayed below.Figure 13. I/O usage <strong>for</strong> fabric interconnect interfaces to MDS <strong>for</strong> fc2/1© 2013 <strong>VCE</strong> Company, LLC. All Rights Reserved.37
Figure 14. I/O usage <strong>for</strong> fabric interconnect interfaces to MDS <strong>for</strong> fc2/2FCoE usageFigures 15 <strong>and</strong> 16 show the aggregate FCoE usage <strong>for</strong> the two most highly used FCoE 10 Gbpsinterfaces (eth1/1 <strong>and</strong> eth1/6) from the 6120 Fabric Interconnect connected southbound to the I/Omodules <strong>for</strong> each server in the UCS chassis. For this RTC run, each interface is only usingapproximately 25 Mbps <strong>and</strong> 40 Mbps at peak intervals during the initial ramp up of the LR run, thus,as can be seen, there is plenty of link capacity to spare as the usage is under 10% used at theirhighest point.© 2013 <strong>VCE</strong> Company, LLC. All Rights Reserved.38
Figure 15. FCoE usage from chassis to fabric interconnect <strong>for</strong> eth1/1Figure 16. FCoE usage from chassis to fabric interconnect <strong>for</strong> eth1/6© 2013 <strong>VCE</strong> Company, LLC. All Rights Reserved.39
CPU/vCPUThe vCPU per<strong>for</strong>mance is shown in Figure 17 using st<strong>and</strong>ard server per<strong>for</strong>mance monitoring tools (inthis case, PerfMon). The relationship between the vCPU <strong>and</strong> raw CPU can be understood by viewingthe raw per<strong>for</strong>mance <strong>and</strong> relating this per<strong>for</strong>mance to the virtual machine CPU allocations. The testteam did not observe a pegged vCPU; hence, the raw CPU statistics were not collected. The onlysituation in which CPU was pegged happened because unified load distribution was not enabledwithin the application layer.Figure 17 shows vCPU per<strong>for</strong>mance <strong>and</strong> Figure 18 shows the physical CPU per<strong>for</strong>mance. In the caseof a virtual machine with four CPUs, the y axis must be divided by 4 to underst<strong>and</strong> the per<strong>for</strong>mance ofeach vCPU.Note: During the RTC run, the database server CPU usage is measured as a percentage, based on the verticalaxis numbers, thus indicating that the B250 M2 database server can h<strong>and</strong>le a much more stringent load.Figure 17. vCPU per<strong>for</strong>mance© 2013 <strong>VCE</strong> Company, LLC. All Rights Reserved.40
Figure 18. <strong>SAP</strong>50 database server per<strong>for</strong>mance (CPU)StorageThere are four key metrics on a storage array that are of interest.§ Front-end fibre channel ports/CPU§ Cache (memory slots)§ Back-end directors CPU§ Disks (fibre channel)© 2013 <strong>VCE</strong> Company, LLC. All Rights Reserved.41
Figure 19. Front-end fibre channel ports/CPUNote: The <strong>SAP</strong> front-end fibre channel ports were less than 15% used (max) <strong>for</strong> the RTC run.© 2013 <strong>VCE</strong> Company, LLC. All Rights Reserved.42
Figure 20. Cache (memory slots)Note: Write pending count is data that is in a cache slot waiting to be written to disk. In this example, <strong>for</strong> the RTCrun, the write pending count (approx. 30,000) is much less than the write pending limits (650,000).© 2013 <strong>VCE</strong> Company, LLC. All Rights Reserved.43
Figure 21. Back end directors CPUNote: Back end directors were less than 20% used. These are the CPUs of the storage array that move the datafrom memory slots to disks.© 2013 <strong>VCE</strong> Company, LLC. All Rights Reserved.44
Figure 22. Disks (fibre channel)Note: This bar graph shows that although the disks percentage (%) max was used, the cache was under-used.There was no impact on the host, <strong>and</strong> host write response time was at memory speeds; not disk speeds.© 2013 <strong>VCE</strong> Company, LLC. All Rights Reserved.45
FICO runApplication per<strong>for</strong>mance comparisonThe following table <strong>and</strong> Figure 23 illustrate the per<strong>for</strong>mance improvements seen when running <strong>SAP</strong>FICO transactions in the <strong>Vblock</strong> System, as compared with the customer environment.<strong>SAP</strong> FICO transactions Customer system <strong>Vblock</strong> System Difference<strong>SAP</strong>GUI_FAGLB03_FICO_EXECUTE 23.348 0.178 99%<strong>SAP</strong>GUI_FAGLL03_FICO_EXECUTE 292.46 172.764 41%<strong>SAP</strong>GUI_FBL1N_FICO_EXECUTE 14.132 7.694 46%<strong>SAP</strong>GUI_FBL5N_FICO_EXECUTE 103.185 45.744 56%<strong>SAP</strong>GUI_KE24_FICO_EXECUTE 20.555 9.611 53%<strong>SAP</strong>GUI_KE30_VAR1_FICO_EXECUTE 34.28 15.703 54%<strong>SAP</strong>GUI_KE30_VAR2_FICO_EXECUTE 423.162 133.011 69%<strong>SAP</strong>GUI_ZGRIRAGING_FICO_EXECUTE 1058.521 189.728 82%<strong>SAP</strong>GUI_ZPOACCRUAL_FICO_EXECUTE 1163.213 307.942 74%3132.856 882.375 72%Figure 23. <strong>SAP</strong> FICO transactions running on three virtual application servers© 2013 <strong>VCE</strong> Company, LLC. All Rights Reserved.46
Note: The figure above shows the comparison of response time between the <strong>Vblock</strong> System <strong>and</strong> the customer’stest plat<strong>for</strong>m. <strong>Results</strong> show that the <strong>Vblock</strong> System was able to process nine business-critical FICOtransactions with an improved average response time of 72%.Resource usage <strong>for</strong> I/OFigures 24 <strong>and</strong> 25 show the I/O usage <strong>for</strong> the two Fiber Channel connections (fc2/1 <strong>and</strong> fc2/2) fromthe 6120 Fabric Interconnect connected to the MDS, which connects to the Symmetrix VMAX storagearray. Each fibre channel interface is capable of h<strong>and</strong>ling up to 4 Gbps of throughput. As you can see,<strong>for</strong> this FICO run, each interface is only using approximately 90 Mbps <strong>and</strong> 380 Mbps at peak intervalsduring the initial ramp-up of the LR run, leaving plenty of link capacity to spare as the usage is under10% used at their highest point.Figure 24. I/O usage <strong>for</strong> Fabric Interconnect interfaces to MDS <strong>for</strong> fc2/1© 2013 <strong>VCE</strong> Company, LLC. All Rights Reserved.47
Figure 25. I/O usage <strong>for</strong> Fabric Interconnect interfaces to MDS <strong>for</strong> fc2/2Resource usage <strong>for</strong> FCoEFigures 26 <strong>and</strong> 27 show the aggregate FCoE usage <strong>for</strong> the two most highly used FCoE 10 Gbpsinterfaces (eth1/1 <strong>and</strong> eth1/6) from the 6120 Fabric Interconnect connected southbound to the I/Omodules <strong>for</strong> each server in the UCS chassis. For this FICO run, each interface is only usingapproximately 25 Mbps <strong>and</strong> 40 Mbps at peak intervals during the initial ramp-up of the LR run, thus,as can be seen, there is plenty of link capacity to spare, as the usage is under 10% used at theirhighest point.© 2013 <strong>VCE</strong> Company, LLC. All Rights Reserved.48
Figure 26. FCoE usage from chassis to Fabric Interconnect <strong>for</strong> eth1/1Figure 27. FCoE usage from chassis to Fabric Interconnect <strong>for</strong> eth1/8© 2013 <strong>VCE</strong> Company, LLC. All Rights Reserved.49
CPUIn Figure 28, the maximum CPU usage on App Server <strong>SAP</strong>CL53 on a <strong>Vblock</strong> System during theFICO run was measured at 27.02 % during a 2-hour period.Figure 28. CPU per<strong>for</strong>manceDatabase per<strong>for</strong>mance was also measured using PerfMon to show the minimal impact on databaseper<strong>for</strong>mance <strong>and</strong> usage while FICO tests were being run. Notice in Figure 29 how the maximumresource usage of the database was only 28.33 % at its peak.© 2013 <strong>VCE</strong> Company, LLC. All Rights Reserved.50
Figure 29. Database per<strong>for</strong>manceStorageThere are four key metrics on a storage array that are of interest:§ Front-end (FE) fibre channel ports/CPU§ Cache (memory slots)§ Back-end directors CPU§ Disks (fibre channel)© 2013 <strong>VCE</strong> Company, LLC. All Rights Reserved.51
Figure 30. Front end fibre channel ports/CPUNote: The FICO run was the heaviest workload of the three runs. The directors were 65% used.Figure 31. Cache (memory slots)© 2013 <strong>VCE</strong> Company, LLC. All Rights Reserved.52
Note: Write pending count is data that is in a cache slot waiting to be written to disk. In this example, <strong>for</strong> theFICO run, the write pending count (approximately 11,000) is much less than the write pending limit(650,000).Figure 32. Back-end directors CPUNote: Back-end directors percentage was less than 15% usage. These are the CPUs of the storage array thatmove the data from memory slots to disks.© 2013 <strong>VCE</strong> Company, LLC. All Rights Reserved.53
Figure 33. Disks (fibre channel)Note: This bar graph shows that although the disk’s percentage (%) max was used, the cache was under-used.There was no impact on the host, <strong>and</strong> host write response time was at memory speeds; not disk speeds.In fact, the disk use percentage was less than 70%.© 2013 <strong>VCE</strong> Company, LLC. All Rights Reserved.54
OTC runApplication per<strong>for</strong>mance comparisonThe following table <strong>and</strong> Figure 34 illustrate the per<strong>for</strong>mance improvements seen when running <strong>SAP</strong>OTC transactions in the <strong>Vblock</strong> System, as compared with the customer environment.<strong>SAP</strong> OTC transactionsCustomersystem<strong>Vblock</strong>SystemDifference<strong>SAP</strong>GUI_VA41_OTC_DATA_EXECUTE 0.1 0.139 -39%<strong>SAP</strong>GUI_VKM1_VAR2_OTC_EXECUTE 59.298 21.447 64%<strong>SAP</strong>GUI_VKM1_VAR3_OTC_EXECUTE 51.823 19.315 63%<strong>SAP</strong>GUI_ZBACKORDER_VAR1_OTC_EXECUTE 0.288 0.1 65%<strong>SAP</strong>GUI_ZBACKORDER_VAR2_OTC_EXECUTE 0.414 0.1 76%<strong>SAP</strong>GUI_ZDLVSTATUS_OTC_EXECUTE 16.412 18.083 -10%<strong>SAP</strong>GUI_ZNOBACKORDER_OTC_EXECUTE 147.907 111.665 25%<strong>SAP</strong>GUI_ZVA14L_OTC_EXECUTE 8.472 1.083 87%<strong>SAP</strong>GUI_ZVASSUMM_VAR1_OTC_EXECUTE 26.027 11.733 55%<strong>SAP</strong>GUI_ZVASSUMM_VAR2_OTC_EXECUTE 1.538 0.497 68%<strong>SAP</strong>GUI_ZVENDORMARK_OTC_EXECUTE 2.68 0.906 66%<strong>SAP</strong>GUI_ZWORKLOAD_MAIN_EXECUTE 30.984 16.493 47%<strong>SAP</strong>GUI_ZWORKLOAD_VAR1_OTC_EXECUTE 34.455 15.443 55%<strong>SAP</strong>GUI_ZWORKLOAD_VAR2_OTC_EXECUTE 44.526 14.168 68%424.924 231.172 46%© 2013 <strong>VCE</strong> Company, LLC. All Rights Reserved.55
Figure 34. <strong>SAP</strong> OTC transactions running on three virtual application serversNote: The figure above shows the comparison of response time between the <strong>Vblock</strong> System <strong>and</strong> the customer’stest plat<strong>for</strong>m. <strong>Results</strong> show that the <strong>Vblock</strong> System was able to process 14 business-critical OTCtransactions with an improved average response time of 46%.I/O resource usageFigures 35 <strong>and</strong> 36 show the I/O usage <strong>for</strong> the two fibre channel connections (fc2/1 <strong>and</strong> fc2/2) from the6120 Fabric Interconnect connected to the MDS, which connects to the Symmetrix VMAX storagearray. Each fibre channel interface is capable of h<strong>and</strong>ling up to 4Gbps of throughput. As can be seenin the graphs, <strong>for</strong> this OTC run, each interface is only using approximately 8Mbps <strong>and</strong> 10Mbps at aconsistent level during the LR run, leading to plenty of link capacity to spare, as the usage is under10%.© 2013 <strong>VCE</strong> Company, LLC. All Rights Reserved.56
Figure 35. I/O usage <strong>for</strong> fabric interconnect interfaces to MDS on fc2/1Figure 36. I/O usage <strong>for</strong> fabric interconnect interfaces to MDS on fc2/2© 2013 <strong>VCE</strong> Company, LLC. All Rights Reserved.57
FCoE resource usageFigures 37 <strong>and</strong> 38 show the aggregate FCoE usage <strong>for</strong> the two most highly used FCoE 10Gbpsinterfaces (eth1/1 <strong>and</strong> eth1/8) from the 6120 Fabric Interconnect connected southbound to the I/Omodules <strong>for</strong> each server in the UCS chassis. As can be seen in these graphs, <strong>for</strong> this FICO run, eachinterface is only using approximately 5-6Mbps at sustained levels during the LR run, leaving plenty oflink capacity to spare, as the usage is under 10%.Figure 37. FCoE usage from chassis to fabric interconnect on eth1/1© 2013 <strong>VCE</strong> Company, LLC. All Rights Reserved.58
Figure 38. FCoE usage from chassis to fabric interconnect on eth1/8vSphereRefer to the RTC run section to view vSphere per<strong>for</strong>mance <strong>and</strong> usage.CPU usageFigure 39 shows the CPU usage metrics <strong>for</strong> the <strong>SAP</strong>CL54 App Server when an OTC run is executedfrom 2:39 pm to 3:39 pm. Notice that the maximum CPU usage during this one-hour period was8.78%, with an average CPU usage of 1.2%.© 2013 <strong>VCE</strong> Company, LLC. All Rights Reserved.59
Figure 39. CPU usage metricsDatabase per<strong>for</strong>mance was also measured using PerfMon to show the minimal impact on databaseper<strong>for</strong>mance <strong>and</strong> usage while FICO tests were being run. Figure 40 shows how the maximumresource usage of the database was only 28.33% at its peak.© 2013 <strong>VCE</strong> Company, LLC. All Rights Reserved.60
Figure 40. Database per<strong>for</strong>mance measurement using PerfMonStorageThere are four key metrics on a storage array that are of interest,§ Front-end fibre channel ports/CPU§ Cache (memory slots)§ Back-end directors CPU§ Disks (fibre channel)© 2013 <strong>VCE</strong> Company, LLC. All Rights Reserved.61
Figure 41. Front-end fibre channel ports/CPUNote: The front-end fibre channel ports were less than 36% used.© 2013 <strong>VCE</strong> Company, LLC. All Rights Reserved.62
Figure 42. Cache (memory slots)Note: Write pending count is data that is in a cache slot waiting to be written to disk. In this example, <strong>for</strong> theFICO run, the write pending count (approximately 11,000) is much less than the write pending limit(650,000).© 2013 <strong>VCE</strong> Company, LLC. All Rights Reserved.63
Figure 43. Back-end directors CPUNote: Back-end directors were less than 25% used. These are the CPUs of the storage array that move the datafrom memory slots to disks.© 2013 <strong>VCE</strong> Company, LLC. All Rights Reserved.64
Figure 44. Disks (fibre channel)Note: Disk use percentage was 50% max but did not affect the write response times since the write pending limitwas not reached.© 2013 <strong>VCE</strong> Company, LLC. All Rights Reserved.65
ABOUT <strong>VCE</strong> <strong>VCE</strong>, <strong>for</strong>med by Cisco <strong>and</strong> EMC with investments from VMware <strong>and</strong> Intel, accelerates the adoption of converged infrastructure <strong>and</strong>cloud-based computing models that dramatically reduce the cost of IT while improving time to market <strong>for</strong> our customers. <strong>VCE</strong>,through the <strong>Vblock</strong> Systems, delivers the industry's only fully integrated <strong>and</strong> fully virtualized cloud infrastructure system. <strong>VCE</strong>solutions are available through an extensive partner network, <strong>and</strong> cover horizontal applications, vertical industry offerings, <strong>and</strong>application development environments, allowing customers to focus on business innovation instead of integrating, validating, <strong>and</strong>managing IT infrastructure.For more in<strong>for</strong>mation, go to www.vce.com.Copyright 2013 <strong>VCE</strong> Company, LLC. All Rights Reserved. <strong>Vblock</strong> <strong>and</strong> the <strong>VCE</strong> logo are registered trademarks or trademarks of <strong>VCE</strong> Company, LLC <strong>and</strong>/or itsaffiliates in the United States or other countries. All other trademarks used herein are the property of their respective owners.© 2013 <strong>VCE</strong> Company, LLC. All Rights Reserved.