Little Karoo Biodiversity Assessment - Biodiversity GIS - SANBI
Little Karoo Biodiversity Assessment - Biodiversity GIS - SANBI
Little Karoo Biodiversity Assessment - Biodiversity GIS - SANBI

You also want an ePaper? Increase the reach of your titles
YUMPU automatically turns print PDFs into web optimized ePapers that Google loves.
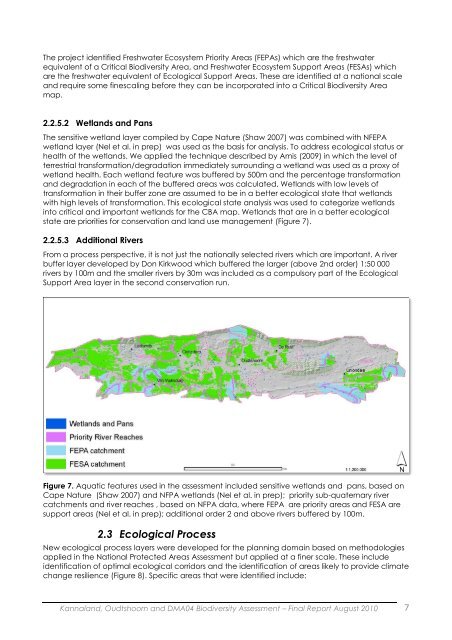
The project identified Freshwater Ecosystem Priority Areas (FEPAs) which are the freshwaterequivalent of a Critical <strong>Biodiversity</strong> Area, and Freshwater Ecosystem Support Areas (FESAs) whichare the freshwater equivalent of Ecological Support Areas. These are identified at a national scaleand require some finescaling before they can be incorporated into a Critical <strong>Biodiversity</strong> Areamap.2.2.5.2 Wetlands and PansThe sensitive wetland layer compiled by Cape Nature (Shaw 2007) was combined with NFEPAwetland layer (Nel et al. in prep) was used as the basis for analysis. To address ecological status orhealth of the wetlands. We applied the technique described by Amis (2009) in which the level ofterrestrial transformation/degradation immediately surrounding a wetland was used as a proxy ofwetland health. Each wetland feature was buffered by 500m and the percentage transformationand degradation in each of the buffered areas was calculated. Wetlands with low levels oftransformation in their buffer zone are assumed to be in a better ecological state that wetlandswith high levels of transformation. This ecological state analysis was used to categorize wetlandsinto critical and important wetlands for the CBA map. Wetlands that are in a better ecologicalstate are priorities for conservation and land use management (Figure 7).2.2.5.3 Additional RiversFrom a process perspective, it is not just the nationally selected rivers which are important. A riverbuffer layer developed by Don Kirkwood which buffered the larger (above 2nd order) 1:50 000rivers by 100m and the smaller rivers by 30m was included as a compulsory part of the EcologicalSupport Area layer in the second conservation run.Figure 7. Aquatic features used in the assessment included sensitive wetlands and pans, based onCape Nature (Shaw 2007) and NFPA wetlands (Nel et al. in prep); priority sub-quaternary rivercatchments and river reaches , based on NFPA data, where FEPA are priority areas and FESA aresupport areas (Nel et al. in prep); additional order 2 and above rivers buffered by 100m.2.3 Ecological ProcessNew ecological process layers were developed for the planning domain based on methodologiesapplied in the National Protected Areas <strong>Assessment</strong> but applied at a finer scale. These includeidentification of optimal ecological corridors and the identification of areas likely to provide climatechange resilience (Figure 8). Specific areas that were identified include:Kannaland, Oudtshoorn and DMA04 <strong>Biodiversity</strong> <strong>Assessment</strong> – Final Report August 2010 7