Petrogenesis of Plio-Pleistocene volcanic rocks from the chagai arc ...
Petrogenesis of Plio-Pleistocene volcanic rocks from the chagai arc ...
Petrogenesis of Plio-Pleistocene volcanic rocks from the chagai arc ...

You also want an ePaper? Increase the reach of your titles
YUMPU automatically turns print PDFs into web optimized ePapers that Google loves.
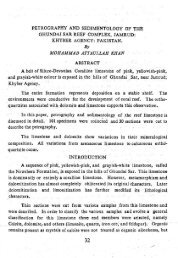
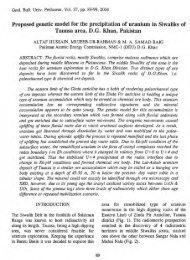
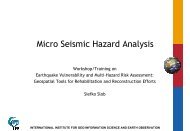
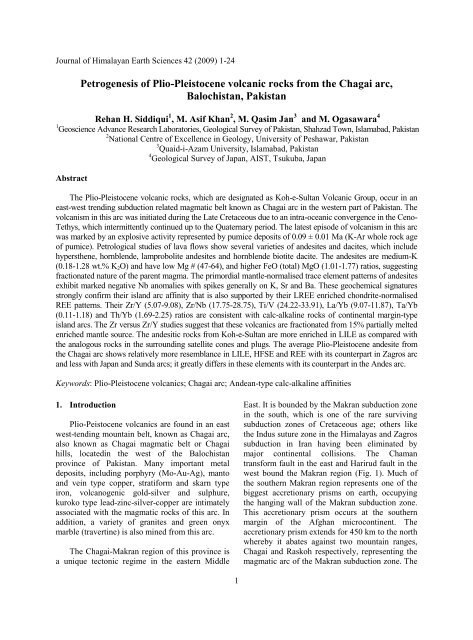
M APCHAGAI ARCFig. 1. Geological map <strong>of</strong> <strong>the</strong> Chagai-Raskoh <strong>arc</strong> terrane, Balochistan, Pakistan (modified and reproduced after Bakr and Jackson, 1964;Siddiqui et al., 2005).E X P L A N A T I O N SRecent &SubrecentUnconsolidated gravel,sand & alluvium<strong>Plio</strong>-<strong>Pleistocene</strong>Koh-i-Sultan <strong>volcanic</strong> GroupMiocene-<strong>Plio</strong>ceneMioceneOligocene-MioceneOligoceneMid. Eoceneto OligoceneEoceneEr. EocenePaleoceneLt.Cretaceousto PaleoceneD = Dalbandin and K = KhojakFormationsBuze Mashi Koh /Saindak Koh <strong>volcanic</strong>sChagai Intrusions(third phase)Amalaf Formation. The pyroclastics are marked asSain da k Form at io n. T h e l av a flo w s &th e T an k i S i l ls a re m a rk e d a s a n drespectively (second phase <strong>of</strong> Chagai Intrusions)Kharan LimestoneJuzzak / Rakhshani Formation. The lava flowsare marked asRaskoh intrusions & first phase<strong>of</strong> Chagai IntrusionsCretaceous Sinjrani Volcanic GroupCretaceousNauroze FormationKuchakki Volcanic GroupBunap sedimentary complexCharkohan radiolarian chertRaskoh Ophiolitic MelangeVRaskoh AccretionaryComplexLt. JurassicEr. to Md. JurassicEr. Jurassic ?D K(not shown on <strong>the</strong> map)Mesozoic-CenozoicContinental shelf sediments <strong>of</strong> Indian plateM a j o r T h r u s t sMinor Thrusts O t h e rF a u l t sNZS I N O - K O R EAY A N G T Z EAFGHANISTANPAKISTANIRANPAKISTANINDIAN PLATENushkiK Kohistan <strong>arc</strong>C Chagai <strong>arc</strong>Z Zagros <strong>arc</strong>CF Chaman FaultHRF Harirud FaultMAP Makran Accretionary PrismZTURANH RFIRAN AFGHANC FPAMIR SERINDAKTARIMEURASIACPAKISTANA F R I C A NPLATEA R A B I A N P L A T E0I N D I A N P L A T E1000kmINDIAM SZIND O-SIN A61 o 62 o 63 o 64 o 65 oBatal Koh VolcanicsSample Nos. Bk-1 to Bk-7Dam Koh VolcanicsSample Nos. Dk-1 to Dk-5RobatKoh-e-Dalil VolcanicsSample Nos. Kd-1 to Kd-4KachaMaki ChahVSaindak AmalafKoh-e-SultanVolcanicsSample Nos. Ks-2 to Ks-12BChagaiAhmad Wal29 oFig. 2PadagNok ChahJuzzakNok KundiDalbandinRASKOH ARCYakmachKharan28 o 63 o 64 o0 150km3
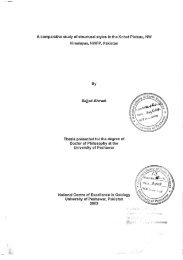
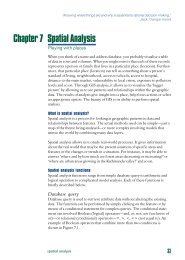
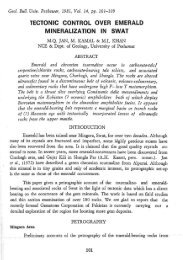
Paleogene NeogeneAgeMaFormationLithologyRecent & SubrecentQuaternary<strong>Pleistocene</strong><strong>Plio</strong>cene0.01171.8065.33Koh-e-SultanVolcanic GroupDalbandin Fm.Unconsolidated gravel, sand, silt and clay.Koh-e-Sultan Volcanic Group: Intercalations <strong>of</strong>dacitic-andesitic lava flows and <strong>volcanic</strong>lastics.Intercalations <strong>of</strong> shale, mudstone, sandstone andconglomerate.MioceneBuze Mashi KohVolcanic GroupBuze Mashi Koh Volcanic Group: Intercalations<strong>of</strong> andesitic-basaltic lava flows and <strong>volcanic</strong>lastics.M e s o z o i c C e n o z o i cT e r t i a r yC r e t a c e o u sMiddleUpperOligoceneEocenePaleoceneMaastrichtianCampanianSantonianConiacianTuronianCenomanianAlbianAptianBerrimian23.0333.955.865.570.683.585.888.693.699.6112.0125.0130.0Juzzak Fm.A m al a f F m .Saindak Fm.RobatLimestoneRakhshani Fm.Humai Fm.SinjraniVolcanic Gr.?DisconformityAmalaf Formation: Intercalations <strong>of</strong> shale, siltstone,sandstone and limestone, with andesitic <strong>volcanic</strong>sin <strong>the</strong> upper part.Saindak Formation: Intercalations <strong>of</strong> shale, siltstone,sandstone, marl and limestone, with andesiticlava flows and <strong>volcanic</strong>lastics in <strong>the</strong> lower part.Robat Limestone: Medium to thick-bedded forameniferaland argillaceous limestone.Tanki Sills: Mainly pyroxene diorites.Juzzak Formation: Intercalations <strong>of</strong> sandstone, shale,mudstone and limestone, with andesitic lava flowsand <strong>volcanic</strong>lastics in <strong>the</strong> lower middle part.Rakhshani Formation: Intercalations <strong>of</strong> sandstone,shale, mudstone and limestone representing a turbiditesequence.Humai Formation: Thick-bedded to massive limestoneon <strong>the</strong> top, intercalations <strong>of</strong> shale, sandstone,siltstone and limestone in <strong>the</strong> middle and conglomerateat <strong>the</strong> basal part.Basaltic-andesitic lava flows and <strong>volcanic</strong>lastics, w-ith minor shale, sandstone, siltstone, lenticular bodies<strong>of</strong> limestone and mudstone.LowerHauterivianValanginianBerriasian133.9140.2145.5Different phases <strong>of</strong> Intrusions =Fig. 2. Generalized stratigraphic sequence in <strong>the</strong> Chagai <strong>arc</strong> (after Jones, 1960; Siddiqui et al., 2005).The ages in <strong>the</strong> time scale are after Ogg et al. (2008).4
The <strong>Plio</strong>-<strong>Pleistocene</strong> <strong>volcanic</strong> <strong>rocks</strong>, namedas Koh-e-Sultan Volcanic Group (Jones, 1960),were previously considered as Quaternary(<strong>Pleistocene</strong>) in age but recent studies (Siddiquiet al., 2002; Siddiqui, 2004) have assigned a2.39 ± 0.05 Ma (K-Ar whole rock age <strong>of</strong> <strong>the</strong>andesite) to 0.09 ± 0.01 Ma (K-Ar whole rockage <strong>of</strong> pumice) age to <strong>the</strong>m. The main exposures<strong>of</strong> <strong>the</strong> <strong>Plio</strong>-<strong>Pleistocene</strong> <strong>volcanic</strong> <strong>rocks</strong> occur inKoh-e-Sultan mountain, covering 770 km 2 area(Figs. 3 and 4 A). This mountain forms a northwesttrending series <strong>of</strong> three volcanoes with<strong>the</strong>ir discrete calderas, named Kansuri, Abu andMiri after <strong>the</strong> highest peak adjacent to or inside<strong>the</strong> <strong>volcanic</strong> caldera. The Miri volcano, 2,333 mhigh above mean sea level, occurs at <strong>the</strong>southwestern side <strong>of</strong> this <strong>volcanic</strong> series and isconsidered youngest. Ithas well developed craterwalls, whereas o<strong>the</strong>r two volcanoes formcollapse caldera and appears to be older in age.Inside <strong>the</strong> Miri Volcano is ano<strong>the</strong>r small volcanowith well-developed inner circular crater formeddue to resurgent <strong>volcanic</strong> eruption (Fig. 2). Thediameter <strong>of</strong> Miri Volcanic crater is 6.5 km,whereas <strong>the</strong> inner crater measures about 800 min diameter. In <strong>the</strong> vicinity <strong>of</strong> Koh-e-Sultanvolcano, a number <strong>of</strong> small satellite cone andplugs are found: Koh-e-Dalil, Chhota Dalil, MitKoh, Dam Koh, Batal Koh, Bag Koh, Koh-e-Malik, and several o<strong>the</strong>r small and unnamedbodies (Figs. 1 and 2).The <strong>Plio</strong>cene to <strong>Pleistocene</strong> <strong>volcanic</strong>s arerepresented by andesitic to dacitic lava flows ( 90 volume%). The <strong>Plio</strong>cene <strong>volcanic</strong>s are generallydominated by andesites, whereas dacites occur asdominant phase in <strong>Pleistocene</strong> <strong>volcanic</strong>s.2.1. Andesitic lava flowsAndesitic lava flows are commonly form as 1to 2 m thick beds interstratified with <strong>the</strong><strong>volcanic</strong>lastics. These flows are grey to greenishgrey, hard, resistant to wea<strong>the</strong>ring and generallyform small ridges. At least five eruptive cycles areobserved in <strong>the</strong> middle horizon <strong>of</strong> <strong>the</strong>southwestern flank <strong>of</strong> <strong>the</strong> Koh-e-Sultan volcano,whereas two more are observed northwest <strong>of</strong> Miripeak (Fig. 4A). These andesitic lavas aregenerally interrupted with tuffs and agglomeratesequence (Fig. 4A). The two cycles <strong>of</strong> andesiteeruption within Miri Volcano are light grey incolour and form secondary craters. The lava flow,which occurs in <strong>the</strong> outer crater, is up to 100 mthick, whereas <strong>the</strong> inner one is up to 3 m thick.The andesites are porphyritic and showphenocrysts <strong>of</strong> pyroxene, plagioclase andhornblende in a fine-grained groundmass having<strong>the</strong> same mineral composition.2.2. Dacitic lava flowsThe dacitic lava flows generally occur as lavadomes plugs and small satellite volcanoes insideand around Koh-e-Sultan Volcano. The daciticflows are light grey to pinkish grey in colour andporphyritic in texture. Phenocrysts are mainlyrepresented by hornblende, quartz, plagioclaseand biotite and are embedded in a fine-grainedgroundmass having <strong>the</strong> same composition.3. Petrography3.1. AndesitesUnder microscope, four types <strong>of</strong> andesites areidentified, (a) hornblende-andesite, (b)hypers<strong>the</strong>ne-andesite, (c) hornblende-hypers<strong>the</strong>neandesite,and (d) lamprobolite-andesite. The maintextures exhibited by <strong>the</strong> andesites arehypocrystalline and porphyritic. O<strong>the</strong>r texturesinclude cumulophyric, vitrophyric and intersetal.The main primary minerals include plagioclase,clinopyroxene, orthopyroxene, amphibole andminor quartzdescribed as under:Plagioclase: Plagioclase crystals are euhedral tosubhedral, lathlike and columnar in shape, andexhibit polysyn<strong>the</strong>tic twinning (according to <strong>the</strong>albite and occasionally to <strong>the</strong> combined albite andCarlsbad laws) and oscillatory zoning. Theplagioclase generally ranges in composition <strong>from</strong>An 26 to An 48, (oligoclase to andesine).5
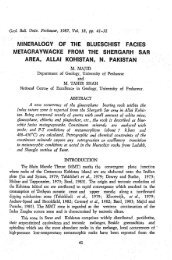
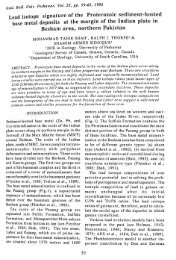
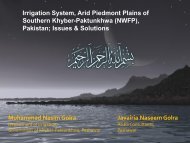
OOFig. 3. Geological map <strong>of</strong> Koh-e-Sultan area (modified after Jones, 1960; Siddiqui, 2004).EXPLANATIONSRecent andSubrecentBoulder, gravel, alluviumand sand dunesSubrecent Terrace gravelLateKoh-e-Sultan Volcanic Group:<strong>Pleistocene</strong> Mainly dacitic lava flowsand <strong>volcanic</strong>lastics<strong>Plio</strong>cene toKoh-e-Sultan Volcanic Group:<strong>Pleistocene</strong> Andesitic to dacitic lava flowsand <strong>volcanic</strong>lasticsOligocene ?Chagai Intrusions:Adamellite and granodioritePaleoceneJuzzak Formation:Shale, sandstone, siltstoneand limestoneLate CretaceousSinjrani Volcanic Group:Basaltic to andesitic lavaflows and <strong>volcanic</strong>lastics5Dip and strikeAnticlineVolcanic calderaVolcanic domeMountain peaksVolcanogenic ironVolcanogenic sulfurO29155O6230A6245 6300N55Kansuri Koh5305Abu Koh5Dam Koh KOH-E-SULTAN Miri KohBage Koh 55105105Batal Koh10555Koh-e-Malik555B15A B2400 m1200 mSea level??0 10 20km40406
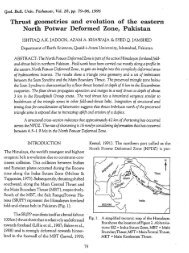
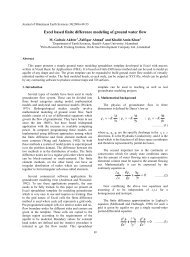
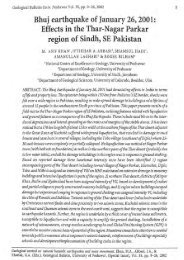
ABCDEFGHFig. 4. (A) a view <strong>of</strong> <strong>the</strong> nor<strong>the</strong>rn part <strong>of</strong> <strong>the</strong> Miri crater <strong>of</strong> <strong>the</strong> Koh-e-Sultan volcano, (B) andesitic lavaflows intercalated with <strong>volcanic</strong>lastic <strong>rocks</strong> on <strong>the</strong> sou<strong>the</strong>rn flank <strong>of</strong> <strong>the</strong> same volcano, (C)photomicrograph (KS-4) displaying large prismatic and polygonal phenocrysts and fragments <strong>of</strong>hornblende within a cryptocrystalline to glassy groundmass. (D) photomicrograph (KS-21)exhibiting cumulophyric texture developed by <strong>the</strong> clustering <strong>of</strong> <strong>the</strong> hypers<strong>the</strong>ne phenocrysts, (E)photomicrograph (KS-5) displaying cumulophyric texture formed by clustering <strong>of</strong> lamprobolitephenocrysts in a microcrystalline to glassy groundmass (in plane polarized light), (F) <strong>the</strong> samephotomicrograph in crossed polarized light. (G) photomicrograph (KS-20) displaying phenocryst<strong>of</strong> hornblende with well developed 124°-56° cleavage and small anhedral inclusions <strong>of</strong> quartz (incentre). Note strong zoning in some plagioclase crystals. Hornblede in top right containsmagnetite inclusions, (H) photomicrograph <strong>of</strong> dacite (KS-9) exhibiting twining and oscillatoryzoning in a phenocryst <strong>of</strong> plagioclase.7
At places zoned plagioclase crystals containabundant fluid inclusions parallel to zoningtowards <strong>the</strong>ir margins. A few <strong>of</strong> <strong>the</strong>m showresorbed and pitted margins. Larger plagioclasephenocrysts have small prismatic and polygonalinclusion <strong>of</strong> hornblende. Groundmass plagioclasegenerally occurs as small microlites, crystallites,and tiny columnar laths.Pyroxene: The pyroxene is mainly represented byboth, ortho- and clinohypers<strong>the</strong>ne, occurring assmall euhedral to subhedral prismatic crystals andsquare or equant basal sections. Orthopyroxenephenocrysts occasionally show green to pale brownpleochroism and exhibit polysyn<strong>the</strong>tic twinning andlocally developed reaction rims <strong>of</strong> hornblende. Thegroundmass hypers<strong>the</strong>ne occurs as tinny prismaticcrystals and globules in <strong>the</strong> interstices between <strong>the</strong>small plagioclase crystals, imparting to <strong>the</strong> rock asub-intersertal texture. Amphibole: The amphibole ismainly represented by hornblende with substantialoxy- hornblende. Hornblende shows yellowishgreen to green and lamprobolite light brown toreddish brown pleochroism, whereas both displayswell developed sets <strong>of</strong> 56 and 124 cleavages inbasal sections. It occurs as large euhedral prismaticgrains and polygonal basal sections, occasionallyshowing polysyn<strong>the</strong>tic twinning (Fig. 4C). Some <strong>of</strong><strong>the</strong> amphibole crystals exhibit a rim <strong>of</strong> abundantfluid inclusions as in <strong>the</strong> case <strong>of</strong> plagioclase. Thelamprobolitee crystals generally occur in clustersimparting to <strong>the</strong> <strong>rocks</strong> a cumulophyric texture (Fig.4E & F). In <strong>the</strong> groundmass lamprobolitee occurs assmall prismatic crystals and tinny polygonal basalsections.Quartz: It generally occurs as small subhedral andequant phenocrysts.Volcanic Glass: The <strong>volcanic</strong> glass is commonlydevitrified and has brown colour, which generallyoccurs in groundmass and as fillings in vesicles.Accessory Minerals: These includeapatite,magnetite,pyrite and chalcopyrite. Apatite occursas small euhedral and prismatic crystals enclosedin larger grains <strong>of</strong> plagioclase. Magnetite occursas small subhedral to anhedral crystals scatteredthroughout <strong>the</strong> groundmass. The pyrite andchalcopyrite are found as small anhedral andirregular grains.Secondary Minerals: Secondary minerals aredeveloped as partial or complete replacement <strong>of</strong>primary minerals. At places, pyroxene andhornblende are partially altered into chlorite. Claymineral, sericite, and calcite have developed afterpartial alteration <strong>of</strong> plagioclase. Magnetite ispartially to completely replaced by hematite, butoccasionally by limonite.3.2. DaciteThe dacite is represented by only one variety:hornblende dacite. These <strong>rocks</strong> (KS-6 & KS-9)are holocrystalline porphyritic and cumulophyricin texture. Large phenocrysts (0.1 - 7.0 mm) <strong>of</strong>plagioclase and amphibole are embedded in amicrocrystalline groundmass having <strong>the</strong> sameminerals. The phenocryst groundmass ratio is45:55.Plagioclase: Plagioclase crystals are euhedral tosubhedral, lathlike, columnar and equant in shapeand exhibit polysyn<strong>the</strong>tic twinning according to<strong>the</strong> albite and occasionally to <strong>the</strong> combined albiteand Carlsbad laws. The anorthite contents <strong>of</strong>plagioclase could not be determined due to <strong>the</strong>development <strong>of</strong> strong oscillatory zoning in allphenocrysts (Fig. 4H). At places zonedplagioclase crystals have abundant fluidinclusions towards <strong>the</strong>ir margins parallel tozoning planes. Larger plagioclase phenocrystshave small tabular and lathlike inclusion <strong>of</strong> earliergeneration <strong>of</strong> plagiclase itself. Groundmassplagioclase generally occurs as small anhedral andequant crystals and tiny columnar laths.Quartz: It generally occurs as small subhedral andequant phenocrysts and microcrystalline anhedraland equant crystals in <strong>the</strong> groundmass. Quartz isalso found as anhedral inclusions in hornblende.Amphibole: The amphibole is mainly representedby brownish green hornblende. It shows yellowishgreen to brownish green pleochroism and two sets<strong>of</strong> well-developed cleavages in basal sections.The hornblende generally occurs as large euhedralprismatic grains and polygonal basal sections,which occasionally show polysyn<strong>the</strong>tic twinning.Some <strong>of</strong> <strong>the</strong> hornblende crystals exhibit a rim <strong>of</strong>abundant fluid inclusions towards <strong>the</strong>ir margin asin <strong>the</strong> case <strong>of</strong> plagioclase.8
Table 1. Bulk chemistry <strong>of</strong> <strong>Plio</strong>-<strong>Pleistocene</strong> <strong>volcanic</strong> <strong>rocks</strong> <strong>from</strong> <strong>the</strong> Chagai <strong>arc</strong>.ElementsKoh-e-Sultan Volcanics& Ratios Ks-2 Ks-3 Ks-5 Ks-6 Ks-7 Ks-8 Ks-8b Ks-9 Ks-11 Ks-12bSiO 2 58.34 59.12 63.08 61.42 63.49 61.34 62.76 61.67 63.05 63.36TiO 2 0.64 0.49 0.46 0.46 0.44 0.53 0.48 0.53 0.47 0.43Al 2 O 2 16.97 15.51 17.02 17.09 17.16 17.55 17.1 17.23 17.14 17.15Fe 2 O 3 6.93 6.68 4.85 5.11 4.63 5.16 4.85 5.21 4.85 4.6MnO 0.13 0.33 0.1 0.15 0.1 0.15 0.15 0.1 0.1 0.1MgO 4.8 5.9 3.01 3.25 2.77 3.32 3.01 3.39 2.98 2.75CaO 6.95 5.81 6.2 7.34 6.14 6.83 6.27 6.67 6.04 6.19Na 2 O 3.92 4.72 4.09 4.07 4.15 4.03 4.24 4.09 4.2 4.25K 2 O 1.15 1.28 1.04 0.97 0.97 0.95 1.01 0.97 0.99 1.02P 2 O 5 0.16 0.16 0.14 0.14 0.13 0.13 0.13 0.13 0.13 0.13FeOt/MgO 1.28 1.01 1.43 1.40 1.49 1.38 1.43 1.37 1.45 1.49K 2 O/Na 2 O 0.29 0.27 0.25 0.24 0.23 0.24 0.24 0.24 0.24 0.24Mg # 58 64 55 56 55 56 55 57 55 55Rb 26 34 19 18 19 22 21 22 19 18Sr 429 433 493 482 494 471 475 463 479 490Ba 300 338 436 362 443 351 434 419 423 421V 151 116 98 123 96 141 91 149 100 89Cr 261 205 42 87 92 111 28 120 38 100Co 26 20 33 18 16 20 50 19 31 15Ni 68 19 16 20 17 18 12 19 13 16Zr 99 97 75 75 71 71 69 72 74 72Y 16 13 12 12 12 14 12 13 12 12Nb 4 4 4 3 4 4 3 3 3 4Hf 0.6 0.36 1.31 Ta 0.18 0.19 0.24 Th 2.93 1.74 2.12 U 0.61 0.44 0.66 Sc 21 15 16 21 20 26 16 27 20 17La 15.15 13.01 10.02 Ce 27.63 25.11 19.76 Nd 13.43 11.53 8.94 Sm 2.66 2.25 1.92 Eu 1 0.79 0.68 Gd 3.54 2.21 2.14 Er 1.23 0.99 1.11 Yb 1.67 1.03 1.14 REE 66.31 56.92 45.71 Eu N /Eu* 1 1.09 1.03 Ce N /Ce* 1.02 1.08 1.1 (La/Yb) N 6.05 8.42 5.86 (Ce/Yb) N 4.21 6.2 4.41 (La/Sm) N 3.5 3.56 3.21 (La/Ce) N 1.44 1.36 1.33 Th/Yb 1.75 1.69 1.86 Ta/Yb 0.11 1.18 0.21 La/Yb 9.07 12.63 8.79 Ce/Yb 41.24 24.38 17.33 Zr/Y 6.19 7.46 6.25 6.25 5.92 5.07 5.75 5.54 6.17 6.00Zr/Nb 24.75 24.25 18.75 25.00 17.75 17.75 23.00 24.00 24.67 18.00Ti/Zr 38.72 30.26 36.74 36.74 37.12 44.71 41.67 44.09 38.04 35.77Ti/V 25.39 25.30 28.12 22.40 27.45 22.52 31.60 21.31 28.15 28.94FeOt = Total iron as FeO, Mg # =100xMg /Mg+Fe +2 , SiO 2 -P 2 O 5 are in %, Rb-Yb are in ppm. REE ratios with N arechondrite normalized(after Nakamura, 1974), REE with * are interpolated values (see text for details).10
Table 1. ContinuedElements Koh-e-Sultan Volcanics Batal Koh Volcanics& Ratios Ks-4 Ks-10 Ks-12a Bk-1 Bk-2 Bk-3 Bk-4 Bk-5 Bk-6 Bk-7SiO 2 63.55 63.89 64.83 59.6 59.53 59.36 59.64 59.14 57.49 57.45TiO 2 0.44 0.44 0.42 0.58 0.59 0.59 0.58 0.59 0.64 0.64Al 2 O 2 17.12 17.14 17.03 17.83 17.84 18.05 17.8 17.81 18.47 18.45Fe 2 O 3 4.7 4.57 4.36 6.09 6.18 6.29 6.24 6.23 6.88 6.78MnO 0.1 0.1 0.1 0.12 0.12 0.13 0.12 0.12 0.13 0.13MgO 2.86 2.74 2.55 3.38 3.29 3.4 3.43 3.35 3.46 3.4CaO 5.22 5.68 5.39 7.18 7.27 7.07 6.91 7.21 7.98 8.34Na 2 O 4.23 4.27 4.27 4.11 4.05 4.08 4.22 4.03 3.86 3.75K 2 O 1.01 1.04 0.92 0.92 0.93 0.84 0.88 0.88 0.88 0.84P 2 O 5 0.13 0.12 0.13 0.18 0.19 0.19 0.18 0.19 0.21 0.21FeOt/MgO 1.46 1.48 1.52 1.60 1.67 1.64 1.62 1.65 1.77 1.77K 2 O/Na 2 O 0.24 0.24 0.22 0.22 0.23 0.21 0.21 0.22 0.23 0.22Mg # 55 56 55 53 52 52 52 52 50 50Rb 19 19 29 18 18 14 17 18 16 15Sr 489 474 490 504 508 513 530 509 519 564Ba 419 406 502 365 368 414 362 320 314 353V 109 97 91 99 108 90 87 95 126 131Cr 102 33 27 64 85 45 123 45 65 44Co 16 32 36 16 18 32 19 36 19 22Ni 18 13 14 15 17 19 21 18 12 12Zr 73 71 75 113 112 115 112 108 101 101Y 11 12 11 16 16 16 16 16 16 17Nb 4 3 3 5 4 4 4 4 4 4Hf 1.39 17 17 17 20 16 17 20Ta 0.18 1.13 1.13 0.88 1.06 1.13 1.00 0.88Th 3.02 22.81 23.00 25.88 22.63 20.00 19.63 20.76U 1.02 3.23 3.29 3.60 3.23 2.96 3.11 3.50Sc 19 26 22 7.06 7.00 7.19 7.00 6.75 6.31 5.94La 15.90 22.60 28.00 28.75 28.00 27.00 25.25 25.25Ce 28.17 30.75 31.55 30.73 31.02 32.72 37.96 37.96Nd 12.58 35.09 32.72 39.27 39.93 37.20 30.43 29.26Sm 1.98 424 429 498 430 406 457 465Eu 0.91 20.92 20.98 16.84 20.18 22.83 23.26 19.75Gd 3.16 0.036 0.035 0.027 0.032 0.035 0.031 0.027Er 1.02 28 28 37 31 28 32 38Yb 1.34 0.31 0.25 0.25 0.25 0.25 0.25 0.24REE 65.06 1.13 1.00 0.89 0.95 0.89 1.42 1.67Eu N /Eu* 1.12 Ce N /Ce* 1.05 (La/Yb) N 7.91 (Ce/Yb) N 5.35 (La/Sm) N 4.94 (La/Ce) N 1.48 Th/Yb 2.25 Ta/Yb 0.13 La/Yb 11.87 Ce/Yb 21.02 Zr/Y 6.64 5.92 6.82 7.06 7.00 7.19 7.00 6.75 6.31 5.94Zr/Nb 18.25 23.67 25.00 22.60 28.00 28.75 28.00 27.00 25.25 25.25Ti/Zr 36.10 37.12 33.54 30.75 31.55 30.73 31.02 32.72 37.96 37.96Ti/V 24.18 27.17 27.65 35.09 32.72 39.27 39.93 37.20 30.43 29.26FeOt = Total iron as FeO, Mg # =100xMg /Mg+Fe +2 , SiO 2 -P 2 O 5 are in %, Rb-Yb are in ppm. REE ratios with N arechondrite normalized (after Nakamura, 1974), REE with * are interpolated values (see text for details).11
Table 1. ContinuedElements Dam Koh Volcanics Koh-e-Dalil Volcanics& Ratios Dk-1 Dk-2 Dk-3 Dk-4 Dk-5 Kd-1 Kd-2 Kd-3 Kd-4SiO 2 60.15 61.55 60.98 63.16 63.76 57.98 58.12 59.87 59.37TiO 2 0.51 0.52 0.54 0.48 0.49 0.7 0.71 0.61 0.61Al 2 O 3 17.4 17.97 17.83 17.22 17.01 17.76 17.93 17.6 17.41Fe 2 O 3 5.45 5.47 5.58 4.88 4.65 6.47 6.49 5.72 5.74MnO 0.1 0.12 0.11 0.1 0.1 0.11 0.11 0.1 0.1MgO 3.24 2.43 2.89 2.57 2.6 4.11 3.99 3.51 3.59CaO 7.96 6.37 6.36 5.95 5.65 7.76 7.6 7.2 8.16Na 2 O 4.25 4.43 4.36 4.21 4.24 3.78 3.72 3.87 3.78K 2 O 0.78 0.94 1.11 1.26 1.33 1.12 1.14 1.18 1.09P 2 O 5 0.17 0.2 0.24 0.17 0.18 0.2 0.19 0.26 0.16FeOt/MgO 1.50 2.00 1.72 1.69 1.59 1.42 1.46 1.48 1.44Na 2 O/K 2 O 5.45 4.71 3.93 3.34 3.19 3.38 3.26 3.28 3.47K 2 O/Na 2 O 0.18 0.21 0.25 0.30 0.31 0.30 0.31 0.30 0.29Mg # 54 47 51 51 53 Ti 3055 3115 3235 2875 2935 4193 4253 3654 3654K 6474 7802 9213 10458 11039 9296 9462 9794 9047P 741 872 1046 741 785 872 828 1134 698Rb 16 21 31 31 30 16 16 18 17Sr 590 523 545 619 591 917 890 857 855Ba 369 375 423 661 608 410 398 425 423V 112 105 105 84 96 201 195 183 170Cr 74 54 115 43 56 32 33 33 35Co 19 16 18 13 14 21 19 12 20Ni 21 7 18 13 14 14 13 12 12Zr 92 128 124 96 98 113 113 112 109Y 12 15 15 12 12 13 14 13 12Nb 4 5 7 6 7 4 4 4 4Sc 17 12 15 14 16 28 26 22 23Rb/Y 1.33 1.40 2.07 2.58 2.50 1.23 1.14 1.38 1.42Ba/Y 30.75 25.00 28.20 55.08 50.67 31.54 28.43 32.69 35.25Ba/Zr 4.01 2.93 3.41 6.89 6.20 3.63 3.52 3.79 3.88Zr/Y 7.67 8.53 8.27 8.00 8.17 8.69 8.07 8.62 9.08Zr/Nb 23.00 25.60 17.71 16.00 14.00 28.25 28.25 28 27.25Ti/Zr 33.21 24.33 26.09 29.95 29.95 37.11 37.64 32.63 33.52Ti/V 27.28 29.66 30.81 34.23 30.57 20.86 21.81 19.97 21.49K/Rb 405 372 297 337 368 581 591 544 532K/Ba 17.54 20.81 21.78 15.82 18.16 22.67 23.77 23.04 21.39Rb/Sr 0.027 0.040 0.057 0.050 0.051 0.017 0.018 0.021 0.020Sr/Rb 37 25 18 20 20 57.31 55.63 47.61 50.29Nb/Y 0.33 0.33 0.47 0.50 0.58 0.31 0.29 0.31 0.33Sc/Ni 0.81 1.71 0.83 1.08 1.14 2.00 2.00 1.83 1.92FeOt = Total iron as FeOt, Mg # =100xMg /Mg+Fe +2 , SiO 2 -P 2 O 5 are in %, Rb-Yb are in ppmAll <strong>the</strong> rock samples collected <strong>from</strong> <strong>Plio</strong>-<strong>Pleistocene</strong> <strong>volcanic</strong>s are classified according to<strong>the</strong> TAS (total alkali silica) classification <strong>of</strong> IUGSand are plotted in SiO 2 versus alkali (wt. %)diagrams (Fig. 5) <strong>of</strong> Le Bas et al. (1986). In thisdiagram, 22 samples plot in andesite fields,whereas five <strong>from</strong> Koh-e-Sultan area and tw<strong>of</strong>rom Dam Koh area plot in dacite field or just onboundary between andesite and dacite fields. All<strong>the</strong> samples <strong>from</strong> <strong>Plio</strong>-<strong>Pleistocene</strong> <strong>volcanic</strong>s arealso plotted in K 2 O versus SiO 2 diagrams (afterGill, 1981). In this diagram samples plot inmidium to low-K.andesite and dacite fields (Fig.6).12
1614Koh-e-SultanDam KohBatal KohKoh-e-DalilPhonolite12TephriphonoliteTrachyteNa 2 O + K 2 O108642035FoiditeTephriteBasaniteBasaltPhonotephriteTrachy-Basalticandesitetrachy-PicrobasaltandesiteTrachybasaltBasalticandesiteAndesiteTrachydaciteDaciteRhyolite40 45 50 55 60 65 70 75SiO 2Fig. 5. Alkali versus SiO 2 plot (after Le Bas, et al., 1986) for <strong>the</strong> <strong>Plio</strong>-<strong>Pleistocene</strong> <strong>volcanic</strong> <strong>rocks</strong> <strong>from</strong><strong>the</strong> Chagai <strong>arc</strong>.4Koh-e-SultanDam KohBatal KohKoh-e-DalilAcidic3BasicHigh-KAndesiteK 2 O2Medium-KAndesite1Low-KAndesite050 55SiO60652Fig. 6. K 2 O versus SiO 2 diagram (after Gill, 1981) for <strong>the</strong> <strong>Plio</strong>-<strong>Pleistocene</strong> <strong>volcanic</strong> <strong>rocks</strong> <strong>from</strong> <strong>the</strong>Chagai <strong>arc</strong>.13
The SiO 2 contents in KSV have a wider range(58.35-64.83 wt. %), as compared to o<strong>the</strong>rs BKV(57.45-59.64 wt. %), KDV (57.98-59.87 wt. %),DKV (61.15-63.16 wt. %). The TiO 2, Al 2 O 3,Fe 2 O 3, CaO and P 2 O 5 contents (Table 1) are within<strong>the</strong> proposed range <strong>of</strong> most orogenic andesites(Gill, 1981). The <strong>volcanic</strong>s have lower but greatlyvariable (2.55-4.80) range for MgO wt. %, exceptone andesite sample <strong>from</strong> KSV shows highervalue (5.90) for MgO wt. %, which is little lowerthan high-Mg andesite value (> 6 wt. % MgO)proposed by Gill (1981). The KDV have lowerand narrow overlapping range for Na 2 O (3.72-3.87 wt. %) and K 2 O (1.09-1.18 wt. %). All o<strong>the</strong>r<strong>volcanic</strong>s have a wider and variable range (Table1). The K 2 O/Na 2 O ratios in all <strong>the</strong> <strong>volcanic</strong> arelow (0.18-0.31), which are much lower than <strong>the</strong>reported (0.60-1.00) ratios for commoncontinental margin type <strong>arc</strong>s. The KDV havenarrow and lower (1.42-1.1.48) FeOt/MgO ratiosas compared to all o<strong>the</strong>r <strong>volcanic</strong>s, which have awider and higher overlapping range (1.01-2) forthis ratio. All <strong>the</strong> <strong>volcanic</strong>s show a lower andnarrow (47-58) range for Mg # (100 × Mg/Mg +Fe 2+ ), which are consistent with most <strong>volcanic</strong><strong>rocks</strong> <strong>of</strong> orogenic <strong>arc</strong>s (Gill, 1981).4.3. Major Element VariationsSiO 2 is used as fractionation index in variousHarker-type variation diagrams for majorelements (Fig. 7). In <strong>the</strong>se diagrams, almost all<strong>the</strong> samples <strong>from</strong> <strong>the</strong> area show sharp to scatterednegative correlation for Al 2 O 3, MgO, Fe 2 O 3, TiO 2,CaO and P 2 O 5 . The negative correlation for MgO,Fe 2 O 3, and TiO 2 are due to <strong>the</strong> early fractionation<strong>of</strong> pyroxene, hornblende and magnetite. Thesimilar trends for Al 2 O 3 and CaO are probably dueto fractionation <strong>of</strong> plagioclase. The P 2 O 5 exhibit ascattered negative correlation, due probably t<strong>of</strong>ractionation <strong>of</strong> apatite. Na 2 O and K 2 O showscattered positive correlation with SiO 2 probablydue to <strong>the</strong> enrichment <strong>of</strong> <strong>the</strong>se elements in <strong>the</strong>residual phase.4.4. Trace Element VariationsMgO is used as fractionation index in variousHarker-type variation diagrams for trace elements(Fig. 8). The analysis show scattered negativecorrelation for Ba, and Rb (except BVC) due to<strong>the</strong> enrichment <strong>of</strong> <strong>the</strong>se elements in <strong>the</strong> residualphase. Ti, V, Sc, P, Co and Ni exhibit sharp toscattered positive correlation (except BVC) for all<strong>the</strong> <strong>volcanic</strong>s probably due to <strong>the</strong> partitioning <strong>of</strong><strong>the</strong>se elements in magnetite, apatite, hornblendeand pyroxene during differentiation. In all <strong>the</strong>diagrams BVC show nonsystematic behavior,probably due to limited MgO concentration.4.5. Trace element abundancesLarge Ion Lithophile Elements (LILE): The<strong>volcanic</strong>s generally have higher abundances <strong>of</strong>LILE as compared to high field strength elements(HFSE). The KDV <strong>volcanic</strong>s generally havelower abundances and narrow range for Rb (16-18ppm), Sr (855-917 ppm) and Ba (398-410 ppm).The o<strong>the</strong>r <strong>volcanic</strong>s have a wider and variablyhigher overlapping range for Rb (14-34 ppm), Sr(433-619 ppm) and higher for Ba (300-661 ppm),which are consistent with <strong>the</strong> calc-alkaline<strong>volcanic</strong> <strong>rocks</strong> <strong>of</strong> orogenic <strong>arc</strong>s (Gill, 1981). Thand U, analyzed only in <strong>the</strong> KSV, range <strong>from</strong> 1.74to 3.02 ppm and 0.44 to 1.02 ppm, respectively.High Field Strength Elements (HFSE): The KSV<strong>volcanic</strong>s generally have lower abundances <strong>of</strong> Zr(69-99 ppm), Nb (3-4 ppm) and Y (11-16 ppm).The o<strong>the</strong>r <strong>volcanic</strong>s have higher overlappingabundances for <strong>the</strong>se elements. Zr, 92 to 113 ppm,Nb 4 to 7 ppm, and and Y 12 to 17 ppm,respectively, which suggest that KSV <strong>volcanic</strong>swere formed by relatively higher degree <strong>of</strong> partialmelting as compared to <strong>the</strong> o<strong>the</strong>r <strong>volcanic</strong>s. Theconcentration <strong>of</strong> HFSE in <strong>the</strong>se <strong>volcanic</strong>s isconsistent with an enriched sub-<strong>arc</strong> mantleperidotite source and corresponds to calc-alkaline<strong>volcanic</strong> <strong>rocks</strong> <strong>of</strong> orogenic <strong>arc</strong>s (Gill, 1981). Taand Hf were analyzed only in KSV, andrange<strong>from</strong> 0.18 to 0.24 ppm and 0.36 to 1.39 ppm,respectively.Compatible Elements: The KSV <strong>volcanic</strong>s have avariable and higher overlapping range for Cr (27-261 ppm), Ni (13-68 ppm), Co (15-50 ppm), V(89-151 ppm), and Sc (15-27 ppm). The o<strong>the</strong>r<strong>volcanic</strong>s have lower but greatly variableoverlapping range <strong>of</strong> compatible elements: Cr(33-123 ppm), Ni (12-21 ppm), Co (12-36 ppm),V (84-201 ppm) and Sc (84-201 ppm). Thesevalues are much lower than <strong>the</strong> values proposed(Gill, 1981) for <strong>the</strong> <strong>volcanic</strong> <strong>rocks</strong> <strong>of</strong> orogenic<strong>arc</strong>s that are directly derived <strong>from</strong> <strong>the</strong> primarymantle source.14
20MgOAl 2 O 31Koh-e-Sultan <strong>volcanic</strong>sBatal Koh <strong>volcanic</strong>sDam Koh <strong>volcanic</strong>sKoh-e-Dalil <strong>volcanic</strong>s717414876Fe 2 O 30.80.70.60.5540.40.35Na 2 OTiO 25CaO9847632K 2 OP 2 O 50.310.2056 58 60 62 64 66SiO 20.156 58 60 62 64 66SiO 2Fig. 7. Harker type variation diagrams for major elements showing fractionation trends in <strong>the</strong> <strong>Plio</strong>-<strong>Pleistocene</strong> <strong>volcanic</strong> <strong>rocks</strong> <strong>of</strong> <strong>the</strong> Chagai <strong>arc</strong>15
6040R bB aKoh-e-Sultan <strong>volcanic</strong>sBatal Koh <strong>volcanic</strong>sDam Koh <strong>volcanic</strong>sKoh-e-Dalil <strong>volcanic</strong>s8006002040002005000T iP200040001000300020000300VS c402003020100100030N iC o602040102002.0 2.5 3.0 3.5MgO4.0 4.502.0 2.5 3.0 3.5 4.0 4.5MgOFig. 8. Harker type variation diagrams for trace elements showing fractionation trends in <strong>the</strong> <strong>Plio</strong>-<strong>Pleistocene</strong> <strong>volcanic</strong> <strong>rocks</strong> <strong>of</strong> <strong>the</strong> Chagai <strong>arc</strong>.16
Rare Earth Elements (REE): The rare ear<strong>the</strong>lements (La, Ce, Nd, Sm, Eu, Gd, Er & Yb) wereanalyzed in only in four samples <strong>from</strong> KSV (Ks-2, 3, 4 & 9) <strong>Plio</strong>-<strong>Pleistocene</strong> <strong>volcanic</strong>s. The totalREE concentration is moderate and ranges <strong>from</strong>45.71 to 66.31. The <strong>volcanic</strong>s generally havera<strong>the</strong>r higher normalized LREE/HREE ratios(La N /Yb N = 5.86-8.42, Ce N /Yb N = 4.21-6.20),which suggests that <strong>the</strong>y are derived <strong>from</strong> a LREEenriched mantle peridotite source. The <strong>rocks</strong> havevery narrow range <strong>of</strong> La N /Ce N (1.33-1.48) andLa N /Sm N (3.21-4.94) ratios, which suggests thatall <strong>the</strong> <strong>volcanic</strong>s <strong>of</strong> KSV had a uniform mantlesource. The measured Eu anomalies (Eu N / Eu*),which are calculated by dividing <strong>the</strong> chondritenormalized (Eu N ) values and <strong>the</strong> interpolated(Eu*) values [Eu N /Eu* = Eu N /(Sm N × Gd N )].(Taylor & McLennan, 1985)have values veryclose to one (1.03 to 1.12). Similarly, measuredCe anomalies (Ce N /Ce*), which are calculated bydividing <strong>the</strong> chondrite normalized (Ce N ) valueswith <strong>the</strong> interpolated (Ce*) values [Ce N /Ce* =Ce N /(La N × Nd N )] have positive values, whichnegate <strong>the</strong> involvement <strong>of</strong> subducted pelagicsediments in <strong>the</strong>ir magma generation (Hole et al.,1984).Spider Diagrams: The spider diagrams or multielementsdiagram are generally used to study <strong>the</strong>behavior <strong>of</strong> incompatible trace elements in <strong>the</strong><strong>rocks</strong> and to constrain <strong>the</strong>ir source regions, withreference to primordial mantle or N-MORBcompositions. For this purpose all <strong>the</strong> samples<strong>from</strong> <strong>Plio</strong>-<strong>Pleistocene</strong> <strong>volcanic</strong> <strong>rocks</strong> <strong>from</strong> <strong>the</strong>Chagai <strong>arc</strong> are plotted in primordial mantlenormalized spider diagram (Fig. 9) with anaverage trace element spider plot <strong>of</strong> N-MORB forcomparison (both normalizing and average valuesare after Sun and McDonough (1989).The spider patterns in this diagram exhibitenrichment <strong>of</strong> whole range <strong>of</strong> incompatible traceelements except Ti and Y relative to N-MORB,which are consistent with an enriched sub-<strong>arc</strong>mantle peridotite source. The patterns exhibitmarked negative slope <strong>from</strong> LILE to HFSEmarking high LILE/HFSE ratios, which areevident for <strong>the</strong> incorporation <strong>of</strong> higher amount <strong>of</strong>LILE enriched subduction-related fluids in <strong>the</strong>sub-<strong>arc</strong> magma source. The patterns also shownegative Nb anomalies and positive spikesgenerally on Ba and Sr, similar to those <strong>of</strong> island<strong>arc</strong>s <strong>volcanic</strong>s.Chondrite Normalized REE Diagrams: Chondritenormalized REE diagrams are generally preparedto determine <strong>the</strong> behavior <strong>of</strong> REE in <strong>the</strong> <strong>rocks</strong> andto constrain <strong>the</strong>ir source compositions, withreference to normalized chondritic values. The<strong>rocks</strong> show (Fig. 10) progressively enrichedLREE patterns as compared to average N-MORBREE pattern (after Sun and McDonough, 1989).The MREE (Sm, Eu and Gd) and HREE (Er &Yb) show variable depletion as compared toaverage N-MORB. Most <strong>of</strong> <strong>the</strong> samples havevariably developed positive Eu anomalies.5. <strong>Petrogenesis</strong>5.1. Nature <strong>of</strong> Parent MagmaThe orogenic andesites for which parentmagma was directly derived <strong>from</strong> <strong>the</strong> sub-<strong>arc</strong>mantle source must have higher MgO wt. % (> 6),higher Mg # (> 67), Low (< 1.1) FeOt/MgO ratiosand higher concentration <strong>of</strong> Ni (> 100 ppm) andCr (> 500 ppm) content (Gill, 1981). The <strong>Plio</strong>-<strong>Pleistocene</strong> andesites <strong>from</strong> <strong>the</strong> Chagai <strong>arc</strong> havelow concentrations <strong>of</strong> MgO (2.89-4.8 wt. %),higher values <strong>of</strong> FeOt/MgO ratios (1.28-2) andlow values for Mg # (50-56). However, oneandesite <strong>from</strong> KSV <strong>volcanic</strong>s has 5.90 wt. %MgO, Mg # = 64, and FeOt/MgO ratio = 1.01. Allanalyses also have low contents <strong>of</strong> Co (16-50), Ni(7-68) and have enhanced LILE/HFSE andLREE/REE ratios. Therefore, it is concluded that<strong>the</strong> parent magma <strong>of</strong> <strong>the</strong>se <strong>rocks</strong> has not beendirectly derived <strong>from</strong> an upper mantle peridotitesource, but underwent olivine fractionation enroute to eruption, most probably in an upper levelmagma chamber.The higher Zr/Y (5.07-9.08), Zr/Nb (17.75-28.75), Ti/V (24.22-33.91), La/Yb (9.07-11.87),Ta/Yb (0.11-1.18) and Th/Yb (1.69-2.25) ratios in<strong>the</strong>se <strong>volcanic</strong>s (Tables 1) are found close to <strong>the</strong>reported (Gill, 1981; Shervais, 1982; Wilson,1989) values <strong>of</strong> <strong>the</strong>se ratios in <strong>the</strong> <strong>volcanic</strong> <strong>rocks</strong><strong>of</strong> continental margin type <strong>arc</strong>s ra<strong>the</strong>r than insimilar <strong>rocks</strong> <strong>of</strong> oceanic island <strong>arc</strong>s.17
500100Koh-e-Sultan <strong>volcanic</strong>sBatal Koh <strong>volcanic</strong>sDam Koh <strong>volcanic</strong>sKoh-e-Dalil <strong>volcanic</strong>sSample / Primordial Mantle101N-MORB0.1Rb Ba K Nb Sr P Zr Ti YFig. 9. Primordial mantle normalized spider diagram for <strong>the</strong> <strong>Plio</strong>-<strong>Pleistocene</strong> <strong>volcanic</strong> <strong>rocks</strong> <strong>from</strong> <strong>the</strong>Chagai <strong>arc</strong>. The half filled square pattern is for average N-MORB. Average N-MORB andnormalization values are after Sun and McDounough (1989).500100Koh-e-Sultan <strong>volcanic</strong>sBatal Koh <strong>volcanic</strong>sDam Koh <strong>volcanic</strong>sKoh-e-Dalil <strong>volcanic</strong>sSample / Chondrite10N-MORB1La Ce Nd Sm Eu Gd Er YbFig. 10. Chondrite normalized REE diagram for <strong>the</strong> <strong>Plio</strong>-<strong>Pleistocene</strong> <strong>volcanic</strong> <strong>rocks</strong> <strong>from</strong> <strong>the</strong> Chagai <strong>arc</strong>.The half filled square pattern is for average N-MORB. Average N-MORB values are after Sunand McDounough (1989), whereas normalization values are after Nakamura (1974).18
5.2. Tectonic SettingA number <strong>of</strong> plots and tectonomagmaticdiscrimination diagrams based on major, minor ortrace elements are designed to study <strong>the</strong> parentmagma and tectonic setting <strong>of</strong> <strong>the</strong> <strong>volcanic</strong> <strong>rocks</strong>.Diagrams based on major elements or large ionlithophile (LIL) elements must be used withcaution, as <strong>the</strong>se elements are more mobile duringpost-magmatic alteration or metamorphicprocesses as compared to high field elements(Pe<strong>arc</strong>e and Can, 1973; Floyed and Winchister,1975; Weaver and Tarney, 1981).The FeO/MgO ratios generally show highervalues in tholeiitic assemblages for a given SiO 2content (Miyashiro; 1974; Gill, 1981). The SiO 2versus FeO/MgO plots (Miyashiro, 1974) for all<strong>the</strong> samples reveal that most <strong>of</strong> <strong>the</strong> <strong>Plio</strong>-<strong>Pleistocene</strong> <strong>volcanic</strong> <strong>rocks</strong> are calc-alkaline innature (Fig. 11A). To ascertain whe<strong>the</strong>r <strong>the</strong>studied <strong>rocks</strong> were erupted in an oceanic island<strong>arc</strong> environment or in a continental margin-type<strong>arc</strong> settings, <strong>the</strong> sample are plotted in Zr versusZr/Y plot (after Pe<strong>arc</strong>e, 1983). In this diagram(Fig. 11B), all <strong>the</strong> sample plot in continentalmargin-type <strong>arc</strong> domain. The discriminationdiagram based on trace element ratios isconsidered more au<strong>the</strong>ntic. The Th/Yb versusTa/Yb plot <strong>of</strong> Pe<strong>arc</strong>e, (1983) is widely used, notonly for <strong>the</strong> determination <strong>of</strong> tectonicenvironment but also for <strong>the</strong> estimation <strong>of</strong> nature<strong>of</strong> source (enriched or depleted), crustalcontamination, within-plate enrichment andfractionation, etc. A plot <strong>of</strong> <strong>the</strong> KSV <strong>volcanic</strong>s inthis diagram (Fig. 11C) confirms <strong>the</strong>ir continentalmargin-type <strong>arc</strong> affinities. The plot <strong>of</strong> <strong>the</strong> analysesin this diagram fur<strong>the</strong>r suggests that <strong>the</strong> parentmagma <strong>of</strong> <strong>the</strong>se <strong>volcanic</strong>s was generated by anenriched mantle source.The spider patterns (Fig. 9), which exhibitpositive spikes generally on K and Sr and markednegative anomalies on Nb, fur<strong>the</strong>r confirm <strong>the</strong>island <strong>arc</strong> signatures <strong>of</strong> <strong>the</strong> <strong>rocks</strong> (Pe<strong>arc</strong>e, 1982;Wilson 1989; Saunders et al., 1991). The markednegative Nb anomalies are explained by retention<strong>of</strong> this element in <strong>the</strong> residual mantle peridotitesource during its partial melting. The positivespikes or enrichment <strong>of</strong> certain LIL elements aregenerally considered to have formed byincorporation <strong>of</strong> <strong>the</strong>se elements in <strong>the</strong> source <strong>from</strong><strong>the</strong> subducting slab (Pe<strong>arc</strong>e, 1982; Wilson, 1989).5.3. Nature <strong>of</strong> <strong>the</strong> Source <strong>of</strong> Parent MagmaThe Zr versus Zr/Y diagram (Fig. 11D)provides useful information about <strong>the</strong> nature <strong>of</strong>source, degree <strong>of</strong> partial melting andfractionation, etc. Plots <strong>of</strong> <strong>the</strong> analyses in thisdiagram indicate that <strong>the</strong>se <strong>rocks</strong> are fractionated<strong>from</strong> 15 % partially melted enriched mantlesource. The plots also indicate that <strong>the</strong> KSV<strong>volcanic</strong>s were fractionated <strong>from</strong> a least enrichedsource as compared to KDV, DKV and BKV<strong>volcanic</strong>s, which were developed in progressivelyincreasing enriched sources. This diagram fur<strong>the</strong>rsuggests that KSV <strong>volcanic</strong>s are least fractionatedas compared to o<strong>the</strong>r <strong>volcanic</strong>s, which show anoverlapping increase in fractionation.6. Comparison with o<strong>the</strong>r <strong>arc</strong>sIn Table 2, average trace element chemistry<strong>of</strong> <strong>the</strong> <strong>Plio</strong>-<strong>Pleistocene</strong> calc-alkaline <strong>volcanic</strong><strong>rocks</strong> <strong>of</strong> <strong>the</strong> Chagai <strong>arc</strong> is compared with averagecalc-alkaline <strong>rocks</strong> <strong>of</strong> continental margin type<strong>arc</strong>s, including Andes, Zagros, Sunda, and Japan<strong>arc</strong>s, and oceanic island <strong>arc</strong>s including MarianaSouth West Pacific <strong>arc</strong>s, Fiji and New Britain<strong>arc</strong>s. This comparison shows close affinities <strong>of</strong><strong>the</strong> <strong>Plio</strong>-<strong>Pleistocene</strong> <strong>volcanic</strong> <strong>rocks</strong> <strong>of</strong> <strong>the</strong> Chagai<strong>arc</strong> with continental margin type <strong>arc</strong>s ra<strong>the</strong>r thanthose <strong>of</strong> <strong>the</strong> oceanic <strong>arc</strong>s. The average andesite<strong>from</strong> <strong>the</strong> Chagai <strong>arc</strong> shows closer similarity inLILE, HFSE and REE and <strong>the</strong>ir ratios with itscounterpart in Zagros <strong>arc</strong>, and less with Japanand Sunda <strong>arc</strong>s It greatly differs in <strong>the</strong>seelements with its counterpart in Andes <strong>arc</strong> (Table2).19
Table 2. A comparison <strong>of</strong> average trace element chemistry <strong>of</strong> <strong>Plio</strong>-<strong>Pleistocene</strong> calc-alkaline andesites<strong>from</strong> <strong>the</strong> Chagai <strong>arc</strong> with some <strong>arc</strong> related andesites <strong>of</strong> <strong>the</strong> worldTrace Chagai Continental Margin ArcsOceanic Island ArcsElements& RatioArc Japan1Sunda2Zagros3Andes4Mariana5New Britain6Fiji Arc7Ti 3320 4080 4732 5691 4800 58.90 4140Rb 19.54 36 39 23 75 12.67 11 20Sr 563 294 466 619 648 378 384 490Ba 384.73 318 437 271 886 348 185 522V 121.69 172 153.8 125 186 340 172Cr 79.77 67.5 19 104 48 23.67 34 39Co 21.88 21 18 19 31.33 16Ni 17.23 35.5 10.8 39 10.33 23 9Zr 97.12 123 84.80 195 70.6 34 114Y 13.92 19 21.6 12 24 12 18Nb 4.12 3 2.8 1.1 0.9 2Hf 1.58 3.8 5.46 2.3Ta 0.51 0.14 Th 2.06 3.4 1.8U 1.58 1.4 0.75Sc 19.12 18.6 13 39Cu 45.3 40 103 36La 12.73 9.7 12.85 15 38 30.6 3 11Ce 24.17 23 27.96 34.2 66.8 25.3 10 27Nd 11.30 12 16.07 23.33 Sm 2.28 3.3 3.45 2.75 20.37 Eu 0.82 0.90 1.12 1.01 17.1 Gd 2.63 18.03 Er 1.11 12.9 Yb 1.28 2.2 1.50 1.48 1.94 11.2 Ti/V 28.50 23.72 30.77 45.60 25.81 10.06 24.07Zr/Y 6.98 6.47 3.93 15.98 2.94 2.83 6.33Ti/Zr 34.85 33.17 55.80 29.23 67.99 100.59 36.32Zr/Nb 23.93 4140 30.29 64.18 37.78 57La/Yb 10.16 4.40 8.57 10.14 19.49 2.73 Ce/Yb 19.42 10.45 18.64 23.11 34.43 2.26 The values in column 1 are after Govindaraju, (1989), 2 after Wheller et al. (1987), 3 after Dupuy andDostal (1978), 4 afterEwart (1982), 5 after Woodhead (1988), 6 and 7 after Gill (1981). All <strong>the</strong> data in ppm.20
AKoh-e-Sultan <strong>volcanic</strong>sBatal Koh <strong>volcanic</strong>sDam Koh <strong>volcanic</strong>sKoh-e-Dalil <strong>volcanic</strong>sB5.010FeOt/MgO2.5TholeiiteZr/YContinental ArcOceanic ArcCalc-alkaline0.048 52 56 60 65SiO 2110 100 500ZrCDTh/Yb1010.10.01Oceanic Island ArcActive Continental MarginSCWFS = Subduction zone enrichmentC = Crustal contaminationW= Within plate enrichmentF = Fractional crystalizationD e p l e t e d m a n t l e s o u r c e E n r i c h e d m a n t l e s o u r c e0.01 0.1 1Ta/Yb10Z r / Y10TongaSource depletionOshimaSource enrichmentCarlsberg R.Alula fartak Tr.30%20%HawaiHawai15%15%Partial melting trendOpen system fractionationClosed system fractionationC 3Chondrite composition15 10 100 500Z rFig. 11 A to D. Various tectonomagmatic discrimination diagrams for <strong>the</strong> Pli-<strong>Pleistocene</strong> <strong>volcanic</strong> <strong>rocks</strong><strong>from</strong> <strong>the</strong> Chagai <strong>arc</strong> (see <strong>the</strong> text for details).7. DiscussionThe petrological and geochemical datapresented in this paper strongly suggest that <strong>the</strong><strong>Plio</strong>-<strong>Pleistocene</strong> <strong>volcanic</strong> <strong>rocks</strong> represent a calcalkalineassociation <strong>of</strong> continental margin-type <strong>arc</strong>and <strong>the</strong> parent magma <strong>of</strong> <strong>the</strong>se <strong>rocks</strong> wasfractionated <strong>from</strong> an enriched sub-<strong>arc</strong> mantlesource. The <strong>Plio</strong>-<strong>Pleistocene</strong> Koh-e-Sultanvolcanism and <strong>the</strong> synchronous volcanism in Iranare considered to be related with convergence <strong>of</strong>Arabian oceanic plate below <strong>the</strong> sou<strong>the</strong>rn margin<strong>of</strong> Afghan and Iran blocks, respectively (Jacob andQuittmeyer, 1979; Arthurton et al., 1979; Dykstraand Birnie, 1979: Dupuy and Dostal, 1978).Dykstra and Birnie (1979) have proposed asegmented Quaternary (now <strong>Plio</strong>-<strong>Pleistocene</strong>)subduction zone based on termination and <strong>of</strong>fset in<strong>the</strong> belt <strong>of</strong> <strong>the</strong>se <strong>volcanic</strong>s and distribution <strong>of</strong>earthquake epicenters in this region. Theyproposed four NS trending segments, designatedas A, B, C and D in Iranian and PakistaniBalochistan (Fig. 12), with a common hinge linenear <strong>the</strong> Makran coast. The two outer segments Aand D have shallow dips (10°- 20°) and are devoid<strong>of</strong> any <strong>volcanic</strong> activity, whereas <strong>the</strong> inner twosegments, B (38°-50°) and C (19°-20°), havesteeper dips and associated volcanism. Partialmelting in subducted oceanic crust usually takesplace at 110-173 km depth in <strong>the</strong> Beni<strong>of</strong> zone and21
<strong>the</strong> nature <strong>of</strong> parent magma is controlled by <strong>the</strong>dip angle <strong>of</strong> <strong>the</strong> subducted plate (Tatsumi andEggens, 1995). Therefore, <strong>the</strong> NW-SE trend <strong>of</strong> <strong>the</strong><strong>Plio</strong>-Pleistocne <strong>volcanic</strong> belt is attributed to <strong>the</strong>occurrence <strong>of</strong> volcanism in <strong>the</strong> B segment moresouthward, closer to <strong>the</strong> hinge line due to itssteeper depth as compared to <strong>the</strong> C segment.8. ConclusionThe petrogenetic studies <strong>of</strong> <strong>Plio</strong>-<strong>Pleistocene</strong><strong>volcanic</strong> <strong>rocks</strong> suggest that <strong>the</strong>y are calc-alkalinein nature and formed in a continental margin-type<strong>arc</strong> environment. Higher concentration <strong>of</strong> mostHFSE, REE and greatly enhanced Zr/Y, Ti/V,Ta/Yb, Th/Yb, La/Yb and Th/Yb ratio relative toN-MORB indicate that <strong>the</strong> parent magma <strong>of</strong> <strong>the</strong>se<strong>rocks</strong> was derived <strong>from</strong> an enriched sub-<strong>arc</strong>peridotite mantle source. The <strong>Plio</strong>-<strong>Pleistocene</strong>andesites have low MgO wt. %, Mg # (50-56),and and contents <strong>of</strong> Co, Ni, but enhancedLILE/HFSE and LREE/HREE ratios, whichsuggests that <strong>the</strong> source magma <strong>of</strong> <strong>the</strong>se <strong>rocks</strong>was not derived directly <strong>from</strong> an upper mantleperidotite source, but instead had undergoneolivine fractionation en route to eruption. The Zrversus Zr/Y studies suggest that <strong>the</strong> parent magmawas generated by about 15 % partial melting <strong>of</strong> anenriched sub-<strong>arc</strong> mantle source that fractionatedin an upper level magma chamber. It is alsosuggested that <strong>the</strong> Koh-e-Sultan <strong>volcanic</strong>s weregenerated by relatively higher degree <strong>of</strong> partialmelting <strong>of</strong> a least enriched sub-<strong>arc</strong> mantle sourceand exhibit minimum fractionation as comparedto <strong>the</strong> <strong>volcanic</strong>s in Batal Koh, Dam Koh and Kohe-KohDalil volcanoes. The latter shows <strong>the</strong>lowest degree <strong>of</strong> partial melting <strong>of</strong> a mostenriched sub-<strong>arc</strong> mantle source that underwentmore fractionation than <strong>the</strong> rest. A comparison <strong>of</strong>average calc-alkaline andesite <strong>from</strong> <strong>Plio</strong>-<strong>Pleistocene</strong> <strong>volcanic</strong>s <strong>of</strong> <strong>the</strong> Chagai <strong>arc</strong> with itscounterparts in some famous continental marginand oceanic island <strong>arc</strong>s <strong>of</strong> <strong>the</strong> world showrelatively more resemblance in LILE, HFSE andREE with Zagros, less with Japan and Sunda <strong>arc</strong>s,and least with its counterpart in <strong>the</strong> Andes <strong>arc</strong>.AcknowledgementsWe are highly indebted to Dr. Imran AhmadKhan, Director General, Geological Survey <strong>of</strong>Pakistan (GSP), Mr. S. Hasan Gauhar, ex-DirectorGeneral, GSP, and Mr. Tahir Karim (Director) <strong>of</strong><strong>the</strong> same Department for <strong>the</strong>ir support during fieldand laboratory rese<strong>arc</strong>h.E X P L A N A T I O N SSegment A Dip = ~10Segment B Dip = 38-50Segment C Dip = 19-28Segment D Dip =
ReferencesArthurton, R.S., Alam, G.S., Ahmed, S.A., Iqbal,S., 1979. Geological history <strong>of</strong> Alam Reg -Mashki Chah area, Chagai District,Balochistan. In Farah, A., DeJong, K.A.,(Eds.), Geodynamics <strong>of</strong> Pakistan. GeologicalSurvey <strong>of</strong> Pakistan, 325-331.Arthurton, R.S., Farah, A., Ahmed, W., 1982. TheLate Cretaceous-Cenozoic history <strong>of</strong> westernBalochistan, Pakistan - <strong>the</strong> nor<strong>the</strong>rn margin <strong>of</strong><strong>the</strong> Makran subduction complex. In Leggett, J.K., (Ed.), Trench Fore-Arc Geology,Geological Society <strong>of</strong> London SpecialPublication, 10, 343-385.Bakr, M.A., Jackson, R. O., 1964. Geological Map<strong>of</strong> Pakistan. Geological Survey <strong>of</strong> Pakistan,Quetta.Britzman, L., 1979. Fission track ages <strong>of</strong>intrusives <strong>of</strong> Chagai District, Balochistan,Pakistan: Unpublished M.A. <strong>the</strong>sis, DarmouthCollege, Honover, N. H., U.S.A.Dupuy, C., Dostal, J., 1978. Geochemistry <strong>of</strong> calcalkaline<strong>volcanic</strong> <strong>rocks</strong> <strong>from</strong> sou<strong>the</strong>astern Iran(Kouh-e-Shahsawaran). Journal <strong>of</strong>Volcanology and Geo<strong>the</strong>rmal Rese<strong>arc</strong>h., 4,363-373Dykstra, J. D., 1978. A geological study <strong>of</strong> ChagaiHills Balochistan, Pakistan using LANDSATdigital data. Unpublished Ph.D. Thesis,Dartmouth College, Hanover, N. H., U.S.A.Dykstra, J.D., Birnie, W., 1979. Segmentation <strong>of</strong><strong>the</strong> Quaternary subduction zone under <strong>the</strong>Balochistan region <strong>of</strong> Pakistan and Iran, InFarah, A., DeJong, K.A. (Eds.), Geodynamics<strong>of</strong> Pakistan. Geological Survey <strong>of</strong> Pakistan,319-323.Ewart, A., 1982. The mineralogy and petrology <strong>of</strong>Tertiary-Recent orogenic <strong>volcanic</strong> <strong>rocks</strong> withspecial reference to andesitic-basalticcompositional range, In Throp, R.S., (Ed.),Andesites: Orogenic Andesites and RelatedRocks. John Wiley and Sons, New York, 26-87.Farah, A., Abbas G., DeJong. K.A., Lawrence,R.D., 1984. Evolution <strong>of</strong> <strong>the</strong> Lithosphere inPakistan. Tectonophysics, 105, 207-227.Farah, A., Lawrence, R.D., DeJong. K.A., 1984.An overview <strong>of</strong> <strong>the</strong> tectonics <strong>of</strong> Pakistan, InHaq, B.U., Milliman, J.D., (Eds.), Marinegeology and oceanography <strong>of</strong> Arabian Sea andcoastal Pakistan. Van Nostrand ReinholdCompany, New York, 161-176.Floyd, P.A., Winchester, J.A., 1975. Magma typesand tectonic setting discrimination usingimmobile elements. Earth and PlanetaryScience Letters, 27, 211-218.Gill, J.B., 1981. Orogenic Andesites and PlateTectonics. Springer, Berlin, 189.Govindaraju, K., 1989. Geostandards Newsletter,Special Issue, Working Group on Analyticalstandards <strong>of</strong> minerals, ores and <strong>rocks</strong>. France,13, 114.Harker, A., 1909. The natural history <strong>of</strong> igneous<strong>rocks</strong>. Macmillan, New YorkHole, M.J., Saunder, A.D., Marriner, G.F., Tarney,J., 1984. Subduction <strong>of</strong> pelagic sediments;implication for <strong>the</strong> origin <strong>of</strong> Ce-anomalousbasalts <strong>from</strong> Mariana Islands. Journal <strong>of</strong>Geological Society <strong>of</strong> London, 141, 453-472.Imai, N., 1990. Multielement analysis <strong>of</strong> rock with<strong>the</strong> use <strong>of</strong> geological certified referencematerials by inductively coupled plasma massspectrometry. Analytical Science, 6, 389-385.Jacob, K.H., Quittmeyer, R.L., 1979. The Makranregion <strong>of</strong> Pakistan and Iran, In Farah, A.,DeJong, K.A. (eds.), Geodynamics <strong>of</strong>Pakistan. Geological Survey <strong>of</strong> Pakistan, 303-317.Jones, A.G., 1960. Reconnaissance Geology <strong>of</strong>Part <strong>of</strong> West Pakistan: A Colombo PlanCooperative Project, Govt. <strong>of</strong> Canada,Toronto, (Hunting Survey Corporation report)550.Kazmi, A.H., Jan, M.Q., 1997. Geology andtectonics <strong>of</strong> Pakistan. Graphic Publishers,Karachi.Le Bas, M.J., Le Maitre, R.W., Streckeisen, A.,Zanettin, B., 1986. A chemical classification <strong>of</strong><strong>volcanic</strong> <strong>rocks</strong> based on <strong>the</strong> total alkali silicadiagram. Journal <strong>of</strong> Petrology, 27, 745-750.Miyashiro, A., 1974. Volcanic rock series in island<strong>arc</strong>s and active continental margins. AmericanJournal <strong>of</strong> Science, 274, 321-355.Nakamura, N., 1974. Determination <strong>of</strong> REE, Ba,Fe, Mg, Na and K in carbonaceous andordinary chondrites. Geochimica etCosmochimca Acta, 38, 757-775.Ogg, J,G., Ogg, G., Gradstein, F.M., 2008. TheConcise Geological Time Scale, InternationalCommission on Stratigraphy(www.stratigraphy.org)23
Pe<strong>arc</strong>e, J.A., 1982. Trace elements characteristics<strong>of</strong> lavas <strong>from</strong> destructive plate boundaries. InThrop, R.S. (Ed.), Andesites: Orogenicandesites and related <strong>rocks</strong>. John Wiley andSons, New York, 525-548.Pe<strong>arc</strong>e, J.A., 1983. The role <strong>of</strong> subcontinentallithosphere in <strong>the</strong> magma genesis atdestructive plate margin, In Hawkes-worth,C.J., Norry, M.J., (Eds.), Continental basaltsand mantle xenoliths. Natwich Shiva, 230-249Saunders, A.D., Tarney, J., 1991. Back-<strong>arc</strong> basins.In: Floyd. P.A. (Ed.), Oceanic Basalts,Blackie, London, 219-263.Shareq, A., Chmyriov, V.M., Stazhilo-Alekseev,K.F., Dronov, V.I., Gannon, P.J., Lubemov,B.K., Kafarskiy, A.K.H., Malyarove, E.P.,1977. Mineral Resources <strong>of</strong> Afghanistan. (2nded.), Afghan Geological and Mines Survey,Afghanistan.Shervais, J.W. (1982). Ti versus V plots and <strong>the</strong>petogenesis <strong>of</strong> modern and ophiolitic lavas.Earth and Planetary Science Letters, 59, 101-108.Siddiqui, R.H., 1996. Magmatic evolution <strong>of</strong>Chagai-Raskoh <strong>arc</strong> terrane and its implicationfor porphyry copper mineralization.Geologica, 2, 87-119.Siddiqui, R.H., Khan, M.A., Naseem, M., 2002.Geology and petrogenesis <strong>of</strong> <strong>Plio</strong>cene to<strong>Pleistocene</strong> <strong>volcanic</strong> <strong>rocks</strong> <strong>from</strong> <strong>the</strong> Chagai<strong>arc</strong> Balochistan Pakistan. Published by <strong>the</strong>International Division, Geological Survey <strong>of</strong>India in <strong>the</strong> Vol. <strong>of</strong> Abstracts, Fourth SouthAsia Geological Congress (GEOSAS-IV).Siddiqui, R.H., 2004. Crustal evolution <strong>of</strong> <strong>the</strong>Chagai-Raskoh <strong>arc</strong> terrane, Balochistan,Pakistan. Unpublished Ph.D. Thesis, Centre <strong>of</strong>Excellence in Geology, University <strong>of</strong>Peshawar, Pakistan.Siddiqui, R.H., Khan, M.A., Jan M.Q., 2005.<strong>Petrogenesis</strong> <strong>of</strong> Eocene Lava flows <strong>from</strong> <strong>the</strong>Chagai Arc, Balochistan, Pakistan and itstectonic implications. Geol. Bulletin <strong>of</strong>University <strong>of</strong> Peshawar, 38, 163-187.Sillitoe, R.H., 1978. Metallogenic evolution <strong>of</strong> acollision mountain belt in Pakistan: apreliminary analysis. Journal <strong>of</strong> GeologicalSociety <strong>of</strong> London, 125, 377-387.Sun, S.S., McDonough, W.F., 1989. Chemical andisotopic systematics <strong>of</strong> ocean basalt,implication for mantle composition andprocesses. In Saunders, A.D., Torny, M.J.,(Eds.), Magmatism in <strong>the</strong> ocean basins.Journal <strong>of</strong> Geological Society <strong>of</strong> London(Special Publication), 42, 313-345.Tatsumi, Y., Eggins, S., 1995. Subduction ZoneMagmatism. Blackwell Science, Oxford,England, 211.Taylor, S.R., McLennan, S.M., 1985. Thecontinental crust: its composition andevolution. Blackwell, Oxford.Vredenburg, E.W., 1901. A geological sketch <strong>of</strong><strong>the</strong> Balochistan desert and part <strong>of</strong> EasternPersia. Geological Survey <strong>of</strong> India, Memoirs,302.Weaver, B.L., Tarney J., Windley, B., 1981.Geochemistry and petrogenesis <strong>of</strong> <strong>the</strong>Fiskenaesset anorthosite complex sou<strong>the</strong>rnWest Greenland: nature <strong>of</strong> <strong>the</strong> parent magma.Geochimica et Cosmochimica Acta, 45, 711-725.Wheller, G.E. Varne, R., Foden, J.D., Abbott,M.J., 1987. Geochemistry <strong>of</strong> Quaternary<strong>volcanic</strong>s in <strong>the</strong> Sunda-Bunda <strong>arc</strong> Indonesia,and three component genesis <strong>of</strong> island <strong>arc</strong>sbasaltic magma. Journal <strong>of</strong> Volcanology andGeo<strong>the</strong>rmal Rese<strong>arc</strong>h, 32, 137-160.Wilson, M., 1989. Igneous <strong>Petrogenesis</strong>. Unwinand Hyman, London, 466.Winchester, J.A., Floyd, P.A., 1977. Geochemicaldiscrimination <strong>of</strong> different magma series and<strong>the</strong>ir differentiation products using immobileelements: Chemical Geology, 20, 325-343.Woodhead, J.D., 1988. The origin <strong>of</strong> geochemicalvariations in Mariana lavas. A general modelfor petrogenesis in intra oceanic island <strong>arc</strong>.Journal <strong>of</strong> Petrology, 29, 805-830.24