State of the Sector Report 2010 - Microfinance Gateway
State of the Sector Report 2010 - Microfinance Gateway
State of the Sector Report 2010 - Microfinance Gateway

You also want an ePaper? Increase the reach of your titles
YUMPU automatically turns print PDFs into web optimized ePapers that Google loves.
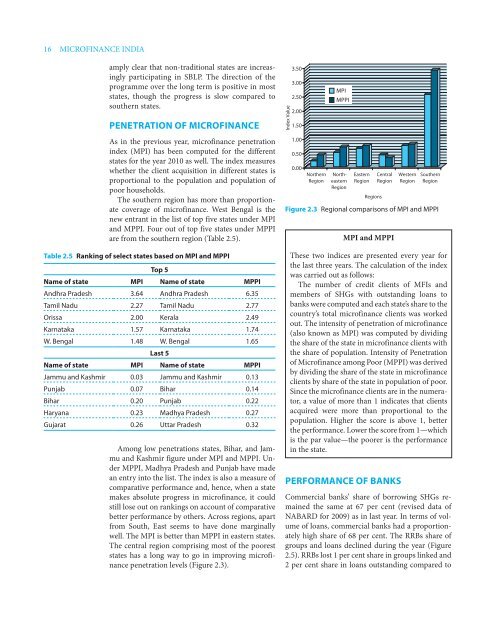
16 MICROFINANCE INDIAamply clear that non-traditional states are increasinglyparticipating in SBLP. The direction <strong>of</strong> <strong>the</strong>programme over <strong>the</strong> long term is positive in moststates, though <strong>the</strong> progress is slow compared tosou<strong>the</strong>rn states.Penetration <strong>of</strong> micr<strong>of</strong>inanceAs in <strong>the</strong> previous year, micr<strong>of</strong>inance penetrationindex (MPI) has been computed for <strong>the</strong> differentstates for <strong>the</strong> year <strong>2010</strong> as well. The index measureswhe<strong>the</strong>r <strong>the</strong> client acquisition in different states isproportional to <strong>the</strong> population and population <strong>of</strong>poor households.The sou<strong>the</strong>rn region has more than proportionatecoverage <strong>of</strong> micr<strong>of</strong>inance. West Bengal is <strong>the</strong>new entrant in <strong>the</strong> list <strong>of</strong> top five states under MPIand MPPI. Four out <strong>of</strong> top five states under MPPIare from <strong>the</strong> sou<strong>the</strong>rn region (Table 2.5).Table 2.5 Ranking <strong>of</strong> select states based on MPI and MPPITop 5Name <strong>of</strong> state MPI Name <strong>of</strong> state MPPIAndhra Pradesh 3.64 Andhra Pradesh 6.35Tamil Nadu 2.27 Tamil Nadu 2.77Orissa 2.00 Kerala 2.49Karnataka 1.57 Karnataka 1.74W. Bengal 1.48 W. Bengal 1.65Last 5Name <strong>of</strong> state MPI Name <strong>of</strong> state MPPIJammu and Kashmir 0.03 Jammu and Kashmir 0.13Punjab 0.07 Bihar 0.14Bihar 0.20 Punjab 0.22Haryana 0.23 Madhya Pradesh 0.27Gujarat 0.26 Uttar Pradesh 0.32Among low penetrations states, Bihar, and Jammuand Kashmir figure under MPI and MPPI. UnderMPPI, Madhya Pradesh and Punjab have madean entry into <strong>the</strong> list. The index is also a measure <strong>of</strong>comparative performance and, hence, when a statemakes absolute progress in micr<strong>of</strong>inance, it couldstill lose out on rankings on account <strong>of</strong> comparativebetter performance by o<strong>the</strong>rs. Across regions, apartfrom South, East seems to have done marginallywell. The MPI is better than MPPI in eastern states.The central region comprising most <strong>of</strong> <strong>the</strong> pooreststates has a long way to go in improving micr<strong>of</strong>inancepenetration levels (Figure 2.3).Index Value3.503.002.502.001.501.000.500.00Nor<strong>the</strong>rnRegionMPIMPPINor<strong>the</strong>asternRegionEasternRegionRegionsCentralRegionFigure 2.3 Regional comparisons <strong>of</strong> MPI and MPPIMPI and MPPIThese two indices are presented every year for<strong>the</strong> last three years. The calculation <strong>of</strong> <strong>the</strong> indexwas carried out as follows:The number <strong>of</strong> credit clients <strong>of</strong> MFIs andmembers <strong>of</strong> SHGs with outstanding loans tobanks were computed and each state’s share to <strong>the</strong>country’s total micr<strong>of</strong>inance clients was workedout. The intensity <strong>of</strong> penetration <strong>of</strong> micr<strong>of</strong>inance(also known as MPI) was computed by dividing<strong>the</strong> share <strong>of</strong> <strong>the</strong> state in micr<strong>of</strong>inance clients with<strong>the</strong> share <strong>of</strong> population. Intensity <strong>of</strong> Penetration<strong>of</strong> Micr<strong>of</strong>inance among Poor (MPPI) was derivedby dividing <strong>the</strong> share <strong>of</strong> <strong>the</strong> state in micr<strong>of</strong>inanceclients by share <strong>of</strong> <strong>the</strong> state in population <strong>of</strong> poor.Since <strong>the</strong> micr<strong>of</strong>inance clients are in <strong>the</strong> numerator,a value <strong>of</strong> more than 1 indicates that clientsacquired were more than proportional to <strong>the</strong>population. Higher <strong>the</strong> score is above 1, better<strong>the</strong> performance. Lower <strong>the</strong> score from 1—whichis <strong>the</strong> par value—<strong>the</strong> poorer is <strong>the</strong> performancein <strong>the</strong> state.Performance <strong>of</strong> BanksWesternRegionSou<strong>the</strong>rnRegionCommercial banks’ share <strong>of</strong> borrowing SHGs remained<strong>the</strong> same at 67 per cent (revised data <strong>of</strong>NABARD for 2009) as in last year. In terms <strong>of</strong> volume<strong>of</strong> loans, commercial banks had a proportionatelyhigh share <strong>of</strong> 68 per cent. The RRBs share <strong>of</strong>groups and loans declined during <strong>the</strong> year (Figure2.5). RRBs lost 1 per cent share in groups linked and2 per cent share in loans outstanding compared to