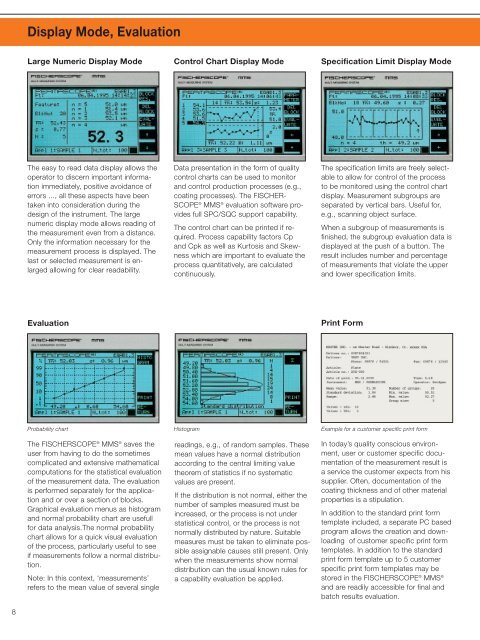
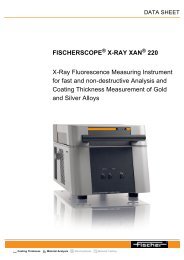
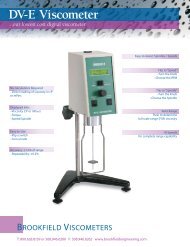
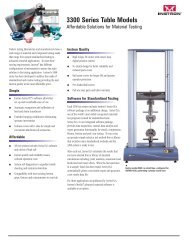
Display Mode, EvaluationLarge Numeric Display ModeControl Chart Display ModeSpecification Limit Display ModeThe easy to read data display allows theoperator to discern important informationimmediately, positive avoidance oferrors ..., all these aspects have beentaken into consideration during thedesign of the instrument. The largenumeric display mode allows reading ofthe measurement even from a distance.Only the information necessary for themeasurement process is displayed. Thelast or selected measurement is enlargedallowing for clear readability.Data presentation in the form of qualitycontrol charts can be used to monitor<strong>and</strong> control production processes (e.g.,coating processes). The FISCHER-SCOPE ® MMS ® evaluation software providesfull SPC/SQC support capability.The control chart can be printed if required.Process capability factors Cp<strong>and</strong> Cpk as well as Kurtosis <strong>and</strong> Skewnesswhich are important to evaluate theprocess quantitatively, are calculatedcontinuously.The specification limits are freely selectableto allow for control of the processto be monitored using the control chartdisplay. <strong>Measurement</strong> subgroups areseparated by vertical bars. Useful for,e.g., scanning object surface.When a subgroup of measurements isfinished, the subgroup evaluation data isdisplayed at the push of a button. Theresult includes number <strong>and</strong> percentageof measurements that violate the upper<strong>and</strong> lower specification limits.EvaluationPrint FormProbability chartThe FISCHERSCOPE ® MMS ® saves theuser from having to do the sometimescomplicated <strong>and</strong> extensive mathematicalcomputations for the statistical evaluationof the measurement data. The evaluationis performed separately for the application<strong>and</strong> or over a section of blocks.Graphical evaluation menus as histogram<strong>and</strong> normal probability chart are usefullfor data analysis.The normal probabilitychart allows for a quick visual evaluationof the process, particularly useful to seeif measurements follow a normal distribution.Note: In this context, ‘measurements’refers to the mean value of several singleHistogramreadings, e.g., of r<strong>and</strong>om samples. Thesemean values have a normal distributionaccording to the central limiting valuetheorem of statistics if no systematicvalues are present.If the distribution is not normal, either thenumber of samples measured must beincreased, or the process is not understatistical control, or the process is notnormally distributed by nature. Suitablemeasures must be taken to eliminate possibleassignable causes still present. Onlywhen the measurements show normaldistribution can the usual known rules fora capability evaluation be applied.Example for a customer specific print formIn today’s quality conscious environment,user or customer specific documentationof the measurement result isa service the customer expects from hissupplier. Often, documentation of thecoating thickness <strong>and</strong> of other materialproperties is a stipulation.In addition to the st<strong>and</strong>ard print formtemplate included, a separate PC basedprogram allows the creation <strong>and</strong> downloadingof customer specific print formtemplates. In addition to the st<strong>and</strong>ardprint form template up to 5 customerspecific print form templates may bestored in the FISCHERSCOPE ® MMS ®<strong>and</strong> are readily accessible for final <strong>and</strong>batch results evaluation.8
Applications®Application ExampleElectroplating IndustryApplication Example PerformanceCritical Aluminum Alloy ComponentsApplication ExampleAutomated <strong>Measurement</strong> DeviceThe probe ESD2 is ideal for coating thickness measurementson very rough, electroplated surfaces.Decorative finishes as well as structuralintegrity can be measured.<strong>Measurement</strong> of the chromium coating on pneumaticcylinders with the probe V2EGA06H mounted inthe motorized support st<strong>and</strong> V12.In a plating shop, coating thicknessmeasurements are performed on variouscustomer parts with different shapes,sizes <strong>and</strong> material combinations. TheFISCHERSCOPE ® MMS ® with modulePERMASCOPE ® is the ideal instrumentfor this environment. In this case, theMMS ® can be equipped with• probes suitable for the respectiveapplications;• suitable supports fixtures <strong>and</strong> a measuringst<strong>and</strong> to assure precise positioningof small test specimen, such asfasteners, stampings, etc;• a personal computer for data acquisitionto satisfy networking requirementsor data analysis using third party software.In the case of repetitive measurementtasks involving the same products, theproper application is retrieved at thepush of a button which loads all application-specificcalibration parameters. Themeasurement is performed in dialog withthe measuring system. The operator canevaluate the measurements immediatelyor store the data in one of 50 applicationmemories for later evaluation. Whenthe measurement task is finished, a customer-specificmeasurement report canbe printed. The print form template forthis report is also saved in the specificapplication memory. The operator canfocus on the task of measuring; theinstrument performs all other functions.Some aluminum alloy components usedin the aerospace or automotive industrieshave a clearly defined spectrum ofphysical properties. Non-destructivemeasurement of the performance relatedstructural condition of the component isrequired as part of a quality assuranceprogram. Additionally, these componentsoften receive some form of surfacetreatment: decorative finishes or anodiccoatings (alloy wheels), hard anodizing(machine parts, extrusions), or electroplatedfinishes for certain applications.The FISCHERSCOPE ® MMS ® with thePERMASCOPE ® <strong>and</strong> SIGMASCOPE ®modules is ideal to control the quality ofthese coatings.• The PERMASCOPE ® module is usedto measure the thickness of anodized<strong>and</strong> non-conductive coatings.• The SIGMASCOPE ® module is used tomeasure the electrical conductivity,which is closely related to structuralcondition <strong>and</strong> can be used as a correlatingparameter for sturdiness. Additionally,this module can be used tomeasure chromium coatings on aluminum.The versatility <strong>and</strong> measurement accuracyof the instrument make theFISCHERSCOPE ® MMS ® the ideal inspectiontool for the quality control ofmany other performance critical coatingapplications.An uninterrupted, continuous testing ofthe coating thickness on all coated componentscan be realized only with fullyautomated measurement systems. Practicalexperience shows that this requiresspecially designed measurementprobes. They must be able to withst<strong>and</strong>much greater continuous loads thanmanually used probes. Typical probesdesigned for manual measurementswear prematurely due to measurementcycles in rapid succession <strong>and</strong> theresultant overall significantly highernumber of measurements within shortperiods.The measurement probe V2EGA06H,that can be connected to the FISCHER-SCOPE ® MMS ® with the PERMA-SCOPE ® module is specifically designedfor continuous measurements, <strong>and</strong> overlong periods does not show indicationsof wear. Even after several million measurementcycles with automatic probeplacement, e.g., using pneumatic cylinders,the measurements are accurate<strong>and</strong> reproducible such that even smallcoating thickness fluctuations along thesurface line or the circumference of acylindrical specimen, are still detectable.In this manner, numerous measurementapplications can now be fully automated<strong>and</strong> an uninterrupted 100% quality testcan be realized, for example, in thechromium plating or galvanizing processof cylindrical components or sheetmetal.9