Housing and Property Markets in Germany 2011 - Bundesinstitut für ...
Housing and Property Markets in Germany 2011 - Bundesinstitut für ...
Housing and Property Markets in Germany 2011 - Bundesinstitut für ...

You also want an ePaper? Increase the reach of your titles
YUMPU automatically turns print PDFs into web optimized ePapers that Google loves.
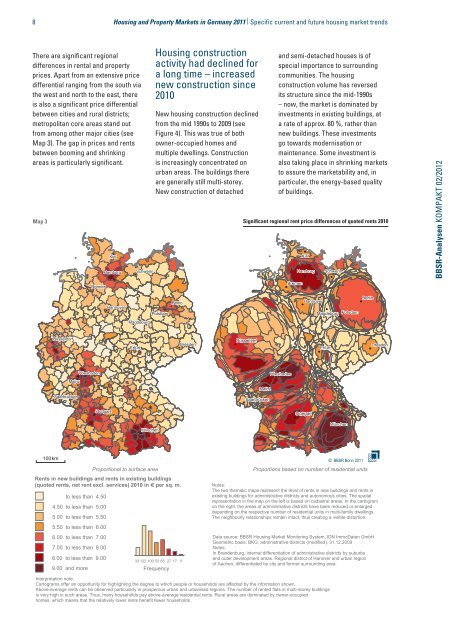
8 <strong>Hous<strong>in</strong>g</strong> <strong>and</strong> <strong>Property</strong> <strong>Markets</strong> <strong>in</strong> <strong>Germany</strong> <strong>2011</strong> | Specific current <strong>and</strong> future hous<strong>in</strong>g market trendsThere are significant regionaldifferences <strong>in</strong> rental <strong>and</strong> propertyprices. Apart from an extensive pricedifferential rang<strong>in</strong>g from the south viathe west <strong>and</strong> north to the east, thereis also a significant price differentialbetween cities <strong>and</strong> rural districts;metropolitan core areas st<strong>and</strong> outfrom among other major cities (seeMap 3). The gap <strong>in</strong> prices <strong>and</strong> rentsbetween boom<strong>in</strong>g <strong>and</strong> shr<strong>in</strong>k<strong>in</strong>gareas is particularly significant.<strong>Hous<strong>in</strong>g</strong> constructionactivity had decl<strong>in</strong>ed fora long time – <strong>in</strong>creasednew construction s<strong>in</strong>ce2010New hous<strong>in</strong>g construction decl<strong>in</strong>edfrom the mid 1990s to 2009 (seeFigure 4). This was true of bothowner-occupied homes <strong>and</strong>multiple dwell<strong>in</strong>gs. Constructionis <strong>in</strong>creas<strong>in</strong>gly concentrated onurban areas. The build<strong>in</strong>gs thereare generally still multi-storey.New construction of detached<strong>and</strong> semi-detached houses is ofspecial importance to surround<strong>in</strong>gcommunities. The hous<strong>in</strong>gconstruction volume has reversedits structure s<strong>in</strong>ce the mid-1990s– now, the market is dom<strong>in</strong>ated by<strong>in</strong>vestments <strong>in</strong> exist<strong>in</strong>g build<strong>in</strong>gs, ata rate of approx. 80 %, rather thannew build<strong>in</strong>gs. These <strong>in</strong>vestmentsgo towards modernisation orma<strong>in</strong>tenance. Some <strong>in</strong>vestment isalso tak<strong>in</strong>g place <strong>in</strong> shr<strong>in</strong>k<strong>in</strong>g marketsto assure the marketability <strong>and</strong>, <strong>in</strong>particular, the energy-based qualityof build<strong>in</strong>gs.Map 3 Significant regional rent price differences of quoted rents 2010BremenKielHamburgSchwer<strong>in</strong>BremenKielHamburg Schwer<strong>in</strong>BBSR-Analysen KOMPAKT 02/2012HannoverBerl<strong>in</strong>HannoverPotsdam Magdeburg PotsdamMagdeburgBerl<strong>in</strong>Düsseldorf DüsseldorfDresden DresdenErfurt ErfurtWiesbaden WiesbadenMa<strong>in</strong>zSaarbrückenMa<strong>in</strong>zSaarbrückenStuttgart StuttgartMünchenMünchen100km © BBSR Bonn <strong>2011</strong>Proportional to surface areaProportions based on number of residential unitsRents <strong>in</strong> new build<strong>in</strong>gs <strong>and</strong> rents <strong>in</strong> exist<strong>in</strong>g build<strong>in</strong>gs(quoted rents, net rent excl. services) 2010 <strong>in</strong> € per sq. m.Notes:The two thematic maps represent the level of rents <strong>in</strong> new build<strong>in</strong>gs <strong>and</strong> rents <strong>in</strong>to less than 4.50exist<strong>in</strong>g build<strong>in</strong>gs for adm<strong>in</strong>istrative districts <strong>and</strong> autonomous cities. The spatialrepresentation <strong>in</strong> the map on the left is based on cadastral areas. In the cartogram4.50 to less than 5.00 on the right, the areas of adm<strong>in</strong>istrative districts have been reduced or enlargeddepend<strong>in</strong>g on the respective number of residential units <strong>in</strong> multi-family dwell<strong>in</strong>gs.5.00 to less than 5.50 The neighbourly relationships rema<strong>in</strong> <strong>in</strong>tact, thus creat<strong>in</strong>g a visible distortion.5.50 to less than 6.006.00 to less than 7.00Data source: BBSR <strong>Hous<strong>in</strong>g</strong> Market Monitor<strong>in</strong>g System, IDN ImmoDaten GmbHGeometric basis: BKG, adm<strong>in</strong>istrative districts (modified), 31.12.20097.00 to less than 8.00Notes:In Br<strong>and</strong>enburg, <strong>in</strong>ternal differentiation of adm<strong>in</strong>istrative districts by suburbs 8.00 to less than 9.00 <strong>and</strong> outer development areas. Regional district of Hanover <strong>and</strong> urban region33 122 100 53 65 27 17 5of Aachen, differentiated by city <strong>and</strong> former surround<strong>in</strong>g area.9.00 <strong>and</strong> more FrequencyInterpretation note:Cartograms offer an opportunity for highlight<strong>in</strong>g the degree to which people or households are affected by the <strong>in</strong>formation shown. Above-average rents can be observed particularly <strong>in</strong> prosperous urban <strong>and</strong> urbanised regions. The number of rented flats <strong>in</strong> multi-storey build<strong>in</strong>gs is very high <strong>in</strong> such areas. Thus, many households pay above-average residential rents. Rural areas are dom<strong>in</strong>ated by owner-occupied homes, which means that the relatively lower rents benefit fewer households.