Production Sharing Contracts - AIPN
Production Sharing Contracts - AIPN
Production Sharing Contracts - AIPN

Create successful ePaper yourself
Turn your PDF publications into a flip-book with our unique Google optimized e-Paper software.
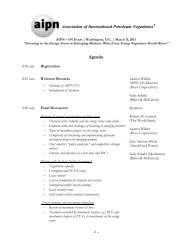
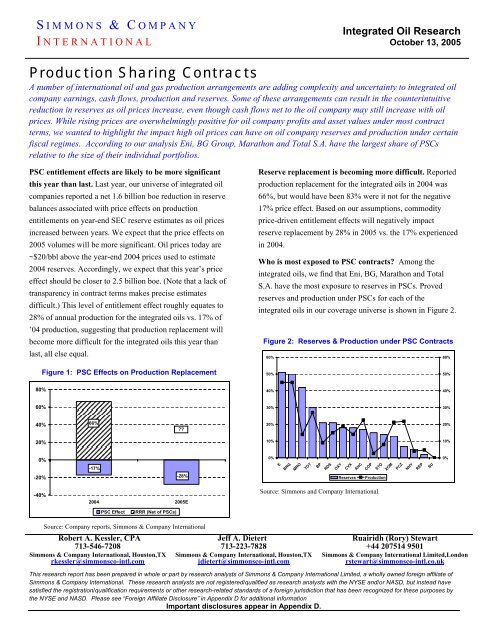
S IMMONS & C OMPANYI NTERNATIONALIntegrated Oil ResearchOctober 13, 2005<strong>Production</strong> <strong>Sharing</strong> <strong>Contracts</strong>A number of international oil and gas production arrangements are adding complexity and uncertainty to integrated oilcompany earnings, cash flows, production and reserves. Some of these arrangements can result in the counterintuitivereduction in reserves as oil prices increase, even though cash flows net to the oil company may still increase with oilprices. While rising prices are overwhelmingly positive for oil company profits and asset values under most contractterms, we wanted to highlight the impact high oil prices can have on oil company reserves and production under certainfiscal regimes. According to our analysis Eni, BG Group, Marathon and Total S.A. have the largest share of PSCsrelative to the size of their individual portfolios.PSC entitlement effects are likely to be more significantthis year than last. Last year, our universe of integrated oilcompanies reported a net 1.6 billion boe reduction in reservebalances associated with price effects on productionentitlements on year-end SEC reserve estimates as oil pricesincreased between years. We expect that the price effects on2005 volumes will be more significant. Oil prices today are~$20/bbl above the year-end 2004 prices used to estimate2004 reserves. Accordingly, we expect that this year’s priceeffect should be closer to 2.5 billion boe. (Note that a lack oftransparency in contract terms makes precise estimatesdifficult.) This level of entitlement effect roughly equates to28% of annual production for the integrated oils vs. 17% of’04 production, suggesting that production replacement willbecome more difficult for the integrated oils this year thanlast, all else equal.Reserve replacement is becoming more difficult. Reportedproduction replacement for the integrated oils in 2004 was66%, but would have been 83% were it not for the negative17% price effect. Based on our assumptions, commodityprice-driven entitlement effects will negatively impactreserve replacement by 28% in 2005 vs. the 17% experiencedin 2004.Who is most exposed to PSC contracts? Among theintegrated oils, we find that Eni, BG, Marathon and TotalS.A. have the most exposure to reserves in PSCs. Provedreserves and production under PSCs for each of theintegrated oils in our coverage universe is shown in Figure 2.Figure 2: Reserves & <strong>Production</strong> under PSC <strong>Contracts</strong>60%60%Figure 1: PSC Effects on <strong>Production</strong> Replacement50%50%80%40%40%60%30%30%40%66%??20%20%20%10%10%0%-20%-17%-28%0%EBRGMROTOTBPRDSOXYCVXAHCReserves<strong>Production</strong>COPSTOXOMPCZNHYREPSU0%-40%2004 2005ESource: Simmons and Company International.PSC EffectRRR (Net of PSCs)Source: Company reports, Simmons & Company InternationalRobert A. Kessler, CPA713-546-7208Simmons & Company International, Houston,TXrkessler@simmonsco-intl.comJeff A. Dietert713-223-7828Simmons & Company International, Houston,TXjdietert@simmonsco-intl.comRuairidh (Rory) Stewart+44 207514 9501Simmons & Company International Limited,Londonrstewart@simmonsco-intl.co.ukThis research report has been prepared in whole or part by research analysts of Simmons & Company International Limited, a wholly owned foreign affiliate ofSimmons & Company International. These research analysts are not registered/qualified as research analysts with the NYSE and/or NASD, but instead havesatisfied the registration/qualification requirements or other research-related standards of a foreign jurisdiction that has been recognized for these purposes bythe NYSE and NASD. Please see “Foreign Affiliate Disclosure” in Appendix D for additional informationImportant disclosures appear in Appendix D.
Who has/will experience the most significant reservewrite-downs? In general, we find that the companies withthe heaviest percentage of PSCs in their reserve balanceexperienced the most significant oil price-related negativereserve revisions in 2004. However, there were notableexceptions. ExxonMobil had the most significant adjustmentlast year, despite having only group-average exposure toPSCs. However, it is notable that ’04 was the first year XOMmoved to a year-end price assumption for reservecalculations (up from a significantly lower, althoughundisclosed long-term planning assumption). Conversely, wefound no negative price-related revisions in Marathon’s ’04reserve report, despite the company’s 3 rd place PSC exposureranking among the integrated oils. This is likely due in partto some unique timing aspects of its Equatorial Guineacontracts, which make up the majority of MRO’s PSCexposure. Figure 3 also includes an estimated PSC writedownfor ’05 based on net interests in PSCs. While we havemade an attempt at quantifying specific company exposures,precise estimates are very difficult, given the lack ofdisclosure regarding contractual terms.Figure 3: Reserve Adjustments due to PSC Effects% of production60%50%40%30%20%10%0%BRGETOTMROBPCVXSTOXOMOXYCOPAHCRDSREPNHYPCZSU'04 Reserve Adjustments '05E AdjustmentSource: Simmons and Company International.What the companies are saying about PSCs. We findrelatively little disclosure relating to PSCs coming straightfrom the integrated oils. That said, below is a list ofcompany-specific guidance, where available.Majors:BP: With their release of 2Q'05 earnings in July, 2005, BPqualified their long-term production growth aspirations withregard to PSC effects. Specifically, the company noted that250 kbpd of entitled production would be lost by 2010 on thebasis of a $40/bbl Brent price deck vs. official guidance(which is set on a $20/bbl price assumption). For 2005, BPexpects that full-year production will be 50 kbpd lower on a$50/bbl price deck vs. a $20/bbl assumption. Also in July, BPnoted that 9% of current production is exposed to PSCcontracts, while 20% of production will be exposed by 2010.BP had previously noted in February, 2003 that 10% ofproduction was under the terms of PSAs. With their 2004reserve report, BP witnessed a 300 mmboe net reduction inreserves on an SEC proved basis (1.6% of the YE-'04balance) as the result of moving to a $40/bbl pricingassumption from a $30/bbl price assumption. While thecompany mentioned some offsetting effects associated withthe lengthening of productive life for some mature fields,these effects were far outweighed by the loss of entitlementof PSC contracts. In the UK, BP reported reservereplacement of 110% using long-term pricing assumptions of$20/bbl Brent and $3.50/mcf Henry Hub vs. 89% in the U.S.,adjusted for the aforementioned pricing effects. According tothe company, 21% of ’04 proved reserves are under the termsof PSCs.Chevron: Chevron has noted that approximately 20% ofproduction outside of North America is under PSAarrangements (pre-UCL), with particular exposure toIndonesia, where approximately 10% of the company’sproduction is located. Other PSA exposure includesKarachaganak (in Kazakhstan), the Philippines (Malampaya),Trinidad (Dolphin), Congo, China (Bohai area) and AngolaBlocks 2 and 14 (although not Block 0, where the bulk ofCVX’s existing Angolan production is located). Of the UCLassets acquired, we estimate that approximately 23% islocated in PSC arrangements, including oil and gasproduction in Indonesia, Myanmar and Bangladesh. Whencombined with CVX on a pro-forma basis, the result is anaverage 14% production exposure to PSCs for CVX + UCL.Chevron does not disclose the percentage of reserves heldunder PSC arrangements. However, we estimate this amountto be roughly 18% of the company’s total proved reservebalance, including UCL.2S IMMONS & C OMPANY I NTERNATIONAL
European Mid-Caps (continued)Statoil: Company has 14% of 2004 reserves and 8% ofproduction under PSC contracts. The growing importance ofAlgeria and Angola in particular will see this proportionincrease. Statoil provides little guidance as to production orreserve impacts from price effects although we note thecompany estimated a $0.70/boe reduction in 2002-2004 F&Dcosts at constant prices. This suggests a ~90mm boe negativereserve revision from pricing over these three years with themajority likely taken in 2004.worldwide reserves. On a production basis, PCZ hasapproximately 22% exposed to these areas.Suncor: Suncor does not have any production or reservesunder the terms of a PSC arrangement.Canadian Mid-Caps:Petro-Canada: According to Petro-Canada’s 2004 40-F, 28mmb of crude oil reserves and 13 bcf of natural gas reservesin the North Africa Near East business segment and 225 bcfof natural gas reserves in Trinidad are under PSCarrangements. This represents approximately 7% of net4S IMMONS & C OMPANY I NTERNATIONAL
Understanding <strong>Production</strong> <strong>Sharing</strong> <strong>Contracts</strong>The Issue. As OECD country oil and gas reserves decline,International Oil Companies (IOCs) are increasingly lookingelsewhere to access resources and offset dwindling OECDproduction profiles. As they do, IOCs are faced with a litanyof fiscal regimes and contract structures. One such structure,generally referred to as a <strong>Production</strong> <strong>Sharing</strong> Contract (PSC),specifies that the IOC be reimbursed for costs incurred toconstruct an oil and gas project with barrels produced fromthat project (as opposed to taking a cash deduction forincome tax purposes). As oil prices increase, it generallytakes fewer barrels of oil to reimburse the IOC for its costsand as a result, the company’s share of reserves andproduction is reduced. Other PSC terms, such as profitsharing percentages that vary with oil prices, can add furthercomplexity to the analysis. In most cases, specific contractterms are not disclosed, adding uncertainty to reservevaluation.Figure 4: Project IRRs vs. Oil Prices60%from $30/bbl to $60/bbl, the IRR of our example WestAfrican PSC increases by 10%, compared to a 22% increaseunder the U.S. fiscal structure in the Gulf of Mexico, a 12%increase in Norway and a 4% increase in Iran. As thisexample highlights, PSC contract NPVs can be less sensitiveto oil prices than some traditional tax regimes (such as theU.S.) while remaining similar to others (such as Norway).We also note that PSC terms vary substantially from contractto contract, resulting in less visibility and more variabilityrelative to static, concessionary regimes such as the U.S. andNorway.Figure 5: Fiscal Regime AssumptionsWAF USA Norway IranModel Model Model ModelRoyalty Rate: 0% 13% 0% 0%Severance Taxes: 0% 0% 0% 0%Capital Deduction Rate (years): 5 5 5 1Cost Recovery Limit: 65% 100% 100% 60%Capital Cost Uplift: 50% 0% 7.5% 25%Profit Oil Rate: 30% 100% 100% 0%Provincial Taxes: 0% 0% 0% 0%Income Tax Rate: 40% 35% 78% 0%NOC Carry: 40% 0% 0% 0%Cost of Carry Recovery: 0% 0% 0% 7%Source: Simmons and Company International.IRR50%40%30%20%10%0%$18$20$22$24$26$28$30$32WTI Oil Price Benchmark ($/bbl)$34$36$38$40$42$44$46$48$50$52$54$56$58$60West Africa U.S. Gulf of Mexico Norway IranSource: Simmons & Company InternationalProject values (PSC vs. Concession). The terms associatedwith PSC structures do not generally result in a complete lackof upside potential for IOCs in a strong commodity priceenvironment and IOC cash flows under most contracts stillincrease with oil prices. That said, on average, variableentitlement terms under PSC contracts tend to reduce projectsensitivity to oil prices (in both directions) since the hostgovernment generally shares in the upside potential anddownside risk to a larger extent than under traditionalconcessionary fiscal regimes. Figure 4 illustrates how theIRR of a hypothetical project might vary with oil pricesunder four different fiscal regimes: an example West AfricaPSC, the U.S. Gulf of Mexico, Norway and Iran. (Theseeconomics are based on a “standard project” to illustratefiscal effects rather than an illustration of project profitabilityin any specific region). We note that as oil prices increaseVisibility in a concessionary regime. In concessionary oiland gas regimes, the IOC’s share of production generallyremains stable in different oil price environments, althoughthe company is, of course, still obligated to pay income taxes.In addition, most are exposed to some form of royaltypayment, usually a percentage of oil and gas production thatis owed to the landowner or host government. In the U.S., forinstance, participants are accustomed to the standard 1/8 throyalty share. In these concessionary regimes, income taxrates, royalty interests and applicable exemptions or taxcredits (in the U.S. deepwater, for instance) are generally apart of official government legislation and therefore visible tothe general public, resulting in less uncertainty whenmodeling the company externally.Undisclosed and varied terms in a contractual regime.Outside of the OECD, IOCs are still able to operate in severalcountries, but more often under specific contract terms, ratherthan a general legal concession. These contracts take onmany forms and vary quite substantially from country tocountry and even block to block within the same country.Most are generally split into two parts, a “cost oil” tranche,which allows the contracting company/IOC to recover thecapital invested in the project along with certain operatingcosts, and a “profit oil” tranche which consists of the residualprofits after cost recovery.S IMMONS & C OMPANY I NTERNATIONAL 5
Understanding <strong>Production</strong> <strong>Sharing</strong> <strong>Contracts</strong> (continued)Host governments generally retain a sizeable share of theprofit oil tranche. The cost oil tranche can contain severalrestrictions (or incentives, in some cases) that createvariability in cost oil terms, including rates of depreciationand cost oil uplift (allowing more than 100% recovery ofdevelopment costs which is often used to stimulate IOCinterest in exploring or developing oil/gas projects in morechallenging locations, such as ultra-deepwater West Africa).The cost oil element is generally denominated in monetaryterms (i.e. US$ based on investment made) but is paid inbarrels. Therefore, as oil prices increase the number ofbarrels required to pay back the “cost” component reduces asdoes the IOC share of production. In contrast, profit oil isgenerally agreed as a share of production after the cost oilcomponent is paid out. As oil prices increase, profit oilbarrels increase relative to cost oil barrels and the hostgovernment percentage share of production increases relativeto the IOC share of production.Not all PSCs are created equal. Profit oil percentages canvary substantially from country to country. For instance, inIran, profit oil rates are effectively zero. Under a contractstructure referred to as a “buyback”, Iran offers IOCscompensation for costs incurred developing the projectthrough barrels produced from that project (similar to cost oilunder a more traditional PSC). This compensation usuallyincludes a fixed return on investment (generally ~15-17%)which is denominated in monetary terms rather than a shareof profit oil. As a result, in a rising oil price environment, thetotal number of barrels required to payout this return isreduced. After costs are recovered, inclusive of the fixedreturn, operatorship of the project is transferred to the hostgovernment and the IOC has no further interest in the field(duration varies but can be as short as five years). At theother end of the spectrum, traditional concessionary regimes,such as the U.S. and Norway essentially have 100% profit oil(net of royalties), since ownership of the oil/gas is consideredto be held by the IOC, not the government (although royaltiesand income taxes can still reduce the “take home” payavailable to the IOCs).Reserve entitlement variability under PSCs. Under PSCs,production entitlement generally drops when companiesrecover the bulk of their capital costs through cost oilentitlement, at which point the host government shares alarger percentage of total field production as prescribed bythe profit oil percentage. Figure 6 shows the total contractorentitlement percentage (cost oil + profit oil) over the life ofour example West Africa PSC (under a $30/bbl price deckassumption). As shown, the contractor is entitled to over 70%of production in the first full year of operations when costrecovery is in full swing. Over time, the contractor is entitledto a smaller share of total production as cost oil barrels(which are 100% attributable to the contractor) decline andprofit oil barrels (30% attributable to the contractor, in ourexample) increase.Figure 6: IOC PSC <strong>Production</strong> EntitlementContractor Entitlement (%)80%70%60%50%40%30%20%10%0%1 2 3 4 5 6 7 8 9 10 11 12 13 14 15 16 17 18 19 20Project Age (Years)Source: Simmons and Company International.Lower profit oil rate spells lower IOC entitlement. It’s nosurprise that the IOC profit oil rate and total contractor/IOCreserve entitlement are positively correlated. Said anotherway, as the host government share of profit oil increases, thecontractor share of production declines. Figure 7 displays thenet contractor proved reserve entitlement for our exampleWest African PSC under different assumptions for thecontracted profit oil rate available to the contractor/IOC.Figure 7: Profit Oil Rate and Contractor EntitlementContractor Entitlement (% of gross reserves)120%100%80%60%40%20%0%0% 10% 20% 30% 40% 50% 60% 70% 80% 90% 100%Contractor Profit Oil (%)Source: Simmons and Company International.6S IMMONS & C OMPANY I NTERNATIONAL
Understanding <strong>Production</strong> <strong>Sharing</strong> <strong>Contracts</strong> (continued)A lower profit oil share also generally means a largerentitlement sensitivity to changes in oil prices. Ascontractor/IOC profit oil rates decline, the post cost recoverydrop in entitlement becomes more significant. Becausecapital costs remain relatively constant as oil prices increase(other than some inflation, which tends to correspond tohigher oil prices), higher oil prices result in fewer barrelsbeing required to compensate the IOC for its costs incurred.As a result, contractor reserve entitlement is inversely relatedto oil prices. The more significant drop in entitlement occurswith those contracts that have the least amount of profit oilshare for the IOC. Here again, Iran is the extreme example,where companies share in no profit oil beyond theircontracted rate of return. At the other end of the spectrum,the US and Norway have virtually no entitlement sensitivityto oil prices, since royalties are calculated on a percentage ofproduction basis and not on a dollars-spent basis. See Figure8 for entitlement sensitivities to oil prices for each of our fourexample contract structures.Figure 8: Oil Prices and Contractor Reserve Entitlementpercentage of gross reserves120%100%80%60%40%20%0%$18$20$22$24$26$28$30$32$34$36oil prices ($/bbl)WAF U.S. GOM Norway IranSource: Simmons and Company International.$38$40$42$44$46$48$50$52$54$56$58$60Barrel count (“entitlement”) is only one of severalvariables affecting profitability. We note that contractorreserve entitlement sensitivity does not encompass theentirety of project sensitivity to oil prices. Taxes (excisetaxes, income taxes and other special petroleum taxes) alsoreduce IOC capture of the oil price upside, so that instead ofa reduction in entitled barrels, the IOC obtains a higherrevenue per barrel offset by higher income tax per barrel. Thenet effect on IRR can be similar. That said, we do generallyfind that host government participation in PSC arrangements,on average, tends to result in lower (although not totallyeliminated) upside capture (on an NPV/IRR basis) than undermost concessionary regimes. By the same token, however,we note that the cost recovery provisions in PSCs on averageresults in less NPV/IRR downside exposure to oil pricedeclines. Also, participation in oil price fluctuations by thehost government and front-end loaded cost recoveryprovisions generally make PSC terms (once agreed to) lesssubject to broad-based increases in tax rates (such as thosethat occurred in Russia over the past 12 months) and morepalatable in the face of increasing project development costs(provided that cost provisions are well written in the PSC).Timing matters. The cost oil provision also results insignificant variability in oil price sensitivity over the life ofthe project. Under our example West Africa PSC, totalentitlement loss over the life of the project at $60/bbl vs.$30/bbl is 136 mmb (a 23% reduction). Due to both theearlier recovery of cost barrels and higher production earlierin the life of the project, entitlement barrels lost are mostsignificant in the first few years of project life. For example,for our sample 30 year project, of the 136 mmb that werelost, 72% would be lost in the 1 st decade, 21% in the 2 nd and7% in the final decade of the project life. The effect remainseven when measured as a percentage of production and isparticularly pronounced early in the project life. For example,on average the example project witnesses a 9% productionentitlement loss in the 1 st five years, 8% in the 2 nd five yearsand 7% in the 3 rd 5-year increment. This timing effect occursunder any PSC or buyback contract that has separate costrecovery and profit sharing provisions (or in the case of abuyback contract, no profit sharing entitlement at all). Asevidenced by our example, project timing can have asignificant effect on entitlement sensitivities to oil prices,making a specific rule of thumb difficult to find and variedquarter-to-quarter and year-to-year. Figure 9 graphicallydisplays the IOC production entitlement exposure to oil pricechange over the project life.Figure 9: <strong>Production</strong> Entitlement (Oil Price Scenarios)Annual <strong>Production</strong> (kbpd)1801601401201008060402001 2 3 4 5 6 7 8 9 10 11 12 13 14 15 16 17 18 19 20 21 22 23 24 25 26 27 28 29 30Year"Lost" barrels (mmb) Entitlement at $30/bbl (kbpd) Entitlement at $60/bbl (kbpd)Source: Simmons and Company International.S IMMONS & C OMPANY I NTERNATIONAL 720181614121086420Annual Entitlement Loss (MMB)
Understanding <strong>Production</strong> <strong>Sharing</strong> <strong>Contracts</strong> (continued)Oil prices and proved reserve balances. Given the inverserelationship between proved reserve entitlement and oilprices and the fact that companies must report reserveestimates under year-end pricing assumptions for SECstandards, companies are exposed to price-relatedfluctuations in reserve balances from year-to-year. Oil pricesincreased by approximately $11/bbl from year-end ’03 toyear-end ’04. On average, we estimate that this price increaseresulted in an approximate 6% reduction in proved reservebalances under PSC contracts (or ~0.6% per $1/bbl change inoil prices) for our integrated oil coverage universe.Definitions:• Royalty Rate: Percentage of gross revenue paid tohost government or landowner (usually paid “inkind”)• Severance Taxes: Similar to royalties. Typicallypaid on a gross revenue basis.• Capital Deduction Rate: Statutory rate ofdepreciation for tax deduction purposes.into future years, allowing the host government toshare in the profitability of the project earlier thanwould be the case without such limit.• Capital Cost Uplift: Additional deduction factorfor computing cost recovery production. A highercapital uplift provides an additional benefit to thecontractor.• Profit Oil Rate: Percentage of profits allocated tothe contracting company.• Provincial Taxes: Various state and local or othergovernment take that is computed on an income orR-C basis.• Income Tax Rate: Income tax charged at thefederal/national level.• National Oil Company (NOC) Carry: Percentageof NOC project capex that is paid for by thecontractor(s).• Cost Recovery Limit: Threshold percentage ofrevenue over which cost recovery must be deferred8S IMMONS & C OMPANY I NTERNATIONAL
Country-by-Country PSC SummaryMajors U.S. Mid-Caps International Mid-CapsCountry BP CVX XOM RDS TOT AHC COP MRO OXY BRG E NHY REP STO PCZ SUAlbaniaxAlgeria x x x x x x xAngola x x x x x x x x xAzerbaijan x x x x x x x xBahrainxBangladeshxBelizeBeninCambodiaxCameroon x x x xChina o x x x x xCongo x x x xCote D'IvoireCubaEgypt x x x x xEquatorial Guinea x x x xEthiopiaGabon x x x xGambiaGeorgiaGuatemalaGuyanaxIndia x xIndonesia x x x x x x xIran (buyback) x x x x x xJamaicaJordanKazakhstan x o x x x x xKenyaKyrghyzstanLaosLiberiaLibya x x x x x x x x x x xMadagascarxMalaysia x x x xMaltaMongoliaMozambiqueMyanmar x xNicaraguaNigeria x x x x x x x x x xOman x x x xPakistan x o xPanamaPhilippines x xPolandQatar x o x x x x xRussia o x x o o o o oSudanSyria x x xTanzaniaTogoTrinidad & Tobago o x x x x x x xTunisiaxTurkeyxTurkmenistanUgandaUruguayxUzbekistanVietnam x x xYemen x x xZambiaCOUNTRY COUNT 9 18 15 17 19 7 12 6 8 5 14 5 4 6 5 0% OF RESERVES 21% 18% 13% 21% 30% 17% 15% 42% 18% 50% 51% 5% 2% 14% 7% 0%% OF PRODUCTION 9% 14% 21% 15% 27% 23% 3% 14% 19% 45% 45% 4% 5% 8% 22% 0%Note: "x" indicates confirmed participation in PSC arrangmenets.o indicates production/resource interests in the country, but not under a PSA-style contract.Where information is not provided, we have assumed that a more conservative (higher) level of production is exposed.S IMMONS & C OMPANY I NTERNATIONAL 9
West Africa Project ModelYear (3) (2) (1) 0 1 2 3 4 5 6 7 8 9 10 11 12 13Oil Price ($/bbl) $30.00 $30.00 $30.00 $30.00 $30.00 $30.00 $30.00 $30.00 $30.00 $30.00 $30.00 $30.00 $30.00 $30.00 $30.00 $30.00 $30.00Oil Price Differential ($/bbl) ($2.00) ($2.00) ($2.00) ($2.00) ($2.00) ($2.00) ($2.00) ($2.00) ($2.00) ($2.00) ($2.00) ($2.00) ($2.00) ($2.00) ($2.00) ($2.00) ($2.00)Gas Price ($/mmbtu) $5.00 $5.00 $5.00 $5.00 $5.00 $5.00 $5.00 $5.00 $5.00 $5.00 $5.00 $5.00 $5.00 $5.00 $5.00 $5.00 $5.00Gas Price Differential ($/mmbtu) (1) (1) (1) (1) (1) (1) (1) (1) (1) (1) (1) (1) (1) (1) (1) (1) (1)Oil <strong>Production</strong> (kbpd) 0 0 0 0 63 225 250 250 225 203 182 164 148 133 120 108 97Memo: Oil <strong>Production</strong> (mmb) 0 0 0 0 23 83 92 92 83 75 67 60 54 49 44 40 36Gas <strong>Production</strong> (mmcfd) 0 0 0 0 0 0 0 0 0 0 0 0 0 0 0 0 0Memo: Gas <strong>Production</strong> (bcf) 0 0 0 0 0 0 0 0 0 0 0 0 0 0 0 0 0<strong>Production</strong> (kboepd) 0 0 0 0 63 225 250 250 225 203 182 164 148 133 120 108 97Gross Revenue ($mm) $0 $0 $0 $0 $644 $2,318 $2,576 $2,576 $2,318 $2,087 $1,878 $1,690 $1,521 $1,369 $1,232 $1,109 $998Royalty ($/boe) $0.00 $0.00 $0.00 $0.00 $0.00 $0.00 $0.00 $0.00 $0.00 $0.00 $0.00 $0.00 $0.00 $0.00 $0.00 $0.00 $0.00Royalty (kboed) 0 0 0 0 0 0 0 0 0 0 0 0 0 0 0 0 0Royalty ($mm) $0 $0 $0 $0 $0 $0 $0 $0 $0 $0 $0 $0 $0 $0 $0 $0 $0Severance ($mm) $0 $0 $0 $0 $0 $0 $0 $0 $0 $0 $0 $0 $0 $0 $0 $0 $0Capital Costs ($mm) $173 $173 $1,037 $1,383 $346 $346 $17 $17 $17 $17 $17 $17 $17 $17 $17 $17 $17Memo: Gross Invested Capital ($mm) $173 $346 $1,383 $2,765 $2,812 $2,595 $2,129 $1,749 $1,440 $1,188 $983 $816 $680 $569 $479 $405 $345Fiscal Depreciation ($mm) $0 $0 $0 $0 $299 $563 $483 $397 $326 $269 $222 $184 $153 $128 $108 $91 $77Opex ($/boe) $0.00 $0.00 $0.00 $0.00 $1.50 $3.00 $3.00 $3.00 $3.00 $3.00 $3.00 $3.00 $3.00 $3.00 $3.00 $3.00 $3.00Opex ($mm) $0 $0 $0 $0 $69 $248 $276 $276 $248 $224 $201 $181 $163 $147 $132 $119 $107Uplift ($mm) $0 $0 $0 $0 $184 $406 $380 $336 $287 $246 $212 $183 $158 $137 $120 $105 $92Total Costs ($mm) $0 $0 $0 $0 $552 $1,217 $1,139 $1,009 $862 $739 $635 $548 $475 $412 $359 $314 $276Cost Recovery ($mm) $0 $0 $0 $0 $419 $1,350 $1,139 $1,009 $862 $739 $635 $548 $475 $412 $359 $314 $276Memo: C/R Carryforward ($mm) $0 $0 $0 $0 $134 $0 $0 $0 $0 $0 $0 $0 $0 $0 $0 $0 $0Profit Oil - 100% ($mm) $0 $0 $0 $0 $225 $968 $1,437 $1,567 $1,456 $1,348 $1,242 $1,142 $1,047 $957 $873 $794 $722Profit Oil (Contractor) $0 $0 $0 $0 $68 $290 $431 $470 $437 $404 $373 $343 $314 $287 $262 $238 $217Profit Oil (Government) $0 $0 $0 $0 $158 $678 $1,006 $1,097 $1,019 $943 $870 $799 $733 $670 $611 $556 $505Memo: Oil Entitlement (kbpd) 0 0 0 0 47 159 152 144 126 111 98 86 77 68 60 54 48Memo: Gas Entitlement (mmcfd) 0 0 0 0 0 0 0 0 0 0 0 0 0 0 0 0 0Memo: Total Entitlement (kboepd) 0 0 0 0 47 159 152 144 126 111 98 86 77 68 60 54 48Memo: Total Entitlement (mmboe) 0 0 0 0 17 59 56 53 46 41 36 32 28 25 22 20 18Memo: Total Entitlement (%) 0% 0% 0% 0% 38% 71% 61% 57% 56% 55% 54% 53% 52% 51% 50% 50% 49%Provincial Taxes ($mm) $0 $0 $0 $0 $0 $0 $0 $0 $0 $0 $0 $0 $0 $0 $0 $0 $0Income Taxes ($mm) $0 $0 $0 $0 ($27) ($116) ($172) ($188) ($175) ($162) ($149) ($137) ($126) ($115) ($105) ($95) ($87)Bonuses ($mm) $50 $0 $0 $0 $0 $0 $0 $0 $0 $0 $0 $0 $0 $0 $0 $0 $0NOC Capex Carry ($mm) $10 $10 $62 $83 $21 $21 $1 $1 $1 $1 $1 $1 $1 $1 $1 $1 $1Contractor Take ($mm) $0 $0 $0 $0 $459 $1,525 $1,398 $1,291 $1,124 $982 $859 $754 $663 $584 $516 $457 $406FCF ($mm) ($209) ($179) ($1,074) ($1,432) $32 $918 $1,104 $997 $858 $740 $640 $555 $482 $420 $367 $321 $281Discount Rate (%) 10% 10% 10% 10% 10% 10% 10% 10% 10% 10% 10% 10% 10% 10% 10% 10% 10%Cumulative Discounted FCF ($mm) $1,480 $1,814 $2,869 $4,544 $5,464 $5,173 $4,605 $4,005 $3,480 $3,030 $2,644 $2,312 $2,024 $1,775 $1,559 $1,371 $1,20610S IMMONS & C OMPANY I NTERNATIONAL
West Africa Project Model (continued)Year 14 15 16 17 18 19 20 21 22 23 24 25 26 27 28 29 30Oil Price ($/bbl) $30.00 $30.00 $30.00 $30.00 $30.00 $30.00 $30.00 $30.00 $30.00 $30.00 $30.00 $30.00 $30.00 $30.00 $30.00 $30.00 $30.00Oil Price Differential ($/bbl) ($2.00) ($2.00) ($2.00) ($2.00) ($2.00) ($2.00) ($2.00) ($2.00) ($2.00) ($2.00) ($2.00) ($2.00) ($2.00) ($2.00) ($2.00) ($2.00) ($2.00)Gas Price ($/mmbtu) $5.00 $5.00 $5.00 $5.00 $5.00 $5.00 $5.00 $5.00 $5.00 $5.00 $5.00 $5.00 $5.00 $5.00 $5.00 $5.00 $5.00Gas Price Differential ($/mmbtu) (1) (1) (1) (1) (1) (1) (1) (1) (1) (1) (1) (1) (1) (1) (1) (1) (1)Oil <strong>Production</strong> (kbpd) 87 78 71 64 57 51 46 42 38 34 30 27 25 22 20 18 16Memo: Oil <strong>Production</strong> (mmb) 32 29 26 23 21 19 17 15 14 12 11 10 9 8 7 7 6Gas <strong>Production</strong> (mmcfd) 0 0 0 0 0 0 0 0 0 0 0 0 0 0 0 0 0Memo: Gas <strong>Production</strong> (bcf) 0 0 0 0 0 0 0 0 0 0 0 0 0 0 0 0 0<strong>Production</strong> (kboepd) 87 78 71 64 57 51 46 42 38 34 30 27 25 22 20 18 16Gross Revenue ($mm) $898 $808 $728 $655 $589 $530 $477 $430 $387 $348 $313 $282 $254 $228 $205 $185 $166Royalty ($/boe) $0.00 $0.00 $0.00 $0.00 $0.00 $0.00 $0.00 $0.00 $0.00 $0.00 $0.00 $0.00 $0.00 $0.00 $0.00 $0.00 $0.00Royalty (kboed) 0 0 0 0 0 0 0 0 0 0 0 0 0 0 0 0 0Royalty ($mm) $0 $0 $0 $0 $0 $0 $0 $0 $0 $0 $0 $0 $0 $0 $0 $0 $0Severance ($mm) $0 $0 $0 $0 $0 $0 $0 $0 $0 $0 $0 $0 $0 $0 $0 $0 $0Capital Costs ($mm) $17 $17 $17 $17 $17 $17 $17 $17 $17 $17 $17 $17 $17 $17 $17 $17 $17Memo: Gross Invested Capital ($mm) $296 $257 $224 $198 $176 $159 $145 $133 $124 $116 $110 $105 $100 $97 $94 $92 $90Fiscal Depreciation ($mm) $66 $57 $50 $44 $39 $35 $32 $29 $27 $25 $24 $22 $21 $21 $20 $20 $19Opex ($/boe) $3.00 $3.00 $3.00 $3.00 $3.00 $3.00 $3.00 $3.00 $3.00 $3.00 $3.00 $3.00 $3.00 $3.00 $3.00 $3.00 $3.00Opex ($mm) $96 $87 $78 $70 $63 $57 $51 $46 $41 $37 $34 $30 $27 $24 $22 $20 $18Uplift ($mm) $81 $72 $64 $57 $51 $46 $41 $37 $34 $31 $29 $26 $24 $23 $21 $20 $18Total Costs ($mm) $243 $215 $191 $171 $153 $137 $124 $112 $102 $93 $86 $79 $73 $68 $63 $59 $55Cost Recovery ($mm) $243 $215 $191 $171 $153 $137 $124 $112 $102 $93 $86 $79 $73 $68 $63 $59 $55Memo: C/R Carryforward ($mm) $0 $0 $0 $0 $0 $0 $0 $0 $0 $0 $0 $0 $0 $0 $0 $0 $0Profit Oil - 100% ($mm) $655 $593 $536 $484 $436 $393 $353 $317 $284 $255 $228 $203 $181 $161 $142 $126 $111Profit Oil (Contractor) $196 $178 $161 $145 $131 $118 $106 $95 $85 $76 $68 $61 $54 $48 $43 $38 $33Profit Oil (Government) $458 $415 $375 $339 $306 $275 $247 $222 $199 $178 $159 $142 $127 $112 $100 $88 $78Memo: Oil Entitlement (kbpd) 43 38 34 31 28 25 22 20 18 16 15 14 12 11 10 9 9Memo: Gas Entitlement (mmcfd) 0 0 0 0 0 0 0 0 0 0 0 0 0 0 0 0 0Memo: Total Entitlement (kboepd) 43 38 34 31 28 25 22 20 18 16 15 14 12 11 10 9 9Memo: Total Entitlement (mmboe) 16 14 13 11 10 9 8 7 7 6 5 5 5 4 4 3 3Memo: Total Entitlement (%) 49% 49% 48% 48% 48% 48% 48% 48% 49% 49% 49% 50% 50% 51% 51% 52% 53%Provincial Taxes ($mm) $0 $0 $0 $0 $0 $0 $0 $0 $0 $0 $0 $0 $0 $0 $0 $0 $0Income Taxes ($mm) ($79) ($71) ($64) ($58) ($52) ($47) ($42) ($38) ($34) ($31) ($27) ($24) ($22) ($19) ($17) ($15) ($13)Bonuses ($mm) $0 $0 $0 $0 $0 $0 $0 $0 $0 $0 $0 $0 $0 $0 $0 $0 $0NOC Capex Carry ($mm) $1 $1 $1 $1 $1 $1 $1 $1 $1 $1 $1 $1 $1 $1 $1 $1 $1Contractor Take ($mm) $361 $322 $288 $258 $231 $208 $188 $169 $153 $139 $127 $115 $105 $97 $89 $82 $75FCF ($mm) $247 $218 $192 $170 $150 $133 $119 $106 $94 $84 $75 $67 $60 $54 $49 $44 $40Discount Rate (%) 10% 10% 10% 10% 10% 10% 10% 10% 10% 10% 10% 10% 10% 10% 10% 10% 10%Cumulative Discounted FCF ($mm) $1,062 $934 $822 $722 $634 $554 $483 $418 $360 $306 $256 $210 $166 $125 $86 $47 $10S IMMONS & C OMPANY I NTERNATIONAL 11
U.S. Gulf of Mexico Project ModelYear (3) (2) (1) 0 1 2 3 4 5 6 7 8 9 10 11 12 13Oil Price ($/bbl) $30.00 $30.00 $30.00 $30.00 $30.00 $30.00 $30.00 $30.00 $30.00 $30.00 $30.00 $30.00 $30.00 $30.00 $30.00 $30.00 $30.00Oil Price Differential ($/bbl) ($2.00) ($2.00) ($2.00) ($2.00) ($2.00) ($2.00) ($2.00) ($2.00) ($2.00) ($2.00) ($2.00) ($2.00) ($2.00) ($2.00) ($2.00) ($2.00) ($2.00)Gas Price ($/mmbtu) $5.00 $5.00 $5.00 $5.00 $5.00 $5.00 $5.00 $5.00 $5.00 $5.00 $5.00 $5.00 $5.00 $5.00 $5.00 $5.00 $5.00Gas Price Differential ($/mmbtu) (1) (1) (1) (1) (1) (1) (1) (1) (1) (1) (1) (1) (1) (1) (1) (1) (1)Oil <strong>Production</strong> (kbpd) 0 0 0 0 63 225 250 250 225 203 182 164 148 133 120 108 97Memo: Oil <strong>Production</strong> (mmb) 0 0 0 0 23 83 92 92 83 75 67 60 54 49 44 40 36Gas <strong>Production</strong> (mmcfd) 0 0 0 0 0 0 0 0 0 0 0 0 0 0 0 0 0Memo: Gas <strong>Production</strong> (bcf) 0 0 0 0 0 0 0 0 0 0 0 0 0 0 0 0 0<strong>Production</strong> (kboepd) 0 0 0 0 63 225 250 250 225 203 182 164 148 133 120 108 97Gross Revenue ($mm) $0 $0 $0 $0 $644 $2,318 $2,576 $2,576 $2,318 $2,087 $1,878 $1,690 $1,521 $1,369 $1,232 $1,109 $998Royalty ($/boe) $0.00 $0.00 $0.00 $0.00 $1.75 $3.50 $3.50 $3.50 $3.50 $3.50 $3.50 $3.50 $3.50 $3.50 $3.50 $3.50 $3.50Royalty (kboed) 0 0 0 0 8 28 31 31 28 25 23 21 18 17 15 13 12Royalty ($mm) $0 $0 $0 $0 $81 $290 $322 $322 $290 $261 $235 $211 $190 $171 $154 $139 $125Severance ($mm) $0 $0 $0 $0 $0 $0 $0 $0 $0 $0 $0 $0 $0 $0 $0 $0 $0Capital Costs ($mm) $173 $173 $1,037 $1,383 $346 $346 $17 $17 $17 $17 $17 $17 $17 $17 $17 $17 $17Memo: Gross Invested Capital ($mm) $173 $346 $1,383 $2,765 $2,812 $2,595 $2,129 $1,749 $1,440 $1,188 $983 $816 $680 $569 $479 $405 $345Fiscal Depreciation ($mm) $0 $0 $0 $0 $299 $563 $483 $397 $326 $269 $222 $184 $153 $128 $108 $91 $77Opex ($/boe) $0.00 $0.00 $0.00 $0.00 $1.50 $3.00 $3.00 $3.00 $3.00 $3.00 $3.00 $3.00 $3.00 $3.00 $3.00 $3.00 $3.00Opex ($mm) $0 $0 $0 $0 $69 $248 $276 $276 $248 $224 $201 $181 $163 $147 $132 $119 $107Uplift ($mm) $0 $0 $0 $0 $0 $0 $0 $0 $0 $0 $0 $0 $0 $0 $0 $0 $0Total Costs ($mm) $0 $0 $0 $0 $368 $811 $759 $673 $575 $493 $424 $365 $316 $275 $240 $210 $184Cost Recovery ($mm) $0 $0 $0 $0 $368 $811 $759 $673 $575 $493 $424 $365 $316 $275 $240 $210 $184Memo: C/R Carryforward ($mm) $0 $0 $0 $0 $0 $0 $0 $0 $0 $0 $0 $0 $0 $0 $0 $0 $0Profit Oil - 100% ($mm) $0 $0 $0 $0 $195 $1,218 $1,495 $1,581 $1,454 $1,333 $1,220 $1,113 $1,015 $923 $839 $761 $689Profit Oil (Contractor) $0 $0 $0 $0 $195 $1,218 $1,495 $1,581 $1,454 $1,333 $1,220 $1,113 $1,015 $923 $839 $761 $689Profit Oil (Government) $0 $0 $0 $0 $0 $0 $0 $0 $0 $0 $0 $0 $0 $0 $0 $0 $0Memo: Oil Entitlement (kbpd) 0 0 0 0 55 197 219 219 197 177 159 144 129 116 105 94 85Memo: Gas Entitlement (mmcfd) 0 0 0 0 0 0 0 0 0 0 0 0 0 0 0 0 0Memo: Total Entitlement (kboepd) 0 0 0 0 55 197 219 219 197 177 159 144 129 116 105 94 85Memo: Total Entitlement (mmboe) 0 0 0 0 20 72 81 81 72 65 59 53 48 43 39 35 31Memo: Total Entitlement (%) 0% 0% 0% 0% 44% 88% 88% 88% 88% 88% 88% 88% 88% 88% 88% 88% 88%Provincial Taxes ($mm) $0 $0 $0 $0 $0 $0 $0 $0 $0 $0 $0 $0 $0 $0 $0 $0 $0Income Taxes ($mm) $0 $0 $0 $0 ($68) ($426) ($523) ($553) ($509) ($467) ($427) ($390) ($355) ($323) ($293) ($266) ($241)Bonuses ($mm) $50 $0 $0 $0 $0 $0 $0 $0 $0 $0 $0 $0 $0 $0 $0 $0 $0NOC Capex Carry ($mm) $0 $0 $0 $0 $0 $0 $0 $0 $0 $0 $0 $0 $0 $0 $0 $0 $0Contractor Take ($mm) $0 $0 $0 $0 $495 $1,602 $1,731 $1,701 $1,520 $1,359 $1,216 $1,089 $976 $875 $785 $704 $632FCF ($mm) ($203) ($173) ($1,037) ($1,383) $80 $1,008 $1,438 $1,407 $1,254 $1,118 $998 $891 $796 $711 $635 $568 $508Discount Rate (%) 10% 10% 10% 10% 10% 10% 10% 10% 10% 10% 10% 10% 10% 10% 10% 10% 10%Cumulative Discounted FCF ($mm) $3,246 $3,750 $4,968 $6,805 $7,909 $7,823 $7,194 $6,446 $5,750 $5,130 $4,576 $4,082 $3,640 $3,244 $2,890 $2,572 $2,28712S IMMONS & C OMPANY I NTERNATIONAL
U.S. Gulf of Mexico Project Model (continued)Year 14 15 16 17 18 19 20 21 22 23 24 25 26 27 28 29 30Oil Price ($/bbl) $30.00 $30.00 $30.00 $30.00 $30.00 $30.00 $30.00 $30.00 $30.00 $30.00 $30.00 $30.00 $30.00 $30.00 $30.00 $30.00 $30.00Oil Price Differential ($/bbl) ($2.00) ($2.00) ($2.00) ($2.00) ($2.00) ($2.00) ($2.00) ($2.00) ($2.00) ($2.00) ($2.00) ($2.00) ($2.00) ($2.00) ($2.00) ($2.00) ($2.00)Gas Price ($/mmbtu) $5.00 $5.00 $5.00 $5.00 $5.00 $5.00 $5.00 $5.00 $5.00 $5.00 $5.00 $5.00 $5.00 $5.00 $5.00 $5.00 $5.00Gas Price Differential ($/mmbtu) (1) (1) (1) (1) (1) (1) (1) (1) (1) (1) (1) (1) (1) (1) (1) (1) (1)Oil <strong>Production</strong> (kbpd) 87 78 71 64 57 51 46 42 38 34 30 27 25 22 20 18 16Memo: Oil <strong>Production</strong> (mmb) 32 29 26 23 21 19 17 15 14 12 11 10 9 8 7 7 6Gas <strong>Production</strong> (mmcfd) 0 0 0 0 0 0 0 0 0 0 0 0 0 0 0 0 0Memo: Gas <strong>Production</strong> (bcf) 0 0 0 0 0 0 0 0 0 0 0 0 0 0 0 0 0<strong>Production</strong> (kboepd) 87 78 71 64 57 51 46 42 38 34 30 27 25 22 20 18 16Gross Revenue ($mm) $898 $808 $728 $655 $589 $530 $477 $430 $387 $348 $313 $282 $254 $228 $205 $185 $166Royalty ($/boe) $3.50 $3.50 $3.50 $3.50 $3.50 $3.50 $3.50 $3.50 $3.50 $3.50 $3.50 $3.50 $3.50 $3.50 $3.50 $3.50 $3.50Royalty (kboed) 11 10 9 8 7 6 6 5 5 4 4 3 3 3 2 2 2Royalty ($mm) $112 $101 $91 $82 $74 $66 $60 $54 $48 $43 $39 $35 $32 $29 $26 $23 $21Severance ($mm) $0 $0 $0 $0 $0 $0 $0 $0 $0 $0 $0 $0 $0 $0 $0 $0 $0Capital Costs ($mm) $17 $17 $17 $17 $17 $17 $17 $17 $17 $17 $17 $17 $17 $17 $17 $17 $17Memo: Gross Invested Capital ($mm) $296 $257 $224 $198 $176 $159 $145 $133 $124 $116 $110 $105 $100 $97 $94 $92 $90Fiscal Depreciation ($mm) $66 $57 $50 $44 $39 $35 $32 $29 $27 $25 $24 $22 $21 $21 $20 $20 $19Opex ($/boe) $3.00 $3.00 $3.00 $3.00 $3.00 $3.00 $3.00 $3.00 $3.00 $3.00 $3.00 $3.00 $3.00 $3.00 $3.00 $3.00 $3.00Opex ($mm) $96 $87 $78 $70 $63 $57 $51 $46 $41 $37 $34 $30 $27 $24 $22 $20 $18Uplift ($mm) $0 $0 $0 $0 $0 $0 $0 $0 $0 $0 $0 $0 $0 $0 $0 $0 $0Total Costs ($mm) $162 $144 $128 $114 $102 $92 $83 $75 $68 $62 $57 $53 $49 $45 $42 $39 $37Cost Recovery ($mm) $162 $144 $128 $114 $102 $92 $83 $75 $68 $62 $57 $53 $49 $45 $42 $39 $37Memo: C/R Carryforward ($mm) $0 $0 $0 $0 $0 $0 $0 $0 $0 $0 $0 $0 $0 $0 $0 $0 $0Profit Oil - 100% ($mm) $624 $564 $509 $459 $414 $372 $335 $301 $270 $242 $217 $194 $173 $155 $138 $122 $109Profit Oil (Contractor) $624 $564 $509 $459 $414 $372 $335 $301 $270 $242 $217 $194 $173 $155 $138 $122 $109Profit Oil (Government) $0 $0 $0 $0 $0 $0 $0 $0 $0 $0 $0 $0 $0 $0 $0 $0 $0Memo: Oil Entitlement (kbpd) 76 69 62 56 50 45 41 36 33 30 27 24 22 19 17 16 14Memo: Gas Entitlement (mmcfd) 0 0 0 0 0 0 0 0 0 0 0 0 0 0 0 0 0Memo: Total Entitlement (kboepd) 76 69 62 56 50 45 41 36 33 30 27 24 22 19 17 16 14Memo: Total Entitlement (mmboe) 28 25 23 20 18 17 15 13 12 11 10 9 8 7 6 6 5Memo: Total Entitlement (%) 88% 88% 88% 88% 88% 88% 88% 88% 88% 88% 88% 88% 88% 88% 88% 88% 88%Provincial Taxes ($mm) $0 $0 $0 $0 $0 $0 $0 $0 $0 $0 $0 $0 $0 $0 $0 $0 $0Income Taxes ($mm) ($218) ($197) ($178) ($161) ($145) ($130) ($117) ($105) ($95) ($85) ($76) ($68) ($61) ($54) ($48) ($43) ($38)Bonuses ($mm) $0 $0 $0 $0 $0 $0 $0 $0 $0 $0 $0 $0 $0 $0 $0 $0 $0NOC Capex Carry ($mm) $0 $0 $0 $0 $0 $0 $0 $0 $0 $0 $0 $0 $0 $0 $0 $0 $0Contractor Take ($mm) $568 $510 $458 $412 $371 $334 $300 $271 $244 $220 $198 $179 $161 $146 $132 $119 $108FCF ($mm) $454 $406 $363 $325 $290 $260 $232 $207 $185 $165 $147 $131 $117 $104 $92 $82 $72Discount Rate (%) 10% 10% 10% 10% 10% 10% 10% 10% 10% 10% 10% 10% 10% 10% 10% 10% 10%Cumulative Discounted FCF ($mm) $2,030 $1,800 $1,592 $1,404 $1,234 $1,080 $940 $812 $696 $589 $490 $399 $314 $234 $158 $87 $18S IMMONS & C OMPANY I NTERNATIONAL 13
Norway Project ModelYear (3) (2) (1) 0 1 2 3 4 5 6 7 8 9 10 11 12 13Oil Price ($/bbl) $30.00 $30.00 $30.00 $30.00 $30.00 $30.00 $30.00 $30.00 $30.00 $30.00 $30.00 $30.00 $30.00 $30.00 $30.00 $30.00 $30.00Oil Price Differential ($/bbl) ($2.00) ($2.00) ($2.00) ($2.00) ($2.00) ($2.00) ($2.00) ($2.00) ($2.00) ($2.00) ($2.00) ($2.00) ($2.00) ($2.00) ($2.00) ($2.00) ($2.00)Gas Price ($/mmbtu) $5.00 $5.00 $5.00 $5.00 $5.00 $5.00 $5.00 $5.00 $5.00 $5.00 $5.00 $5.00 $5.00 $5.00 $5.00 $5.00 $5.00Gas Price Differential ($/mmbtu) (1) (1) (1) (1) (1) (1) (1) (1) (1) (1) (1) (1) (1) (1) (1) (1) (1)Oil <strong>Production</strong> (kbpd) 0 0 0 0 63 225 250 250 225 203 182 164 148 133 120 108 97Memo: Oil <strong>Production</strong> (mmb) 0 0 0 0 23 83 92 92 83 75 67 60 54 49 44 40 36Gas <strong>Production</strong> (mmcfd) 0 0 0 0 0 0 0 0 0 0 0 0 0 0 0 0 0Memo: Gas <strong>Production</strong> (bcf) 0 0 0 0 0 0 0 0 0 0 0 0 0 0 0 0 0<strong>Production</strong> (kboepd) 0 0 0 0 63 225 250 250 225 203 182 164 148 133 120 108 97Gross Revenue ($mm) $0 $0 $0 $0 $644 $2,318 $2,576 $2,576 $2,318 $2,087 $1,878 $1,690 $1,521 $1,369 $1,232 $1,109 $998Royalty ($/boe) $0.00 $0.00 $0.00 $0.00 $0.00 $0.00 $0.00 $0.00 $0.00 $0.00 $0.00 $0.00 $0.00 $0.00 $0.00 $0.00 $0.00Royalty (kboed) 0 0 0 0 0 0 0 0 0 0 0 0 0 0 0 0 0Royalty ($mm) $0 $0 $0 $0 $0 $0 $0 $0 $0 $0 $0 $0 $0 $0 $0 $0 $0Severance ($mm) $0 $0 $0 $0 $0 $0 $0 $0 $0 $0 $0 $0 $0 $0 $0 $0 $0Capital Costs ($mm) $173 $173 $1,037 $1,383 $346 $346 $17 $17 $17 $17 $17 $17 $17 $17 $17 $17 $17Memo: Gross Invested Capital ($mm) $173 $346 $1,383 $2,765 $2,812 $2,595 $2,129 $1,749 $1,440 $1,188 $983 $816 $680 $569 $479 $405 $345Fiscal Depreciation ($mm) $0 $0 $0 $0 $299 $563 $483 $397 $326 $269 $222 $184 $153 $128 $108 $91 $77Opex ($/boe) $0.00 $0.00 $0.00 $0.00 $1.50 $3.00 $3.00 $3.00 $3.00 $3.00 $3.00 $3.00 $3.00 $3.00 $3.00 $3.00 $3.00Opex ($mm) $0 $0 $0 $0 $69 $248 $276 $276 $248 $224 $201 $181 $163 $147 $132 $119 $107Uplift ($mm) $0 $0 $0 $0 $28 $61 $57 $50 $43 $37 $32 $27 $24 $21 $18 $16 $14Total Costs ($mm) $0 $0 $0 $0 $396 $872 $816 $723 $618 $530 $455 $393 $340 $295 $258 $225 $198Cost Recovery ($mm) $0 $0 $0 $0 $396 $872 $816 $723 $618 $530 $455 $393 $340 $295 $258 $225 $198Memo: C/R Carryforward ($mm) $0 $0 $0 $0 $0 $0 $0 $0 $0 $0 $0 $0 $0 $0 $0 $0 $0Profit Oil - 100% ($mm) $0 $0 $0 $0 $248 $1,447 $1,760 $1,853 $1,700 $1,557 $1,423 $1,297 $1,181 $1,074 $975 $884 $800Profit Oil (Contractor) $0 $0 $0 $0 $248 $1,447 $1,760 $1,853 $1,700 $1,557 $1,423 $1,297 $1,181 $1,074 $975 $884 $800Profit Oil (Government) $0 $0 $0 $0 $0 $0 $0 $0 $0 $0 $0 $0 $0 $0 $0 $0 $0Memo: Oil Entitlement (kbpd) 0 0 0 0 63 225 250 250 225 203 182 164 148 133 120 108 97Memo: Gas Entitlement (mmcfd) 0 0 0 0 0 0 0 0 0 0 0 0 0 0 0 0 0Memo: Total Entitlement (kboepd) 0 0 0 0 63 225 250 250 225 203 182 164 148 133 120 108 97Memo: Total Entitlement (mmboe) 0 0 0 0 23 83 92 92 83 75 67 60 54 49 44 40 36Memo: Total Entitlement (%) 0% 0% 0% 0% 50% 100% 100% 100% 100% 100% 100% 100% 100% 100% 100% 100% 100%Provincial Taxes ($mm) $0 $0 $0 $0 $0 $0 $0 $0 $0 $0 $0 $0 $0 $0 $0 $0 $0Income Taxes ($mm) $0 $0 $0 $0 ($194) ($1,128) ($1,373) ($1,445) ($1,326) ($1,214) ($1,110) ($1,012) ($921) ($837) ($760) ($689) ($624)Bonuses ($mm) $50 $0 $0 $0 $0 $0 $0 $0 $0 $0 $0 $0 $0 $0 $0 $0 $0NOC Capex Carry ($mm) $0 $0 $0 $0 $0 $0 $0 $0 $0 $0 $0 $0 $0 $0 $0 $0 $0Contractor Take ($mm) $0 $0 $0 $0 $450 $1,190 $1,203 $1,131 $992 $872 $768 $678 $600 $532 $472 $420 $374FCF ($mm) ($203) ($173) ($1,037) ($1,383) $36 $596 $910 $838 $726 $631 $550 $480 $420 $368 $323 $284 $250Discount Rate (%) 10% 10% 10% 10% 10% 10% 10% 10% 10% 10% 10% 10% 10% 10% 10% 10% 10%Cumulative Discounted FCF ($mm) $901 $1,170 $2,130 $3,684 $4,497 $4,389 $3,950 $3,459 $3,023 $2,646 $2,320 $2,036 $1,789 $1,573 $1,385 $1,219 $1,07314S IMMONS & C OMPANY I NTERNATIONAL
Norway Project Model (continued)Year 14 15 16 17 18 19 20 21 22 23 24 25 26 27 28 29 30Oil Price ($/bbl) $30.00 $30.00 $30.00 $30.00 $30.00 $30.00 $30.00 $30.00 $30.00 $30.00 $30.00 $30.00 $30.00 $30.00 $30.00 $30.00 $30.00Oil Price Differential ($/bbl) ($2.00) ($2.00) ($2.00) ($2.00) ($2.00) ($2.00) ($2.00) ($2.00) ($2.00) ($2.00) ($2.00) ($2.00) ($2.00) ($2.00) ($2.00) ($2.00) ($2.00)Gas Price ($/mmbtu) $5.00 $5.00 $5.00 $5.00 $5.00 $5.00 $5.00 $5.00 $5.00 $5.00 $5.00 $5.00 $5.00 $5.00 $5.00 $5.00 $5.00Gas Price Differential ($/mmbtu) (1) (1) (1) (1) (1) (1) (1) (1) (1) (1) (1) (1) (1) (1) (1) (1) (1)Oil <strong>Production</strong> (kbpd) 87 78 71 64 57 51 46 42 38 34 30 27 25 22 20 18 16Memo: Oil <strong>Production</strong> (mmb) 32 29 26 23 21 19 17 15 14 12 11 10 9 8 7 7 6Gas <strong>Production</strong> (mmcfd) 0 0 0 0 0 0 0 0 0 0 0 0 0 0 0 0 0Memo: Gas <strong>Production</strong> (bcf) 0 0 0 0 0 0 0 0 0 0 0 0 0 0 0 0 0<strong>Production</strong> (kboepd) 87 78 71 64 57 51 46 42 38 34 30 27 25 22 20 18 16Gross Revenue ($mm) $898 $808 $728 $655 $589 $530 $477 $430 $387 $348 $313 $282 $254 $228 $205 $185 $166Royalty ($/boe) $0.00 $0.00 $0.00 $0.00 $0.00 $0.00 $0.00 $0.00 $0.00 $0.00 $0.00 $0.00 $0.00 $0.00 $0.00 $0.00 $0.00Royalty (kboed) 0 0 0 0 0 0 0 0 0 0 0 0 0 0 0 0 0Royalty ($mm) $0 $0 $0 $0 $0 $0 $0 $0 $0 $0 $0 $0 $0 $0 $0 $0 $0Severance ($mm) $0 $0 $0 $0 $0 $0 $0 $0 $0 $0 $0 $0 $0 $0 $0 $0 $0Capital Costs ($mm) $17 $17 $17 $17 $17 $17 $17 $17 $17 $17 $17 $17 $17 $17 $17 $17 $17Memo: Gross Invested Capital ($mm) $296 $257 $224 $198 $176 $159 $145 $133 $124 $116 $110 $105 $100 $97 $94 $92 $90Fiscal Depreciation ($mm) $66 $57 $50 $44 $39 $35 $32 $29 $27 $25 $24 $22 $21 $21 $20 $20 $19Opex ($/boe) $3.00 $3.00 $3.00 $3.00 $3.00 $3.00 $3.00 $3.00 $3.00 $3.00 $3.00 $3.00 $3.00 $3.00 $3.00 $3.00 $3.00Opex ($mm) $96 $87 $78 $70 $63 $57 $51 $46 $41 $37 $34 $30 $27 $24 $22 $20 $18Uplift ($mm) $12 $11 $10 $9 $8 $7 $6 $6 $5 $5 $4 $4 $4 $3 $3 $3 $3Total Costs ($mm) $174 $154 $137 $122 $110 $98 $89 $81 $73 $67 $61 $57 $52 $49 $45 $42 $40Cost Recovery ($mm) $174 $154 $137 $122 $110 $98 $89 $81 $73 $67 $61 $57 $52 $49 $45 $42 $40Memo: C/R Carryforward ($mm) $0 $0 $0 $0 $0 $0 $0 $0 $0 $0 $0 $0 $0 $0 $0 $0 $0Profit Oil - 100% ($mm) $724 $654 $590 $532 $480 $432 $388 $349 $313 $281 $252 $225 $201 $180 $160 $143 $127Profit Oil (Contractor) $724 $654 $590 $532 $480 $432 $388 $349 $313 $281 $252 $225 $201 $180 $160 $143 $127Profit Oil (Government) $0 $0 $0 $0 $0 $0 $0 $0 $0 $0 $0 $0 $0 $0 $0 $0 $0Memo: Oil Entitlement (kbpd) 87 78 71 64 57 51 46 42 38 34 30 27 25 22 20 18 16Memo: Gas Entitlement (mmcfd) 0 0 0 0 0 0 0 0 0 0 0 0 0 0 0 0 0Memo: Total Entitlement (kboepd) 87 78 71 64 57 51 46 42 38 34 30 27 25 22 20 18 16Memo: Total Entitlement (mmboe) 32 29 26 23 21 19 17 15 14 12 11 10 9 8 7 7 6Memo: Total Entitlement (%) 100% 100% 100% 100% 100% 100% 100% 100% 100% 100% 100% 100% 100% 100% 100% 100% 100%Provincial Taxes ($mm) $0 $0 $0 $0 $0 $0 $0 $0 $0 $0 $0 $0 $0 $0 $0 $0 $0Income Taxes ($mm) ($564) ($510) ($460) ($415) ($374) ($337) ($303) ($272) ($244) ($219) ($196) ($176) ($157) ($140) ($125) ($111) ($99)Bonuses ($mm) $0 $0 $0 $0 $0 $0 $0 $0 $0 $0 $0 $0 $0 $0 $0 $0 $0NOC Capex Carry ($mm) $0 $0 $0 $0 $0 $0 $0 $0 $0 $0 $0 $0 $0 $0 $0 $0 $0Contractor Take ($mm) $334 $298 $267 $239 $215 $193 $174 $157 $142 $129 $117 $106 $97 $88 $80 $74 $68FCF ($mm) $220 $194 $172 $152 $135 $119 $106 $94 $84 $74 $66 $59 $52 $46 $41 $37 $32Discount Rate (%) 10% 10% 10% 10% 10% 10% 10% 10% 10% 10% 10% 10% 10% 10% 10% 10% 10%Cumulative Discounted FCF ($mm) $944 $830 $729 $639 $559 $487 $423 $364 $311 $263 $219 $178 $140 $104 $71 $39 $8S IMMONS & C OMPANY I NTERNATIONAL 15
Iran Project ModelYear (3) (2) (1) 0 1 2 3 4 5 6 7 8 9 10 11 12 13Oil Price ($/bbl) $30.00 $30.00 $30.00 $30.00 $30.00 $30.00 $30.00 $30.00 $30.00 $30.00 $30.00 $30.00 $30.00 $30.00 $30.00 $30.00 $30.00Oil Price Differential ($/bbl) ($2.00) ($2.00) ($2.00) ($2.00) ($2.00) ($2.00) ($2.00) ($2.00) ($2.00) ($2.00) ($2.00) ($2.00) ($2.00) ($2.00) ($2.00) ($2.00) ($2.00)Gas Price ($/mmbtu) $5.00 $5.00 $5.00 $5.00 $5.00 $5.00 $5.00 $5.00 $5.00 $5.00 $5.00 $5.00 $5.00 $5.00 $5.00 $5.00 $5.00Gas Price Differential ($/mmbtu) (1) (1) (1) (1) (1) (1) (1) (1) (1) (1) (1) (1) (1) (1) (1) (1) (1)Oil <strong>Production</strong> (kbpd) 0 0 0 0 63 225 250 250 225 203 182 164 148 133 120 108 97Memo: Oil <strong>Production</strong> (mmb) 0 0 0 0 23 83 92 92 83 75 67 60 54 49 44 40 36Gas <strong>Production</strong> (mmcfd) 0 0 0 0 0 0 0 0 0 0 0 0 0 0 0 0 0Memo: Gas <strong>Production</strong> (bcf) 0 0 0 0 0 0 0 0 0 0 0 0 0 0 0 0 0<strong>Production</strong> (kboepd) 0 0 0 0 63 225 250 250 225 203 182 164 148 133 120 108 97Gross Revenue ($mm) $0 $0 $0 $0 $644 $2,318 $2,576 $2,576 $2,318 $2,087 $1,878 $1,690 $1,521 $1,369 $1,232 $1,109 $998Royalty ($/boe) $0.00 $0.00 $0.00 $0.00 $0.00 $0.00 $0.00 $0.00 $0.00 $0.00 $0.00 $0.00 $0.00 $0.00 $0.00 $0.00 $0.00Royalty (kboed) 0 0 0 0 0 0 0 0 0 0 0 0 0 0 0 0 0Royalty ($mm) $0 $0 $0 $0 $0 $0 $0 $0 $0 $0 $0 $0 $0 $0 $0 $0 $0Severance ($mm) $0 $0 $0 $0 $0 $0 $0 $0 $0 $0 $0 $0 $0 $0 $0 $0 $0Capital Costs ($mm) $173 $173 $1,037 $1,383 $346 $346 $17 $17 $17 $17 $17 $17 $17 $17 $17 $17 $17Memo: Gross Invested Capital ($mm) $173 $346 $1,383 $2,765 $1,766 $736 $242 $85 $36 $20 $15 $14 $13 $13 $13 $13 $13Fiscal Depreciation ($mm) $0 $0 $0 $0 $1,345 $1,376 $512 $174 $67 $33 $22 $19 $18 $17 $17 $17 $17Opex ($/boe) $0.00 $0.00 $0.00 $0.00 $1.50 $3.00 $3.00 $3.00 $3.00 $3.00 $3.00 $3.00 $3.00 $3.00 $3.00 $3.00 $3.00Opex ($mm) $0 $0 $0 $0 $69 $248 $276 $276 $248 $224 $201 $181 $163 $147 $132 $119 $107Uplift ($mm) $8 $20 $70 $157 $525 $478 $224 $122 $82 $66 $57 $51 $46 $42 $38 $35 $32Total Costs ($mm) $8 $20 $70 $157 $1,939 $2,102 $1,011 $571 $397 $322 $280 $251 $227 $206 $188 $171 $156Cost Recovery ($mm) $0 $0 $0 $0 $386 $1,391 $1,546 $1,546 $1,391 $338 $280 $251 $227 $206 $188 $171 $156Memo: C/R Carryforward ($mm) $7 $26 $96 $253 $1,806 $2,518 $1,983 $1,009 $15 $0 $0 $0 $0 $0 $0 $0 $0Profit Oil - 100% ($mm) $0 $0 $0 $0 $258 $927 $1,030 $1,030 $927 $1,749 $1,597 $1,439 $1,294 $1,163 $1,045 $938 $842Profit Oil (Contractor) $0 $0 $0 $0 $0 $0 $0 $0 $0 $0 $0 $0 $0 $0 $0 $0 $0Profit Oil (Government) $0 $0 $0 $0 $258 $927 $1,030 $1,030 $927 $1,749 $1,597 $1,439 $1,294 $1,163 $1,045 $938 $842Memo: Oil Entitlement (kbpd) 0 0 0 0 38 135 150 150 135 33 27 24 22 20 18 17 15Memo: Gas Entitlement (mmcfd) 0 0 0 0 0 0 0 0 0 0 0 0 0 0 0 0 0Memo: Total Entitlement (kboepd) 0 0 0 0 38 135 150 150 135 33 27 24 22 20 18 17 15Memo: Total Entitlement (mmboe) 0 0 0 0 14 50 55 55 50 12 10 9 8 7 7 6 6Memo: Total Entitlement (%) 0% 0% 0% 0% 30% 60% 60% 60% 60% 16% 15% 15% 15% 15% 15% 15% 16%Provincial Taxes ($mm) $0 $0 $0 $0 $0 $0 $0 $0 $0 $0 $0 $0 $0 $0 $0 $0 $0Income Taxes ($mm) $0 $0 $0 $0 $0 $0 $0 $0 $0 $0 $0 $0 $0 $0 $0 $0 $0Bonuses ($mm) $50 $0 $0 $0 $0 $0 $0 $0 $0 $0 $0 $0 $0 $0 $0 $0 $0NOC Capex Carry ($mm) $0 $0 $0 $0 $0 $0 $0 $0 $0 $0 $0 $0 $0 $0 $0 $0 $0Contractor Take ($mm) $0 $0 $0 $0 $386 $1,391 $1,546 $1,546 $1,391 $338 $280 $251 $227 $206 $188 $171 $156FCF ($mm) ($203) ($173) ($1,037) ($1,383) ($28) $797 $1,252 $1,252 $1,125 $97 $62 $53 $47 $42 $38 $35 $32Discount Rate (%) 10% 10% 10% 10% 10% 10% 10% 10% 10% 10% 10% 10% 10% 10% 10% 10% 10%Cumulative Discounted FCF ($mm) $424 $646 $1,553 $3,049 $3,833 $3,560 $2,706 $1,678 $645 $327 $291 $264 $240 $219 $201 $184 $16816S IMMONS & C OMPANY I NTERNATIONAL
Iran Project Model (continued)Year 14 15 16 17 18 19 20 21 22 23 24 25 26 27 28 29 30Oil Price ($/bbl) $30.00 $30.00 $30.00 $30.00 $30.00 $30.00 $30.00 $30.00 $30.00 $30.00 $30.00 $30.00 $30.00 $30.00 $30.00 $30.00 $30.00Oil Price Differential ($/bbl) ($2.00) ($2.00) ($2.00) ($2.00) ($2.00) ($2.00) ($2.00) ($2.00) ($2.00) ($2.00) ($2.00) ($2.00) ($2.00) ($2.00) ($2.00) ($2.00) ($2.00)Gas Price ($/mmbtu) $5.00 $5.00 $5.00 $5.00 $5.00 $5.00 $5.00 $5.00 $5.00 $5.00 $5.00 $5.00 $5.00 $5.00 $5.00 $5.00 $5.00Gas Price Differential ($/mmbtu) (1) (1) (1) (1) (1) (1) (1) (1) (1) (1) (1) (1) (1) (1) (1) (1) (1)Oil <strong>Production</strong> (kbpd) 87 78 71 64 57 51 46 42 38 34 30 27 25 22 20 18 16Memo: Oil <strong>Production</strong> (mmb) 32 29 26 23 21 19 17 15 14 12 11 10 9 8 7 7 6Gas <strong>Production</strong> (mmcfd) 0 0 0 0 0 0 0 0 0 0 0 0 0 0 0 0 0Memo: Gas <strong>Production</strong> (bcf) 0 0 0 0 0 0 0 0 0 0 0 0 0 0 0 0 0<strong>Production</strong> (kboepd) 87 78 71 64 57 51 46 42 38 34 30 27 25 22 20 18 16Gross Revenue ($mm) $898 $808 $728 $655 $589 $530 $477 $430 $387 $348 $313 $282 $254 $228 $205 $185 $166Royalty ($/boe) $0.00 $0.00 $0.00 $0.00 $0.00 $0.00 $0.00 $0.00 $0.00 $0.00 $0.00 $0.00 $0.00 $0.00 $0.00 $0.00 $0.00Royalty (kboed) 0 0 0 0 0 0 0 0 0 0 0 0 0 0 0 0 0Royalty ($mm) $0 $0 $0 $0 $0 $0 $0 $0 $0 $0 $0 $0 $0 $0 $0 $0 $0Severance ($mm) $0 $0 $0 $0 $0 $0 $0 $0 $0 $0 $0 $0 $0 $0 $0 $0 $0Capital Costs ($mm) $17 $17 $17 $17 $17 $17 $17 $17 $17 $17 $17 $17 $17 $17 $17 $17 $17Memo: Gross Invested Capital ($mm) $13 $13 $13 $13 $13 $13 $13 $13 $13 $13 $13 $13 $13 $13 $13 $13 $13Fiscal Depreciation ($mm) $17 $17 $17 $17 $17 $17 $17 $17 $17 $17 $17 $17 $17 $17 $17 $17 $17Opex ($/boe) $3.00 $3.00 $3.00 $3.00 $3.00 $3.00 $3.00 $3.00 $3.00 $3.00 $3.00 $3.00 $3.00 $3.00 $3.00 $3.00 $3.00Opex ($mm) $96 $87 $78 $70 $63 $57 $51 $46 $41 $37 $34 $30 $27 $24 $22 $20 $18Uplift ($mm) $29 $27 $25 $23 $21 $19 $18 $17 $16 $15 $14 $13 $12 $11 $11 $10 $10Total Costs ($mm) $143 $131 $120 $110 $101 $94 $86 $80 $74 $69 $64 $60 $56 $53 $50 $47 $45Cost Recovery ($mm) $143 $131 $120 $110 $101 $94 $86 $80 $74 $69 $64 $60 $56 $53 $50 $47 $45Memo: C/R Carryforward ($mm) $0 $0 $0 $0 $0 $0 $0 $0 $0 $0 $0 $0 $0 $0 $0 $0 $0Profit Oil - 100% ($mm) $755 $678 $608 $545 $488 $437 $391 $350 $312 $279 $249 $222 $197 $175 $155 $138 $122Profit Oil (Contractor) $0 $0 $0 $0 $0 $0 $0 $0 $0 $0 $0 $0 $0 $0 $0 $0 $0Profit Oil (Government) $755 $678 $608 $545 $488 $437 $391 $350 $312 $279 $249 $222 $197 $175 $155 $138 $122Memo: Oil Entitlement (kbpd) 14 13 12 11 10 9 8 8 7 7 6 6 5 5 5 5 4Memo: Gas Entitlement (mmcfd) 0 0 0 0 0 0 0 0 0 0 0 0 0 0 0 0 0Memo: Total Entitlement (kboepd) 14 13 12 11 10 9 8 8 7 7 6 6 5 5 5 5 4Memo: Total Entitlement (mmboe) 5 5 4 4 4 3 3 3 3 2 2 2 2 2 2 2 2Memo: Total Entitlement (%) 16% 16% 16% 17% 17% 18% 18% 19% 19% 20% 21% 21% 22% 23% 24% 26% 27%Provincial Taxes ($mm) $0 $0 $0 $0 $0 $0 $0 $0 $0 $0 $0 $0 $0 $0 $0 $0 $0Income Taxes ($mm) $0 $0 $0 $0 $0 $0 $0 $0 $0 $0 $0 $0 $0 $0 $0 $0 $0Bonuses ($mm) $0 $0 $0 $0 $0 $0 $0 $0 $0 $0 $0 $0 $0 $0 $0 $0 $0NOC Capex Carry ($mm) $0 $0 $0 $0 $0 $0 $0 $0 $0 $0 $0 $0 $0 $0 $0 $0 $0Contractor Take ($mm) $143 $131 $120 $110 $101 $94 $86 $80 $74 $69 $64 $60 $56 $53 $50 $47 $45FCF ($mm) $29 $27 $25 $23 $21 $19 $18 $17 $16 $15 $14 $13 $12 $11 $11 $10 $10Discount Rate (%) 10% 10% 10% 10% 10% 10% 10% 10% 10% 10% 10% 10% 10% 10% 10% 10% 10%Cumulative Discounted FCF ($mm) $154 $141 $128 $117 $107 $97 $87 $78 $70 $61 $53 $45 $37 $29 $20 $11 $2S IMMONS & C OMPANY I NTERNATIONAL 17
Appendix DAnalyst Certification:I, Robert Kessler, hereby certify that the views expressed in this research report to the best of my knowledge, accurately reflect mypersonal views about the subject compan(ies) and its (their) securities; and that, I have not been, am not, and will not be receivingdirect or indirect compensation in exchange for expressing the specific recommendation(s) or views in this research report.Important Disclosures:For detailed rating information, go to http://publicdisclosure.simmonsco-intl.com. Additional information is available uponrequest. Research analysts compensation is based upon (among other things) the firm's general investment banking revenues.Simmons & Company International may seek compensation for investment banking services from Amerada-Hess Corp.,BPp.l.c.,BG Group plc,Chevron Corporation,Eni S.p.A.,Marathon Oil Corporation,Norsk Hydro ASA,Occidental PetroleumCorp,Petro-Canada,Royal Dutch Petroleum Company,Royal Dutch Shell plc.,Shell Transport & Trading,Statoil ASA,SuncorEnergy Inc.,TOTAL S.A.,Exxon Mobil Corporation and other companies for which research coverage is provided. The firm wouldexpect to receive compensation for any such services.One of the analysts, or a member of the analyst's household, responsible for the preparation/supervision of this report has a LongStock position in Exxon Mobil Corporation.Foreign Affiliate Disclosure:This report may be made available in the United Kingdom through distribution by Simmons & Company International Limited, afirm authorized and regulated by the Financial Services Authority to undertake designated investment business in the UnitedKingdom. Simmons & Company International Limited's policy on managing investment research conflicts is available by request.The research report is directed only at persons who have professional experience in matters relating to investments who fall withinthe definition of investment professionals in Article 19(5) Financial Services and Markets Act (Financial Promotion) Order 2001 (asamended) ("FPO"); persons who fall within Article 49(2)(a) to (d) FPO (high net worth companies, unincorporated associationsetc.) or persons who are otherwise market counterparties or intermediate customers in accordance with the FSA Handbook of Rulesand Guidance ("relevant persons"). The research report must not be acted on or relied upon by any persons who receive it withinthe EEA who are not relevant persons. Simmons & Company International Limited is located at 33 Queens Road, Aberdeen,Scotland; and 54 St. James’s Street, London, United Kingdom.Disclaimer:This e-mail is based on information obtained from sources which Simmons & Company International believes to be reliable, butSimmons & Company does not represent or warrant its accuracy. The opinions and estimates contained in the e-mail represent theviews of Simmons & Company as of the date of the e-mail, and may be subject to change without prior notice. Simmons &Company International will not be responsible for the consequence of reliance upon any opinion or statement contained in this e-mail. This e-mail is confidential and may not be reproduced in whole or in part without the prior written permission of Simmons &Company International.17S IMMONS & C OMPANY I NTERNATIONAL
This Page Intentionally Left Blank
Simmons & Company InternationalInstitutional Securities Groupwww.simmonsco-intl.comSimmons & Company InternationalHoustonBoston700 Louisiana, Suite 5000 125 Summer Street, Suite 1660Houston, Texas 77002 Boston, Massachusetts 02110Phone: (713) 223-7840 Phone: (617) 531-5573Fax: (713) 223-7845 Fax: (617) 531-5660Institutional Sales: (800) 856-5508Trading – Listed: (800) 856-3241Trading – OTC: (800) 856-3240International Watts: (0800) 894-253Email: research@simmonsco-intl.comSimmons & Company International LimitedAberdeenLondon33 Queens Road Bennet HouseAberdeen AB15 4ZN54 St. James’s StreetScotlandLondon SW1A 1JTPhone: 011-44-1224-202-300United KingdomFax: 011-44-1224-202-303 Phone: 011-44-207-514-9500Fax: 011-44-207-514-9516Clearing ThroughPershing LLC700 Louisiana, Suite 5000 Houston, Texas 77002 (713) 223-7840 Fax: (713) 223-7845